1
Overdensity of X-Ray sources near 3C 295: a candidate filament
Abstract
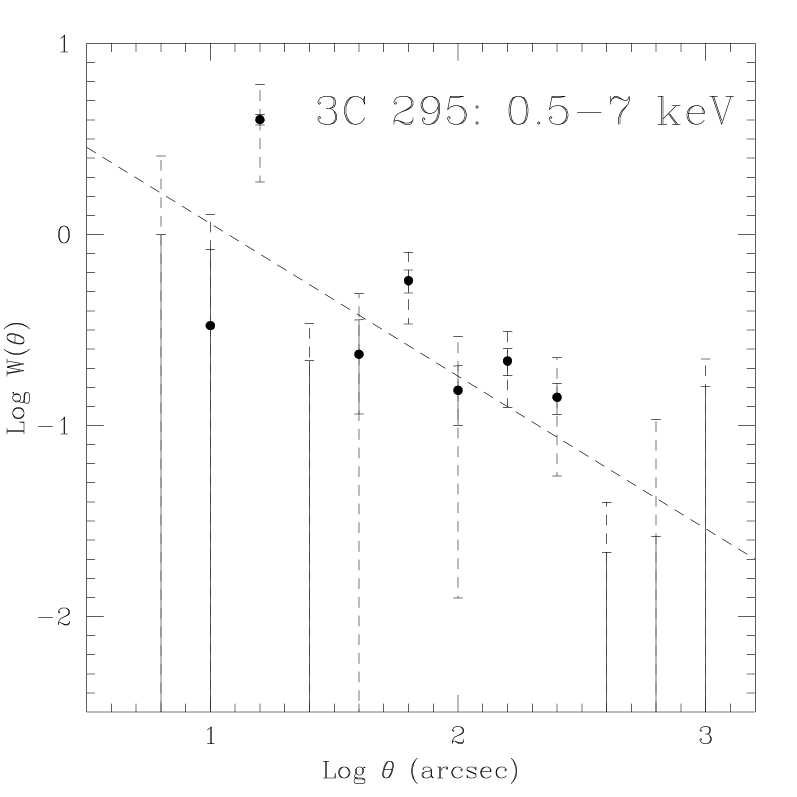
We present a statistical analysis of the Chandra observation of the source field around the 3C 295 galaxy cluster () aimed at the search for clustering of X-ray sources. Three different methods of analysis, namely a chip by chip logN-logS, a two dimensional Kolmogorov-Smirnov test, and the angular correlation function (ACF) show a strong overdensity of sources in the North-East of the field. In particular, the ACF shows a clear signal on scales of arcmin, correlation angle in the keV band, , % confidence limit (assuming a power law ACF with slope ). This correlation angle is times higher than that of a sample of ACIS-I field at the confidence level. If this overdensity is spatially associated to the cluster, we are observing a ’filament’ of the large scale structure of the Universe. We discuss some first results that seem to indicate such an association.
1 Introduction
N-body and hydrodynamical simulations show that high redshift clusters of galaxies lie at the nexus of several filaments of galaxies (see e.g. Peacock 1999). Such filaments map out the “cosmic web” of voids and filaments of the large scale structure of the Universe. Thus, rich clusters represent good indicators of regions of sky where several filaments converge. The filaments themselves could be mapped out by Active Galactic Nuclei (AGNs), assuming that AGNs trace galaxies.
Cappi et al. (2001) studied the distribution of the X-ray sources around 3C 295 (). The cluster was observed with the ACIS-S CCD array for a short exposure time ( ks). They found a high source surface density in the keV band which exceeds the ROSAT (Hasinger et al. 1998) and Chandra (Giacconi et al. 2002) logN-logS by a factor of , with a significance of .
In this work an analysis of a deeper ( ks) Chandra observation of 3C 295 is performed, to check whether the overdensity of such a field in the keV band is real or not, to define the structure of the overdensity, and to extend the above considerations to the keV band.

2 Observation and Data reduction
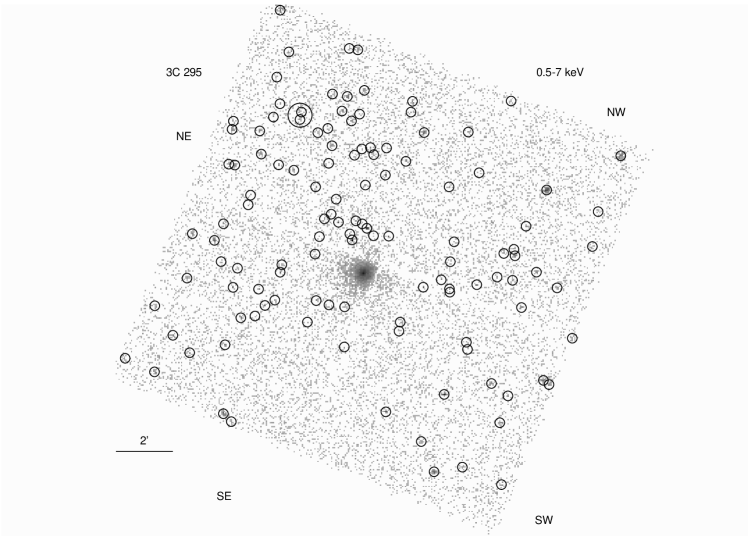
Chandra observed the field around the 3C 295 cluster with ACIS-I on May 18, 2001, for ks. The data reduction was carried out using the Chandra Interactive Analysis of Observations software version 2.1.3. All the analysis has been performed in the , and keV bands. An identical analysis was performed for the Chandra Deep Field South (CDFS) in the keV and keV bands for comparison, and to check our analysis methods. The source detection was carried out using the ‘PWDetect’ algorithm (Damiani et al. 1997). We identified sources in the keV band, sources in the keV band and sources in the keV band (see fig. 1, left). The counts in the keV, keV and keV bands were converted in keV, keV and keV fluxes using conversion factors appropriate for a power law spectrum with a galactic absorption toward the 3C 295 field of cm-2. Such values take into account the quantum efficiency degradation of the CCD.
3 Analysis
The following analysis has been perfomed. The sky coverage has been computed for 3C 295 and CDFS fields. The LogN-LogS in the soft and hard bands for the whole filelds have been produced. The LogN-LogS in the soft, hard and whole bands have been produced separately for each ACIS-I chip of the 3C 295 observation (see fig. 1, right for the keV band). 3C 295 chip-to-chip and CDFS LogN-LogS have been fitted to evaluate slopes and normalizations (fig. 2, left for the keV band). A two dimensional Kolmogorov-Smirnov test has been applied to check whether the sources were uniformly distributed or not. The angular correlation function (ACF) has been computed in order to estimate at which scales the sources in the two fields were clustered. The ACF has been evaluated also for a sample of Chandra fields with an axposure time similar to that of 3C 295. The errors associated to the functions (fig. 2, centre and right) have been calculated using both poisson and bootstrap statistics (Barrow, Bhavsar & Sonoda 1984)
4 Main results
The following results have been achieved. 3C 295 and CDFS LogN-LogS are in very good agreement both in the soft and hard band, and with the CDFS LogN-LogS by Rosati et al. 2002. The 3C 295 LogN-LogS in the soft, hard and broad bands computed separately for each ACIS-I chip show an overdensity of sources in the North-East (NE) chip (fig. 1, right) which reflects the clustering of sources clearly visible in fig. 1 (left and centre). The discrepancy between the normalization of the LogN-LogS for the NE and SW chip is , and in the soft, hard and broad band, respectively; fig. 2, left shows the normalization vs. slope plot for the broad band.
The two dimensional Kolmogorov-Smirnov test shows that there is a considerable probability that CDFS sources are uniformly distributed ( in the soft and hard bands), while the probability that the 3C 295 sources are uniformly distributed is only a few per cent, and drops below 1% if we consider the keV band.
The angular correlation function of the 3C 295 sources features a strong signal on scales of a few arcmins, and also on lower scales in the keV band (fig. 2, centre). Moreover, the function is above the value found by Vikhlinin & Forman (1995) for a large sample of ROSAT sources. On the other hand, no signs of a similar behavior is featured by the CDFS and the sample of the Chandra fields (fig. 2, right)


5 Association with the cluster: first hints
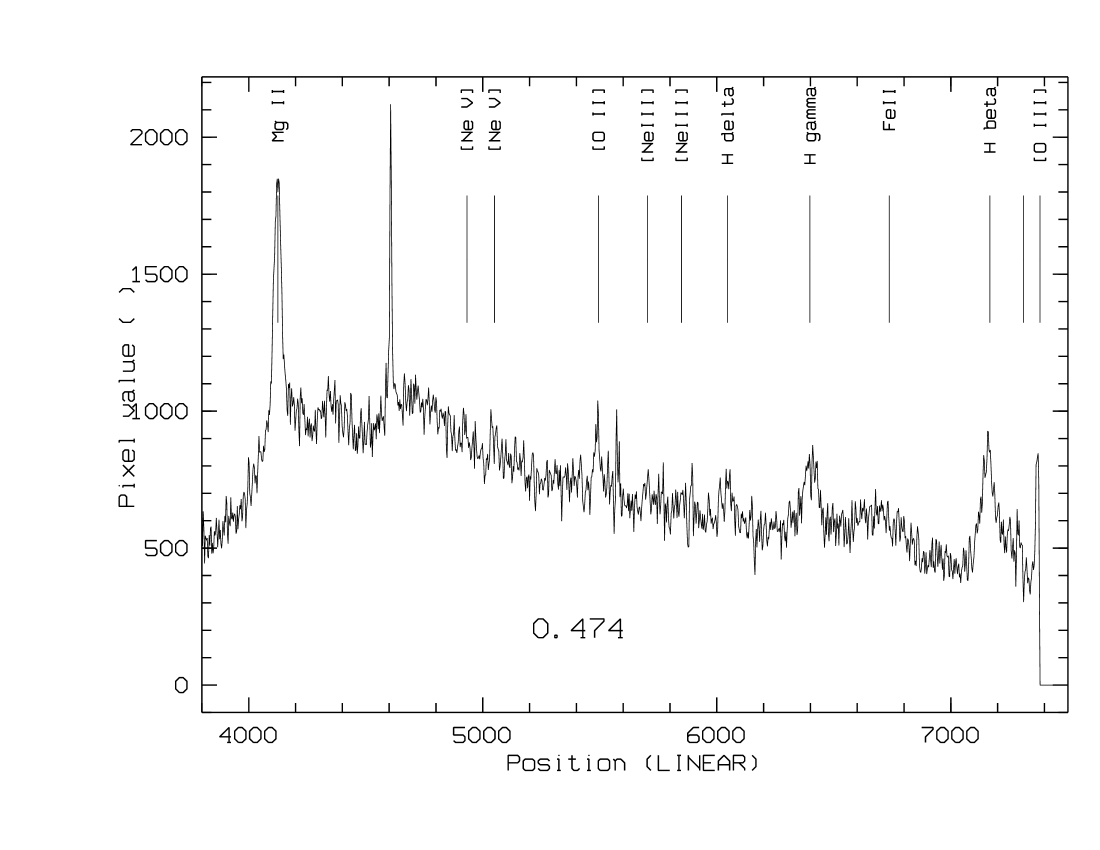
A work to verify if the overdensity is associated to 3C 295 is in progress. Two nights of observation at the TNG have been obtained, but unfortunately only a few hours of observing time were completed due to technical and weather problems. For this reason we could spectroscopically identify only ten sources. Nevertheless, we identified a source in the NE chip close to the cluster (see fig. 3, left); moreover, we found three more sources with a redshift in the range . Although more optical identifications are needed, this is a first clue that points in the direction of on association between the cluster and the overdensity. Waiting for more optical data to come, we searched for more evidences of this association. We extracted the stacked spectrum of all the NE sources and we fitted it with a power law plus a double warm absorber ( and ) model. Then we added a line to this model at keV, the Energy of the Fe line at for a source at (see fig. 3, right); the goodness of the model increased and the normalization of the line is counts s-1 keV-1 at the confidence level. This is another clue for the association we are seeking.
6 Conclusions
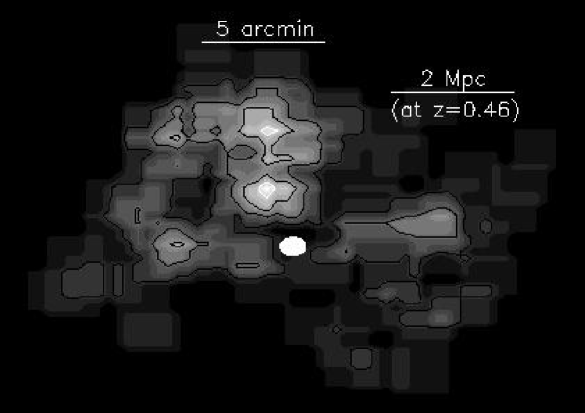
In this work we studied the excess of sources clearly visible in the upper left corner of the Chandra observation of the 3C 295 galaxy cluster field (see fig. 1, see D’Elia et al. 2004 for more details). Since N-body and hydrodynamical simulations show that clusters of galaxies lie at the nexus of several filaments, this excess could represent a filament of the large scale structure of the Universe.
Moreover, if the redshift of our sources were the same of 3C 295 () the galaxy overdensity of the field (assuming a spherical distribution) is intriguingly close to the expected galaxy overdensity of filaments. Works are in progress to check this possibility (D’Elia et al. in prep). A first set of optical data have been analyzed and a few sources close to the central cluster have been identified. In addition, the X-ray stacked spectrum of the excess sources shows an emission line at keV ( confidence level) which could be the redshifted Fe line at keV. More optical and new X-ray data are needed in order to confirm the association and to study the filament properties to larger scales.
References
- (1) Barrow, J. D., Bhavsar, S. P., & Sonoda, D. H., 1984, MNRAS, 210, 19
- (2) Cappi, M. et al., 2001, ApJ, 548, 624
- (3) Damiani, F., Maggio, A., Micela, G. & Sciortino, S., 1997, ApJ, 483, 350
- (4) D’Elia, V. et al., 2004, A&A in press (astro-ph/0403401)
- (5) Hasinger, G. et al., 1998, A&A, 329, 482
- (6) Peacock, J. A., 1999, “Cosmological Physics” (Cambridge: Cambridge University Press)
- (7) Rosati, P. et al., 2002, ApJ, 566, 667
- (8) Vikhlinin, A. & Forman, A., 1995, ApJL, 455, 109