Molecular and ionized gas in the tidal tail in Stephan’s Quintet
We have mapped with the IRAM interferometer at Plateau de Bure (PdBI) the 12CO emission towards intergalactic star forming regions located in the tidal tail stemming from NGC 7319, in the Stephan’s Quintet compact group of galaxies. The 13CO emission of the same region was observed with the IRAM 30m telescope and optical spectroscopy of several Hii regions in the area were obtained with the Calar Alto 3.5m telescope.We recovered with the interferometer about 50% of the 12CO(1–0) total emission that had been earlier measured with single dish observations (Lisenfeld et al. 2002), indicating that about half of the molecular gas is distributed on spatial scales larger than about 10-15” (corresponding to 4-6 kpc) to which PdBI is not sensitive. We find two main areas of CO emission: (i) an elongated region towards the area known as SQ B where a Tidal Dwarf Galaxy could currently be forming (ii) a barely resolved area at the tip of the optical tidal arm. Both regions follow dust lanes visible on HST images and their CO peak coincides spatially exactly with the maximum of the H line emission. In SQ B, there is furthermore very good kinematical agreement between the CO, H and HI components. We conclude from these coincidences that the gaseous matter found in quantities in the area is physically associated to the optical tidal tail and thus that the intergalactic atomic hydrogen there was expelled from NGC 7319. Its origin had previously been much debated. Furthermore, the relatively high oxygen abundances (about solar) estimated from the optical spectra of the Hii regions imply that the gas feeding the star formation originated from the inner regions of the parent galaxy. In SQ B, we derive from different tracers a star formation rate, corrected for dust extinction - which is important in the area - of 0.5 M⊙/yr, i.e. one of the highest values so far measured outside galaxies. The inferred molecular gas consumption time of 0.5 Gyr lies in the range of values found for spiral and starburst galaxies. On the other hand, the ratio of 12CO/13CO is much higher than the values found in disks of spiral galaxies. A relatively low opacity for the 12CO gas is the most likely reason.
Key Words.:
Stars: formation – ISM: molecules – Galaxies: clusters: individual (Stephan’s Quintet) – Galaxies: interaction – Galaxies: ISM – intergalactic medium1 Introduction
The Hickson Compact Group Stephan’s Quintet (Hickson Compact Group 92; hereafter SQ) consists of four interacting galaxies (NGC 7319, NGC 7318a, NGC 7318b, and NGC 7317) and a foreground galaxy (NGC 7320). A fifth galaxy, NGC 7320c, situated 4 arcmin to the east, is also dynamically associated to the group. The group has experienced a violent dynamical history with numerous interactions between the different members during the past Gyr (see Moles et al. (1997) and Sulentic et al. (2001) for plausible scenarios). As a result of these interactions, two tidal arms, a faint older one, and a brighter young one stemming from NGC 7319, have been created towards the eastern side of the group. Sulentic et al. (2001) suggest that each of these tails was created by a passage of NGC 7320c, the galaxy towards which both tails are pointing.
Several knots of star formation (SF) are visible in the young tidal arm extending from NGC 7319 to the east. The brightest region, identified as B by Xu et al. (1999) and hereafter called SQ B, shows also mid-infrared and H emission. This region has been identified as a good candidate for a Tidal Dwarf Galaxy (TDG) (Lisenfeld et al. 2002). Another fainter SF region is visible at the very tip of the tidal tail, hereafter called SQ tip.
One of the most striking properties of this group is that the major part of the gas is in the intragroup medium. Abundant atomic gas is present to the east of the three central galaxies. Williams et al. (2002) concluded from the HI kinematics that in reality this gas clouds consist of two subclouds, which they called Arc-N and Arc-S. Arc-N coincides at its southern end with the young tidal tail and Arc-S largely overlaps with the old tidal tail. In the northern part of Arc-N several Hii regions are detected (Sulentic et al. 2001, Mendes de Oliveira et al. 2004). The origin of the gas is unclear. A plausible explanation for the gas in Arc-N is that it has been stripped from NGC 7319, the galaxy where the young tidal tail starts (Sulentic et al. 2001). A definite physical relation between Arc-N and the young stellar tail is however not proven, the apparent overlap could in principle be a projection effect. The only argument in favor of a real association is the fact that the sharp inner edge of the gas cloud follows the shape of the stellar optical tail (Sulentic et al. 2001). Part of the HI could also have been stripped from NGC 7320c, the other spiral galaxy in the group which completely lacks atomic gas.
Lisenfeld et al. (2002) observed the region around SQ B, close to the peak of the HI distribution, with the IRAM 30m telescope and found abundant molecular gas (M⊙) covering a huge area of about 20 kpc. In this paper we present new millimeter observations of 12CO with the IRAM interferometer at Plateau de Bure covering the region around SQ B and SQ tip. The goal of these observations was to map the distribution of the molecular gas at a higher spatial resolution and to study its relation to the SF regions in the tidal tails. Furthermore, we obtained optical spectroscopy of SQ B and SQ tip in order to further study the physics of the star forming regions, as well as observations of SQ B with the IRAM 30m telescope of 13CO in order to collect more information about the physical state of the molecular gas.
In Sect. 2, we describe the observations; in Sect. 3, we present the results; in Sect. 4, we discuss some of their implications and Sect. 5 gives a summary of our most important results and conclusions. We adopt a distance of 85 Mpc, based on a recession velocity of 6400 km s-1 to SQ and H0=75 km s-1 Mpc-1, in which case 10″ correspond to 4.1 kpc.
2 Observations and data reduction
2.1 Plateau de Bure Interferometer
Observations of the eastern young tidal tail of SQ were carried out with the IRAM interferometer at Plateau de Bure (PdBI)111Based on observations carried out with the IRAM Plateau de Bure Interferometer. IRAM is supported by INSU/CNRS (France), MPG (Germany) and IGN (Spain). between May and December 2002, using the CD set of configurations of the array.
We observed simultaneously the J=1–0 and J=2–1 lines of 12CO in a single field centered at and . The primary beam size which gives the diameter beyond which the sensitivity of the instruments falls below half of its sensitivity at the center, is 44′′ (22′′) in the 1–0 (2–1) line. The spectral correlator was split in two halves centered at 112.788 and 225.572 GHz, respectively, i.e., the transition rest frequencies corrected for an assumed recession velocity of km s-1. We observed each line in parallel with two correlator configurations: a high-resolution configuration with a frequency resolution of 0.312 MHz and a bandwidth of 80 MHz , corresponding to a velocity resolution of 0.83 km s-1 and a bandwidth of 212 km s-1 at CO(1–0), and a low-resolution configuration with a frequency resolution of 1.28 MHz and a bandwidth of 320 MHz , corresponding to a velocity resolution of 3.32 km s-1 and a bandwidth of 830 km s-1 at CO(1–0). Since the high-resolution data were rather noisy, we only use the low-resolution data cube in this paper. Phase and amplitude calibrations were performed by observing the nearby quasars 2145+065, 2201+315, 2234+282, 3C454.3, 3C273 and 1633+382, as well as MWC349. The fluxes of the primary calibrators were determined from IRAM 30m measurements and taken as an input to derive the absolute flux density scale in our map; the latter is estimated to be accurate to 10%. We estimate the uncertainty in the final flux calibration to be about 20%.
The data of the 12CO(2–1) line were of poor quality and we will not use them in the analysis presented in this paper. The image reconstruction was done using standard IRAM/Gildas software. We used natural weighting and no taper to generate the 12CO(1–0) line maps with a 0.5″ sampling. The corresponding synthesized beam is , . During the process of data reduction we have also tested uniform weighting and different taperings in order to search for weaker emission features, but the resulting maps were not significantly different. The data, except for the displayed maps, are corrected for primary beam attenuation.
2.2 IRAM 30m telescope
We observed the 13CO(1–0) and 13CO(2–1) towards SQ B (centered at and ) with the IRAM 30m telescope on Pico Veleta in March 2004 under excellent weather conditions, with system temperatures of 115 K at 108 GHz and 210 K at 216 GHz on the scale. Dual polarization receivers were used at both frequencies with the 256 1 MHz filterbanks on each receiver. The observations were made with a wobbling secondary in beam switch mode with a wobbler throw of 70″ in azimuthal direction and a wobbling frequency of 0.5 Hz. Pointing was checked every 60 – 90 minutes on the nearby quasars 2251+158, and was very good, with rms offsets of less than ″ on average. At the end of the observations, the frequency tuning was checked by observing Orion. The IRAM forward efficiency, , was 0.95 and 0.91 at 115 and 230 GHz and the beam efficiency, , was 0.75 and 0.54, respectively. The half-power beam size was 22′′ at 110 GHz and 11′′ at 215 GHz. The CO spectra and luminosities are presented on the main beam temperature scale () which is defined as . For the data reduction, the spectra were summed and a constant continuum level was subtracted.
2.3 Optical observations
The spectra of the Hii regions towards SQ B were obtained in July 2003 with the MOSCA instrument installed on the Calar Alto 3.5m telescope. Using the multi-slit capabilities of the spectrograph, we obtained about 70 spectra of intergalactic Hii regions in the field of SQ. Each region was observed with a medium (R1000, 1.5 Å/pixel) and a low (B500, 2.9 Å/pixel) resolution grism. Special care was taken in positioning the slits and extracting the spectra. Most Hii regions have an extremely faint continuum, so that they could not be used to trace the spectrum along the dispersion direction. Hence, the aperture corrections were done by manually fitting the positions of the emission lines. The rest of the data reduction was carried out in a standard way using the IRAF software. Details of our spectroscopic study will be presented in a forthcoming paper (Duc et al., in preparation), and here we only report on results relevant to SQ B.
3 Results
3.1 Distribution and mass of the molecular gas
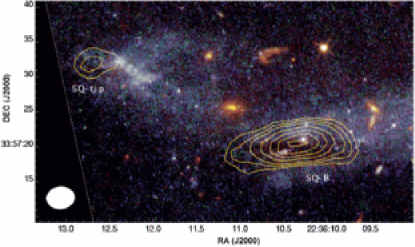
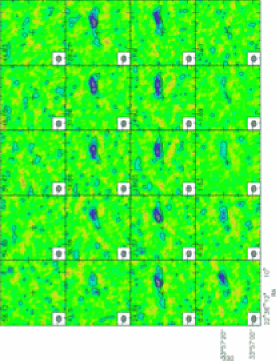
Fig. 1 shows the velocity integrated intensity map of the PdBI observations overlaid over an optical Hubble Space Telescope (HST) image (Gallagher et al. 2001). The CO emission is distributed mainly in two regions. The most prominent emission region has an elongated shape that roughly follows the tidal tail with the maximum centered on a dust lane crossing SQ B. Its overall extent is 18″7″or kpc. A much fainter emission region is visible at the tip of the tidal tail, SQ tip, slightly offset to the west from the tail and also coinciding with a dust lane. The integrated emission at this position is weak, but CO emission is clearly visible in the individual spectra. The molecular gas distribution with dimensions of about 5″7″(2 3 kpc) is only barely resolved by our beam. The channel maps (Fig. 2) reveal that the distribution of the CO within SQ B is not completely smooth but shows substructures appearing at different velocities.
In order to derive the total molecular gas masses in the different regions we have summed the spectra from the low velocity resolution data cube over the area where emission is visible in individual spectra. These summed spectra were then velocity integrated over the velocity range where emission was visible (6570 to 6670 km s-1) and the molecular mass was calculated assuming (as throughout this paper) the Galactic conversion factor of N(H2)/ICO = (K km s-1)-1. The formula used to calculate the molecular gas mass from the velocity integrated flux, , is:
| (1) |
where is the distance in Mpc. This formula corresponds to the one derived in Braine et al. (2001) (eq. 4) multiplied by a factor 0.73 in order to neglect the helium mass. The derived line fluxes and molecular gas masses are listed in Table 1.
The total molecular mass detected by the PdBI observations is M⊙. The total mass derived from the IRAM 30m observations (Lisenfeld et al. 2002), is M⊙, showing that the PdBI observations pick up only about half of the total CO emission, the rest being distributed on scales larger than about 10–15″ and therefore resolved out by the interferometer.
In order to better compare the spatial distribution of the compact and smoothly distributed emission in SQ B and SQ tip, we have co-added in each case the CO emission of the 30m observations over 2 beams, covering the area where emission was detected by the PdBI in SQ B and SQ tip. Table 1 summarizes the molecular gas masses derived from the IRAM 30m and PdBI in the individual regions. Due to the poor spatial resolution of the 30m observations, the corresponding regions do not coincide completely (the 30m data covers a larger area). The molecular gas masses observed at SQ B with PdBI is % of the mass detected with the 30m telescope in a slightly larger area. At the tip of the tidal tail, the PdBI observations detect a slightly lower fraction of about % of the total CO. Thus, within the uncertainties, the fraction of molecular gas picked up by the interferometer is not significantly different in both regions.
| Region | PdBI | IRAM 30m | |
|---|---|---|---|
| Flux | |||
| [Jy km s-1] | M⊙ | M⊙ | |
| SQ B | 4.4 1.0 | 2.5 0.6 | 3.9 0.9 |
| SQ tip | 1.5 0.4 | 0.8 0.2 | 1.9 0.5 |
| Total | 5.9 1.3 | 3.3 0.7 | 7.0 1.4(∗) |
The error includes both the formal error based on the rms noise in the integrated spectrum, the uncertainty in the calibration (20%) and, for the PdBI data, an estimate for uncertainties due to different parameters in the data reduction, above all during the cleaning process (10%).
(*) Refers to the central 15 beams observed with the 30m telescope (see Lisenfeld et al. 2002).
3.2 13CO in SQ B

The IRAM 30m observations of 13CO(2–1) resulted in a 3 detection. As shown in Fig. 3 the central line velocity agrees very well with the 12CO(2–1) line observed at the same position in Lisenfeld et al. (2002), so we are confident that the line is really detected. The velocity integrated intensity of 13CO(2–1) is K km s-1. However, no 13CO(1–0) was detected, down to a rms noise level of 1mK at a velocity resolution of 10 km s-1, which corresponds to an upper limit of 0.04 K km s-1.
We can calculate the line ratios between the 12CO and 13CO emission from the velocity integrated intensities of the 12CO lines at the same position: ICO(1–0)) = and ICO(1–0)) = (Lisenfeld et al. 2002). We find that 12CO(1–0)/13CO(1–0) and 12CO(2–1)/13CO(2–1) . These values are much higher than the value of 10 that is typically found in disks of spiral galaxies (e.g. Paglioni et al. 2001), and it is close to the values found for luminous infrared galaxies (Casoli et al. 1992).
3.3 Properties of the ionized gas
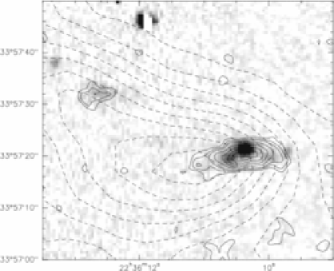
In SQ B, four individual Hii condensations are clearly visible on the H narrow band image (see Fig. 4). We obtained an optical spectrum of each one of them. All spectra are characterized by a weak continuum and strong emission lines. The equivalent width of the H line exceeds 200Å. Optical velocities (in the Local Standard of Rest, LSR, system) were derived from the redshifts of the Balmer lines in the medium-resolution spectra. They range between 6575-6765 km s-1. The brightest Hii region has an average velocity of 6625 km s-1 (range: 6575 - 6655 km s-1).
Assuming an intrinsic value of 2.85 for the Balmer decrement H/H, in agreement with Case B recombination models (Osterbrock 1989), we derive an as high as 3 mag for SQ B, consistent with the presence of a dust lane. The oxygen abundance of SQ B was determined empirically based on the [Nii]/H flux ratio and the calibration of van Zee et al. (1998). We obtained a value of 12+log(O/H) = 8.7 which is nearly solar (given the latest value of the oxygen abundance in the Sun, Allende Prieto et al. 2001). This value is rather high: Hii regions along tidal tails have typically a 12+log(O/H) = 8.4–8.6 (Duc et al. 2004). It implies that the gas that made SQ B was not expelled from the outer regions of its parent galaxy, but rather from inside the disk.
3.4 Comparison between the ionized and neutral gas
In Fig. 4 we present a contour overlay of the CO emission, detected by the PdBI, to the H emission (Iglesias-Páramo & Vílchez 2001, greyscale). Contours of the HI emission detected by Williams et al. (2002) are also shown with dashed lines. The exact spatial coincidence of the CO emission with the H emission in both SQ B and SQ tip is striking. Since dust is most likely coexisting with the molecular gas, this close correspondence is consistent with the high extinction obtained from the optical spectroscopy. The presence of dust is also clearly visible in SQ B in the optical image, where the peak of the CO emission coincides with a dust lane (see Fig. 1). We can estimate the expected extinction at the peak of the CO emission from the gas surface density adopting a Galactic extinction coefficient of mag cm-2 in the R-band (Draine 2003). From the HI data we derive a column density of 7 cm-2 for SQ B and our PdBI CO data correspond to a peak of 17 cm-2 at the same region. Assuming a foreground screen of dust, this implies an extinction of mag, slightly lower but in the similar range as the value found from the Balmer decrement. In SQ tip the observed column densities of cm-2 and cm-2 result in a somewhat lower extinction of mag.
The eastern end of the CO emission in SQ B coincides with the HI peak and extends towards the west in a region with a steep gradient in the HI distribution as already noted in Lisenfeld et al. (2002). This gradient goes along the optical tidal arm. Also in SQ tip, the CO emission lies at the end of this gradient.
3.5 Gas kinematics
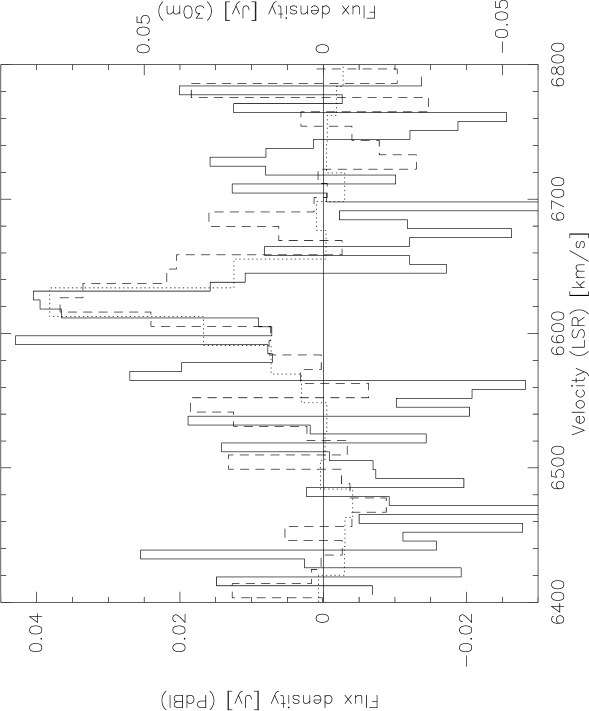
In Fig. 5 and 6 we show the spatially integrated spectra of SQ B and SQ tip, observed with the PdBI and the IRAM 30m telescope (solid and dashed lines respectively). In each case the IRAM 30m spectra are the sum of the two beams that cover the area with CO emission detected by PdBI. In addition we show with a dotted line the total HI spectra, co-added over the same area.
Clearly in SQ B both CO spectra agree very well in shape, central velocity and line width. The same is true for the total emission in this region detected with the 30m telescope (summing the emission of 15 beams that cover an area of about 60″ 40″, see Lisenfeld et al. 2002, Fig. 6) which extends over a larger region. The HI line has the same central velocity as the CO emission but it is slightly broader, which could be due to the poorer velocity resolution of this dataset. The central velocity and velocity range found for the molecular and atomic gas agree perfectly with the H emission of the strongest Hii region (see Tab. 2). The range of the other Hii regions extends to somewhat higher velocities.
Even though the CO spectra of SQ tip are noisier (see Fig. 6), we also see that the central velocity and line shape are in very good agreement between the CO spectrum from PdB, the CO spectrum from the 30m, and with the HI line.
| CO | H | |||
|---|---|---|---|---|
| central | velocity | central | velocity | |
| velocity | range | velocity | range | |
| [km/s] | [km/s] | [km/s] | [km/s] | |
| SQ B | 6625 | 6575–6665 | 6625(1) | 6575–6655(1) |
| – | 6575–6765(2) | |||
| SQ tip | 6625 | 6565–6640 | – | – |
(1) For the brightest Hii region coinciding with the peak of CO
(2) Refers to all 4 Hii regions

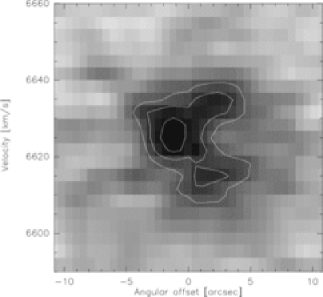
We have inspected the CO data cube from PdBI and searched for velocity gradients by inspecting the channel maps and by producing various position-velocity (pv) diagrams at various position angles. In SQ tip the emission is too weak to study the kinematics in detail. In Fig. 7 we show the pv-diagram of SQ B obtained in the east-west direction. It shows an interesting V-shape feature, visible towards the western side as a gap in velocities in the range between 6615 and 6630 km s-1. The interpretation of this feature is not clear. A possibility could be two components, one showing a velocity gradient and a second superposed component with a velocity offset of 25 km s-1. The H data also suggest a complex velocity structure, with large velocity gradients up to 200 km s-1 which need however to be confirmed by Fabry-Perot observation in order to exclude that they are artifacts.
3.6 Star formation rate and efficiency
| Tracer | SFR(SQ B) | SFR(SQ tip) |
|---|---|---|
| [M⊙/yr] | [M⊙/yr] | |
| H(1) | ||
| H(2) | 0.5 | |
| H(3) | 0.8 | – |
| 15 m | 0.5 | – |
| Radio continuum | 0.6 | – |
(1) No extinction correction
(2) Extinction correction of (SQ B) and (SQ tip), based on the gas surface density
(3) Extinction correction of derived from Balmer decrement
The star formation rate (SFR) at the two regions we detected in CO can be estimated using a number of tracers. The H emission is most commonly used, even though it suffers from extinction. The total H emission in SQ B and SQ tip is erg s-1 and erg s-1, respectively. The first value is from Xu et al. (1999) whose H image only covered SQ B but not SQ tip, and is corrected for NII contamination, assuming [NII6538]/H=0.4. The second one is from Iglesias-Páramo & Vílchez (2001), after calibrating their deep H image using the SQ B flux derived by Xu et al. (1999). We can convert these H fluxes to a SFR, using the usual formula SFR of Kennicutt (1998), which assumes an Initial Mass Function (IMF) with a Salpeter slope over the 0.1 to 100 M⊙ range. In Table 3 we present the SFR estimates for different extinction corrections.
In SQ B the SFR can also be measured using two extinction-free tracers, the thermal dust emission and the radio continuum. The luminosity at 15 m of SQ B is L⊙ (Xu et al. 1999, after correcting their value to our assumed distance). Applying the empirical relation of Roussel et al. (2001), SFR /L⊙, we obtained a value of 0.5 M⊙yr-1.
A final estimate for the SFR can be made from the radio continuum. Emission at 1.40 GHz was detected from SQ B at a level of mJy (Xu et al. 2003) corresponding to a radio luminosity of W Hz-1. The spectral index between 1.40 GHz and 4.86 GHz of found by Xu et al. (2003) is typical for spiral galaxies (Condon 1992). We assume therefore that, as on average found for spiral galaxies, synchrotron radiation is responsible for 90% of the emission at 1.4 GHz (Condon 1992). With this assumption, we can apply eq. (18) of Condon (1992) to derive a SFR of 0.6 M⊙yr-1, assuming a Salpeter IMF.
The SFRs in SQ B derived from the extinction-free tracers (dust emission and radio continuum) agree surprisingly well and indicate levels of SF in SQ B of about 0.5 M⊙yr-1. The same values are derived from the H after applying the extinction correction derived from the gas surface density, suggesting that this value is correct. This SFR is very high for an extragalactic object, much higher than the values observed in other TDGs, most of them of comparable or larger dynamical mass (Braine et al. 2001).
Based on the above values of the SFR we can derive the gas consumption time, defined as the molecular gas mass divided by the SFR (i.e. the inverse of the star formation efficiency). In SQ B, the (extinction-free) SFR of 0.5 M⊙yr-1 and the molecular gas mass of M⊙(from the PdBI observations), yield a gas consumption time of 0.5 Gyr. In SQ tip, applying the extinction derived from the gas column density results to a SFR of 0.073 M⊙yr-1 and with M⊙ the corresponding gas consumption time is 1.1 Gyr. This estimate though is rather uncertain given our limited knowledge of the extinction of the H flux and of the molecular gas conversion factor. Our measurment lies within the range of gas consumption times found for spiral galaxies, the average being 0.6 Gyr (adjusted to our value of the conversion factor) with a dispersion of a factor 3 (Kennicutt 1998). This result is still valid even if, as discussed in Section 4.2, our conversion factor overestimates the molecular gas content in SQ B. However, in this case the gas consumption time would be more similar to the values of 0.25 Gyr with a dispersion of a factor of 2.5 derived for starburst galaxies by Kennicutt (1998). It is unlikely that the conversion factor is higher than the Galactic value due to the solar metallicity observed in SQ B.
4 Discussion
4.1 Association with the optical tidal tail of NGC 7319
On the basis of our observations we may be able to answer the question: is the north-eastern HI cloud (called Arc-N in Williams et al. 2002) physically associated with the optical tidal tail or not? This HI cloud overlaps at its southern end with the optical tidal tail, but it has been unclear whether this is simply a projection effect. The enormous size of this cloud makes it distinctly different from what is observed in tidal tails in other interacting systems. So far, the only argument in favor of a physical relation is the sharp inner edge of the gas cloud coinciding in position and shape with the stellar optical tail (Sulentic et al. 2001).
Our CO observations have shown that there is very good spatial and kinematical agreement between the CO and H at both SQ B and SQ tip. Furthermore, the line velocities and shapes of CO and HI match very well. From these results we conclude that the recent SF traced by the H is indeed fed by the molecular gas observed in CO and both are physically related to the atomic gas. Strictly speaking, this does not prove that these components are related to the older stars seen in the optical tidal arm. In principle, the optical tail could be a background object to the atomic, molecular and ionized gas, including the recent SF that it contains.
The main argument against such a projection effect is the fact that the spatial coincidence between the blue stellar knots in the optical tail at SQ B and SQ tip and the H emission occurs at two positions in the tidal tail. It is unlikely that this is due to a coincidence and we conclude that the H emission most likely has its origin within the optical tail. Since our observations establish a physical relation between the neutral and ionized gas, also the HI and molecular gas must therefore be related to the optical tail.
These results allow us to draw a further conclusion. The optical tidal tail stems from NGC 7319, which points at this galaxy as its progenitor. Since the gas and the optical tail are related, their origin is expected to be the same which suggests that the gas also comes from NGC 7319. The solar metallicity observed in SQ B furthermore indicates that the gas comes from relatively inner regions of this galaxy since an enrichment by recent SF is not sufficient to explain these values (see Braine et al. 2001).
4.2 Physical conditions of the molecular gas
The high 12CO/13CO line ratio derived both for the (1–0) and the (2–1) line is similar to the values found in starburst galaxies (Aalto et al. 1995), including their extreme forms of infrared luminous (LIRGs) and ultraluminous (ULIRGs) galaxies (Solomon et al. 1997). In starburst and (U)LIRGs the 12CO emission is believed to originate not from dense, self-gravitating molecular clouds, but instead from a moderately dense inter-cloud medium with a relatively low opacity (Aalto et al. 1995, Solomon et al. 1997). Dense molecular gas also exists in great abundance as shown by the strength of the line emission of dense gas tracers such as HCN (Gao & Solomon 2004). Thus, these observations point to a two component interstellar medium (ISM): dense clouds where molecules as HCN emit and a diffuse intercloud medium which is, in contrast to normal galaxies, dense enough for the gas to be molecular. As a result of this moderate density, the molecular gas masses derived from the CO emission using a Galactic conversion factor are a factor of 3–5 too high (Braine & Dumke 1998, Downes & Solomon 1998).
An alternative explanation for the high 12CO/13CO line ratio is a different abundance of the 13C isotope in starbursting galaxies (Casoli et al. 1992). These authors have proposed two possible processes that might be responsible for the underabundance of 13C: (i) the selective production of 12C in the young stars formed during the starburst and (ii) the inflow of low-metallicity gas with a high 12C/13C ratio from the outer regions into the central regions where the starburst takes place. In SQ B however, we know that the gas fueling the SF has a high metallicity and does therefore not originate from the outer regions of the parent galaxy so that process (ii) cannot be at work here. The increase in the 12C/13C abundance ratio due to process (i) depends very much on the adopted parameters (see the arguments in Sect. 5.2 of Casoli et al. 1992). Adopting a realistic value for the gas mass fraction converted into stars (20%) and assuming that the IMF is not biased towards massive stars, we derive an increase in 12C/13C of not more than 10%. Only in the case of an IMF strongly biased towards massive stars could this process account for the observed high 12CO/13CO line ratio in SQ B.
In the case of SQ B it seems therefore that a low density/opacity of the ISM is the most likely explanation for the low 13CO/12CO line ratio. As a consequence it is possible that the Galactic conversion overestimates the molecular gas masses. A comparison between SQ B and starburst galaxies is not unreasonable, since the SF activity in SQ B is indeed high, as indicated by the high equivalent width of the H line of Å. More line observations, in particular high-density tracers as HCN, will be necessary to better understand the properties of the molecular gas in SQ B.
Interestingly, a high 12CO/13CO has also been found in a very different type of object, in the bridge of the interacting system Taffy galaxies (Braine et al. 2003). Here, the CO/HCN ratio is very low, in contrast to starburst and (U)LIRGs. At the same time only very little SF is found.
5 Summary and conclusions
We have presented our analysis of new high resolution () CO observations of the eastern tidal tail in SQ obtained with the interferometer at Plateau de Bure (PdBI), as well as optical spectroscopy of the two star forming (SF) regions in the zone, SQ B and SQ tip, along with observations of the 13CO line with the IRAM 30m telescope. The main results derived from our observations are:
(i) We have identified two main CO emitting regions, associated with regions of SF in the optical tail at SQ B and at the tip of the tidal tail, SQ tip. Our PdBI maps trace about half of the total CO emission derived from single dish 30m IRAM observations (Lisenfeld et al. 2002). This indicates that about half of the molecular gas is distributed on scales larger than 10–15″ for which PdBI is not sensitive. The spatial extent of this latter component is very large, covering an area of about kpc (see Lisenfeld et al. 2002).
(ii) In both regions the CO coincides exactly with H emission. In SQ B there is furthermore perfect kinematical agreement with the H line. In addition, the line shapes and velocities of CO and of HI spectra (Williams et al. 2002) are identical. These agreements suggest that the recent SF and molecular and neutral gas are related. H and CO emission coincide with the blue star clusters visible in the optical tidal tail. Since this coincidence occurs at two different positions, it seems unlikely that it is a projection and we conclude that a physical relation to the optical tail exists. This relation suggests that the origin of the gas is NGC 7319, the galaxy from where the optical tail stems.
(iii) We tentatively detected 13CO(2–1) in SQ B and obtained an upper limit for 13CO(1–0). The 13CO observations yield high values for the 12CO/13CO ratio of , both for the 1–0 and for the 2–1 line, higher than those found in disks of spiral galaxies and comparable to those found in starburst galaxies. A low opacity of the 12CO emitting gas is the most plausible explanation for this result, however more molecular line observations are necessary in order to draw firm conclusions.
(iv) Optical spectroscopy in SQ B and SQ tip revealed several knots of H emission. Unlike other TDGs, the metallicity of SQ B is roughly solar and the extinction derived from the optical spectra is high (AV = 3.0). This indicates that the gas at SQ B has its origin in relatively inner regions of the disk of the parent galaxy.
(v) From the extinction-corrected H emission and from extinction free SF tracers (dust emission and radio continuum) we derive a SFR of SQ B as high as 0.5 M⊙/yr. The resulting gas consumption time of 0.5 Gyr is in the range found for spiral and starburst galaxies by Kennicutt (1998).
Acknowledgements.
We would like to thank J. Iglesias-Páramo, J. Vílchez and C.K. Xu for making available their H data to us, L. Verdes-Montenegro for the HI data, J. Sulentic for helpful discussions, and the referee, Alessandro Boselli, for useful comments on the manuscript. UL and SL are supported by the Spanish MCyT Grant AYA 2002-03338 and by the Junta de Andalucía. VC would like to acknowledge the partial support of NASA through contract number 1257184 issued by JPL/Caltech and EB acknowledges financial support from CONACyT via project 27607-E.References
- Aalto et al. (1995) Aalto, S., Booth, R.S., Black, J.H., Johansson, L.B., 1995, A&A, 300, 369
- Allende Prieto et al. (2001) Allende Prieto, C., Lambert, D.L., Asplund, M., 2001, ApJ, 556, L63
- Braine & Dumke (1998) Braine, J., Dumke, M., 1998, A&A, 333, 38
- Braine et al. (2001) Braine, J., Duc, P.-A., Lisenfeld, U., Charmandaris, V., Vallejo, O., Leon, S., Brinks, E., 2001, A&A, 378, 51
- Braine et al. (2003) Braine, J., Davoust, E., Zhu, M., Lisenfeld, U., Motch, C., Seaquist, E. R., 2003, A&A, 408, L13
- Condon (1992) Condon, J.J., 1992, ARA&A, 30, 575
- Casoli et al. (1992) Casoli, F., Dupraz, C., Combes, F., 1992, A&A, 264, 55
- Downes & Solomon (1998) Downes, D., Solomon, P. M., 1998, ApJ, 507, 615
- Draine (2003) Draine, B.T., 2003, ARA&A, 41, 241
- Duc et al. (2004) Duc, P.-A., Bournaud, F., Masset, F., 2004, in: IAU Symposium 217, Recycling intergalactic and interstellar matter, eds. P.-A. Duc, J. B., Brinks, E., ASP, in press (astro–ph/0402252)
- Gallagher et al. (2001) Gallagher, S.C., Charlton, J.S., Hunsberger, S.D., Zaritsky, D., Withmore, B.C., 2001, AJ, 122, 163
- Gao & Solomon (2004) Gao, Y., Solomon, P.M., 2004, ApJ, 606, 271
- Iglesias-Páramo & Vílchez (2001) Iglesias-Páramo, J., Vílchez, P., 2001, ApJ, 550, 204
- Kennicutt (1998) Kennicutt, R.C., 1998, ApJ, 498, 541
- Lisenfeld et al. (2002) Lisenfeld, U., Braine, J., Duc, P.A., Leon, S., Charmandaris, V., Brinks, E., 2002, A&A, 394, 823
- Mendes de Oliveira et al. (2004) Mendes de Oliveira, C., Cypriano, E.S., Sodré, L., Jr., Balkowski, C., 2004, ApJ, 605, L17
- Moles et al. (1997) Moles, M., Sulentic. J.W., Márquez, I., 1997, ApJ, 485, L69
- Osterbrock (1989) Osterbrock, D.E., 1989, Astrophysics of gaseous nebulae and active galactic nuclei, Oxford University Press, Oxford
- Rohlfs & Wilson (2003) Rohlfs, K., Wilson, T.L., Tools of Radioastronomy, Springer-Verlag, Heidelberg
- Roussel et al. (2001) Roussel, H., Sauvage, M., Vigroux, L., Bosma, A., 2001, A&A, 372, 427
- Paglioni et al. (2001) Paglioni, T.A.D., Wall, W.F., Young, J.S., Heyer, M.S., Richard, M., Goldstein, M., Kaufman, Z., Nantais, J., Perry. G., 2001, ApJS, 135, 183
- Solomon et al. (1997) Solomon, P.M., Downes, D., Radford, S.J.E., Barrett, J.W., 1997, ApJ, 478, 144
- Sulentic et al. (2001) Sulentic, J. W., Rosado, M., Dultzin-Hacyan, D., Verdes-Montenegro, L., Trinchieri, G., Xu, C., Pietsch, W., 2001, AJ, 122, 2993
- van Zee et al. (1998) van Zee, L., Salzer, J. J., Haynes, M. P., O’Donoghue, A. A., & Balonek, T. J. 1998, AJ, 116, 2805
- Williams et al. (2002) Williams, B.A., Yun, M.S., Verdes-Montenegro, L., van Gorkom, J.H., 2002, AJ, 123, 2417
- Xu et al. (1999) Xu, C., Sulentic, J.W., Tuffs, R., 1999, ApJ, 512, 178
- Xu et al. (2003) Xu, C., Condon, J.J., Dopita, M., Tuffs, R., 2003, ApJ, 595, 665