Further author information:
S.R.M.: E-mail: stephan@pha.jhu.edu, Telephone: 1 410 516 5272
FORTIS: Pathfinder to the Lyman Continuum
Abstract
Shull et al.[4] have asserted that the contribution of stars, relative to quasars, to the metagalactic background radiation that ionizes most of the baryons in the universe remains almost completely unknown at all epochs. The potential to directly quantify this contribution at low redshift has recently become possible with the identification by GALEX of large numbers of sparsely distributed faint ultraviolet galaxies. Neither STIS nor FUSE nor GALEX have the ability to efficiently survey these sparse fields and directly measure the Lyman continuum radiation that may leak into the low redshift (z 0.4) intergalactic medium. We present here a design for a new type of far ultraviolet spectrograph, one that is more sensitive, covers wider fields, and can provide spectra and images of a large number of objects simultaneously, called the Far-ultraviolet Off Rowland-circle Telescope for Imaging and Spectroscopy (FORTIS). We intend to use a sounding rocket flight to validate the new instrument with a simple long-slit observation of the starburst populations in the galaxy M83. If however, the long-slit were replaced with microshutter array, this design could isolate the chains of blue galaxies found by GALEX over an 30’ diameter field-of-view and directly address the Lyman continuum problem in a long duration orbital mission. Thus, our development of the sounding rocket instrument is a pathfinder to a new wide field spectroscopic technology for enabling the potential discovery of the long hypothesized but elusive Lyman continuum radiation that is thought to leak from low redshift galaxies and contribute to the ionization of the universe.
keywords:
Ultraviolet instruments, wide-field spectroscopy, ultraviolet:galaxies, diffuse radiation1 INTRODUCTION
The Galaxy Evolution Explorer (GALEX) has recently acquired some very exciting ultraviolet imagery. These broad band images, centered on 1516 Å and 2267 Å, locate the brightest ultraviolet objects in the sky. The starburst regions in nearby grand design spirals are revealed to be immediately adjacent to clumpy dust lanes seen in optical images. A large number of faint blue galaxies with angular separations few arcminutes are in the process of being cataloged. Questions concerning the dust and molecular content, chemical enrichment, mass loss rates, supernovae rates, star formation histories, and the escape fraction of ionizing radiation from the underlying stellar populations naturally arise. This last question is of particular importance to the question of the how the universe came to be ionized.
We propose to build an instrument capable of searching directly for the escaping fraction of ionizing radiation from star-forming galaxies below their rest frame Lyman edge at 911.7 Å and assess their contribution to the metagalactic ionizing radiation field. These observations require wide-field far ultraviolet spectroscopy at moderate resolving power ( 1500), emphasizing the wavelength region below Ly.
Neither GALEX nor the Space Telescope Imaging Spectrograph (STIS) on board HST, nor the Far Ultraviolet Spectroscopic Explorer FUSE have the ability to carry out an efficient spectroscopic survey of these widely separated faint blue galaxy fields below Ly. GALEX has only rudimentary slitless spectroscopic capability. Its low spectral resolving power ( 200), spatial resolution ( 5′′) and bandpass restricted to 1350 Å, cannot provide the spectroscopic detail from which kinematic, chemical, thermal, and density diagnostics can be derived. STIS has demonstrated the multiplexing power of long-slit spectroscopy[1, 2], but it too is limited to wavelengths 1150 Å. And while the primary mission of FUSE is high resolution spectroscopy below 1190 Å, its fast optics and the high resolving power produces large astigmatic images that are unsuitable for imaging spectroscopy. Further, the high resolving power makes it extremely difficult to observe objects fainter than 10.
[1,r,
![[Uncaptioned image]](/html/astro-ph/0407464/assets/x1.png) ,
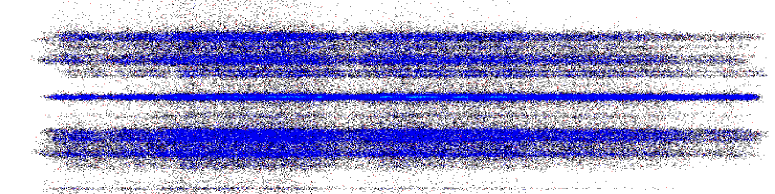
GALEX FUV image of M83 with 600′′ 60′′ slit overlay. The summed flux within the slit projected on the long axis is shown on the right. The flux scale on the abscissa is logarithmic. ]
,
GALEX FUV image of M83 with 600′′ 60′′ slit overlay. The summed flux within the slit projected on the long axis is shown on the right. The flux scale on the abscissa is logarithmic. ]
What is needed is a new approach to far ultraviolet spectroscopy, one that is more sensitive, covers wider fields, and can observe a number of objects simultaneously. We present here the design of a highly efficient wide field spectro/telescope based on a Gregorian telescope with a ruled secondary, which we call the Far-ultraviolet Off Rowland-circle Telescopy for Imaging and Spectroscopy (FORTIS).
2 Science Drivers and Development Plan
It is widely thought that the ionizing background that permeates metagalactic space is produced by quasars and star-forming galaxies.[3, 4, 5] Our ultimate motivation is to address the assertion[4] that the contribution of stars (relative to quasars) to the metagalactic ionizing background remains almost completely unknown at all epochs. The problem is to determine the average fraction of ionizing photons produced by O and B stars that escape from galaxies into the intergalactic medium (IGM). This objective will require a long duration observing program.
Our approach to this problem will be to use the sounding rocket program to validate an advanced spectroscopic instrument through a short duration observation with a focused science objective. This will in turn enable the rapid development of a mission concept and associated technology that lie outside the capabilities of existing orbiting observatories.
Our short duration observation will be of the nearby grand design starburst galaxy M83. We will focus on measuring the far ultraviolet spectral energy distributions of its three different classes of hot star populations to probe the physics of star formation. We will demonstrate that this is a straightforward, albeit technically challenging, observation for a 400 second sounding rocket flight, by using the GALEX observation of M83 as our guide. The science requirements for the M83 observation will be used to derive the instrument requirements for FORTIS.
Our long duration objective is to assess the galactic contribution to the metagalactic ionizing radiation field by searching directly for the ionizing radiation escaping from low redshift star-forming galaxies below the rest frame Lyman edge at 911.7 Å. Heckman[5] have pointed out that the modest sensitivity of far ultraviolet telescopes to date (primarily HUT and FUSE) has limited the investigations to small and possibly unrepresentative galaxy samples. Deharveng[6] have argued that a quantitative assessment of the contribution of galaxies to the ionizing background will require a large number of observations before a Lyman continuum luminosity function can be established. Part of the problem, finding enough faint ultraviolet galaxies, has just been solved by GALEX, which is in the process of cataloging large flux-limited samples of ultraviolet bright galaxies. A preliminary assay of the number of galaxies with Sloan spectral identifications and redshifts z 0.25 in the FUV channel with 22 (fluxes 7.6 ) finds 133 per square degree (Tamas Budavari, private communication). We will show an instrument derived from FORTIS will have the sensitivity to directly search for Lyman continuum radiation escaping from a significant number of these galaxies. By replacing the long-slit of the new spectrograph with a microshutter array[7], a unique and powerful multi-object spectrograph is generated with the capability of recording far ultraviolet spectra from large numbers of the widely separated very blue galaxies.
Through our pathfinding M83 observation we will develop the core technology required to search for the long hypothesized but elusive Lyman continuum emission from low redshift galaxies. This will allow the important science question concerning the contribution of stars to the metagalactic ionizing background to be quantified in a long duration mission. M83 is a well studied grand design spiral galaxy with an extremely bright starburst core. The GALEX FUV image is shown in Figure 1. Surrounding the core are many bright blue starburst clusters that trace the spiral arms. The clusters are coincident with H 2 regions and are located in proximity to complexes of dust and CO emission[8]. Also apparent in this image is a diffuse blue stellar component. This diffuse stellar component has been noted in other starburst galaxies.[9] It fills the space between the bright clusters and the spiral dust lanes and, despite the low surface brightness, can contribute the dominant part of the total ultraviolet luminosity of a typical starburst galaxy[10]. This emission is not just dust scattered emission because in HST observations of nearby starburst galaxies the stars are resolved.
The primary instrument requirement for observing M83 is to detect and spatially distinguish the three types of stellar populations within the 400 seconds of on target time available to a sounding rocket flight. The HUT spectrum of the M83 core shows that the continuum flux at 1100 Å is quite similar to that at 1500 Å (3 10). We use this observation along with the GALEX flux calibrated FUV image of M83 at = 1516 Å to simulate the emission of the various populations within each (1.5′′)2 square pixel, under the assumption that each pixel emits the same basic spectrum as the starburst core. We include in the simulation a decreased dust attenuation with increasing distance from the core.
A slit 600′′ long will sample the entire diameter of M83. We set the width to 60′′ to increase the number of compact clusters in the field of view and to obtain good signal strength on the field population. The total mean flux at 1516 Å in the region subtended by this slit in the GALEX FUV image at a position angle of (–48∘ from north) centered on the starburst core is 7.5 10. On the right side of Figure 1 a profile of the flux along the long dimension of the slit created by integrating over the short dimension is displayed. There are 10 clusters some of which are at the resolution limit of GALEX 5′′. Some of these clusters will undoubtedly fragment when viewed at higher spatial resolution and may reach the pointing accuracy limit of a typical sounding rocket 1′′.
We produce the simulated spectra with 2 Å (1 Å bins), which is about a factor of 3 lower than our design goal. The simulation of the long-slit spectrum is shown in Figure 1. We used the effective area curve, discussed below, to convert the fluxes into total counts for an integration time of 400 seconds. The count per bin arrival statistics have been simulated by adding or subtracting the square root of the counts per bin multiplied by a random number drawn from a normalized Gaussian distribution. The expected count rate is 700 Hz.
FORTIS will be designed to have two pixel sampling at 1′′. The baseline plate scale is 33′′ mm-1 and the inverse dispersion of the spectrograph is 20 Å mm-1, so the conversion between wavelength and angle is 0.61 Å (′′)-1. The 1′′ spatial resolution goal translates into a spectral resolution at 1000 Å of = 1650, becoming somewhat higher at the longer wavelengths. Our spectral resolution design goal is 1500, which will allow molecular hydrogen content to be explored down to a level of 1015 cm-2 provided there is adequate signal to noise. In practice this will be degraded by the finite extent of various stellar populations. We may achieve the limiting spectral resolution on some of the tightest clusters. The field populations are spread fairly uniformly between the clusters and will fill the slit yielding a slit limited spectral resolution of 30 at 1000Å. Nevertheless, even at this low resolution, the integrated flux of the field population and any change in spectral slope can be determined.
The spectral bandpass for the instrument will span 900 – 1600 Å in order to provide a baseline to determine the spectral slope at 1500 Å to compare to the slope at 1100 Å. We will test whether the ratio of these two slopes is as good a starburst age indicator as the ratio of the C 4 1548 – 1550 and Si 4 1394 – 1403 wind lines[11].
3 Far Ultraviolet Spectroscopic Design Evolution
The compelling new challenges to far ultraviolet science investigations emerging from the GALEX surveys provide impetus to developing an instrument for acquiring spectra on a statistically significant number of very faint widely separated objects. This is an especially difficult challenge in the far ultraviolet where the sources we wish to detect are weak ( 10), geocoronal Ly is strong ( 3 kRayleighs), and the efficiencies of the mirrors (reaching the Lyman limit) and detectors are low ( 30 – 40%).
Spectroscopic design in the far ultraviolet below Ly demands a minimalist approach. The “two-bounce” prime focus designs of the HUT, OREFUS and FUSE observatories used relatively fast parabolic primary mirrors feeding the slit of a Rowland circle spectrograph.111In a Rowland circle spectrograph all the rays at wavelengths satisfying the grating equation entering a slit placed on a circle, with diameter is equal to the radius of the concave grating, are diffracted to a tangential focus on the same circle. Although these two-bounce designs satisfy the requirement for efficiency they have poor off-axis spectral imaging performance. This is because fast focal ratios tend to increase the height of the astigmatic image, limiting the spatial resolution perpendicular to the dispersion. Astigmatism control is a major challenge in Rowland circle spectrographs and methods have been developed to eliminate it at select wavelengths, either by controlling the grating figure[12] or with holographic ruling methods[13]. However, away from the corrected wavelengths astimgatism always grows and it grows slower when the focal length is long.
Long-slit spectroscopy in the far ultraviolet typically sacrifices efficiency for off-axis image quality. Such designs use “three-bounce” systems consisting of a Cassegrain telescope feeding a Rowland circle spectrograph. The long effective focal length produces lower astigmatism, and can be used with long-slits out to several arcminutes off-axis. Unfortunately, the efficiency sacrifice is high. The third reflection drops the system effective area by a factor of 2.5 to 3, when SiC coated mirrors, which have (30 – 40 %) efficiency are used. The low efficiency has caused us to develop a dual-order spectrograph that largely recovers the efficiency lost with the extra bounce.[18]
Noda[13] first wrote out in detail the general aberration theory for holographic gratings, and since then techniques to minimize spectroscopic aberrations have become increasingly sophisticated. They reached a new level when solutions were found that made it possible to control not only astigmatism but coma at the high ruling densities required for the FUSE mission [14]. The high resolution holographic gratings recorded for the Cosmic Origins Spectrograph (COS – slated to have been flown on the now canceled servicing mission 4 to HST) removed the spherical aberration with an aspherical grating figure along with a FUSE like aberration minimization solution[15]. Recently developed numerically optimized solutions for two-bounce systems achieve excellent narrow band spectroscopic imaging with the grating used off the Rowland circle[16]. An off-axis parabola design [17] has a high enough spectral resolving power to cleanly separate the O 6 1032 – 1037 doublet over a 0.5∘ field of view and yield 4 – 9 ′′ of spatial resolution.
Our design evolves further with a very simple symmetric recording geometry for producing a on-axis, normal-incidence dual-order spectrograph, appropriate for moderate dispersion wide-field spectral imaging at 1 – 4′′ resolution. Like all dual order designs[18] it uses a toric like grating surface to correct for astigmatism in both positive and negative orders. Higher order aberrations are corrected holographically. There is a zero order field for imaging on the optic axis and 2 first order spectral fields dispersed with mirror symmetry to either side of the optic axis. These fields are nearly contained within the central obscuration produced by the secondary mirror/grating, in contrast to the off-axis parabola design of Cunningham[17]. We have effectively a hybrid spectro/telescope that provides simultaneous imaging and spectroscopy. We call our design the Far-ultraviolet Off Rowland-circle Telescope for Imaging and Spectroscopy (FORTIS).
4 FORTIS Configuration
| Parameter | FORTIS Sounding Rocket | FORTIS Long Duration |
|---|---|---|
| Secondary Focus Plate Scale | mm-1 | mm-1 |
| Primary Focus Plate Scale | mm-1 | mm-1 |
| Primary Focal Ratio | f/2 | f/2 |
| System Focal Ratio | f/12 | f/6.95 |
| Secondary Vertex to Focal Plane | 1488 cm | 2880 cm |
| Inverse Dispersion | 20 Å mm-1 | 20 Å mm-1 |
| Field of View | 600′′ 60′′ | 1800′′ 1800′′ |
| Clear Area | 1600 cm2 | 5000 cm2 |
| Primary Diameter | 500 mm | 900 mm |
| Secondary Diameter | 120 mm | 400 mm |
| Bandpass | 900 – 1600 Å | 900 – 1300 Å |
| Spectral Resolution | 1500 | 3000 |
| Spatial Resolution Perpendicular to Dispersion | 1 – 4′′ | 0.5 – 2′′ |
| Detector Pixel | 0.015 m | 0.0075 m |
| Approximate Detector Format (1order) | 20 mm 40 mm | 60mm 75mm |
| Effective Area Peak | 50 cm2 | 156 cm2 |
Here we review the baseline instrument design, covering the general optical path, efficiencies, detectors, baffling, raytrace and sensitivity. The spectro/telescope configuration parameters are summarized in Table 1.
Optical Layout
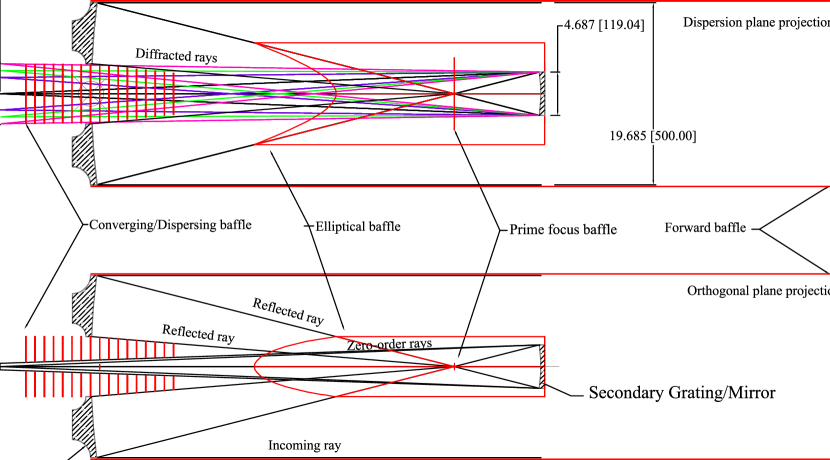
The telescope optical path is shown in Figure 2 in two orthogonal views. Light from an distance enters the telescope from the right and reflects off the primary mirror converging to form an image at the prime focus. From the prime focus the light diverges to fill a secondary grating. The plane view (top of Figure 2) shows how the light is reflected into zero order and diffracted into the positive and negative first orders of the grating. The reflected and diffracted light comes to a secondary focus located behind the primary mirror.
The grating acts as a dichroic beam splitter. The relative spectral bandpasses of the imaging and spectral regions are determined by a combination of the groove efficiency and the reflectivity of the grating. A laminar shaped groove has an first order efficiency peak of 41% at a wavelength peak of , where is the groove depth [19]. The imaging efficiency is zero at the 1st order peak wavelength and rises monotonically redward as the first order efficiency falls (Figure 4). Although it is possible to develop sophisticated filter or even spectroscopic options to analyze the zero order light more fully, such options go beyond the scope of this project.
The primary mirror and secondary grating will be coated with ion beam sputtered SiC with Al undercoating to keep the zero order reflectivity high [20]. The diameter of the primary will be 500 mm, which is set by the inner diameter of the largest sounding rocket skin that the NASA sounding rocket program provides. We use an f/2 focal ratio for the primary, because slower beams require larger gratings, while faster beams cause the image quality to suffer. We will construct a new optical bench for holding the primary, field stops, secondary, baffles and the (standard issue NASA provided) wide field star-tracker to common optical axes. The optical bench will consist of an invar tube cantilevered off of a primary mirror baseplate. The invar tube also serves as a heat shield.
Baffles and Spectrograph Entrance Aperture
Although it is possible to produce this type of instrument in a Cassegrain configuration, with a convex optic in front of the prime focus, a Gregorian configuration, with a concave optic behind the prime focus, has a distinct advantage. It allows the inclusion of a field stop at the focus of the primary mirror to limit the field of view passed to the grating and avoids the image confusion in the spectral focal plane that would result from a slitless Cassegrain design. Most importantly it limits the solid angle for the geocoronal emission lines.
The stop consists of a thin baffle with an aperture the width and height of the 600′′ 60 ′′ slit. The height of the baffle can be made very small, because the prime focus plate scale is de-magnified with respect to the secondary plate scale. We match the slit height to the detector height, so dispersed light from the grating that comes from the region above or below the the slit does not enter the detector. The mismatch between the beam angles going to the grating and departing the grating for the secondary focal plane allows nearly all the light reflected or diffracted from the secondary to pass by the baffle with minimal obscuration.
Additional baffles are required to prevent the detectors from seeing blank sky. We have determined that the combination of a long tube the diameter of the primary, an elliptically shaped central obscuration extended to meet the converging beam from the primary and a series of slotted plates in front and behind the primary are sufficent to elliminate blank sky from the detector (see Figure 2).
For the M83 observation a long-slit, will be etched in the prime focus baffle plate. For a Lyman continuum mission a microshutter array will be integrated into the prime focus baffle plate. The array is a grid of apertures that can be either opened to let light pass or shut to block light. A cyrogenic version is currently in the development stage for the near-infrared spectrograph (NIRSpec) on the James Webb Space Telescope (JWST) [21]. Typical dimension of the individual apertures in these arrays are (0.1 mm)2 [7], yielding an angular dimension of (20′′)2 in the focal plane of the primary.
Secondary Grating Figure and Recording Parameters
The strong geocoronal Ly emission makes it important to use low scatter optics. Holographic gratings are the dispersion element of choice in this bandpass as they are generally recognized to have 10 times lower scattered light than conventionally ruled blazed gratings [22, 23]. The holographic etching process tends to produce a groove with a symmetric profile, the consequence of which is to yield equal power in both positive and negative orders [19]. We have chosen to exploit this well documented property and increase our sensitivity by a factor of 2 through the use of two redundant detectors rather than experiment with blazing the groove of a holographic grating, as we have experienced less than satisfactory results in the past.
A holographic grating is made by recording on a surface the interference pattern of two coherent laser point sources placed at (, , ) and (, , ), as expressed in cylindrical coordinates with respect to an origin at the grating normal. We have found a holographic recording solution for a normal incidence, ( = 0∘) off Rowland circle grating that is particularly simple, = , , and = 0, where is the distance from the secondary vertex to the focal plane. This solution works because, = 0∘, the diffraction angles are small, and the S is long.
One drawback of the dual order design is that the figure of the grating is required to have a different radius in the direction perpendicular to the dispersion to allow astigmatism to be corrected in both orders. [18] This is accomplished with a rather modest reduction of the grating curvature in the plane perpendicular to the dispersion following the prescription given by [12]. We will perform a trade study to analyze whether this is the most practical configuration in terms of the extra expense of making a grating with a non-cylindically symmetric figure and the extra detector area required to cover both the spectral orders and the imaging order.
5 FORTIS Expected Performance
Raytrace
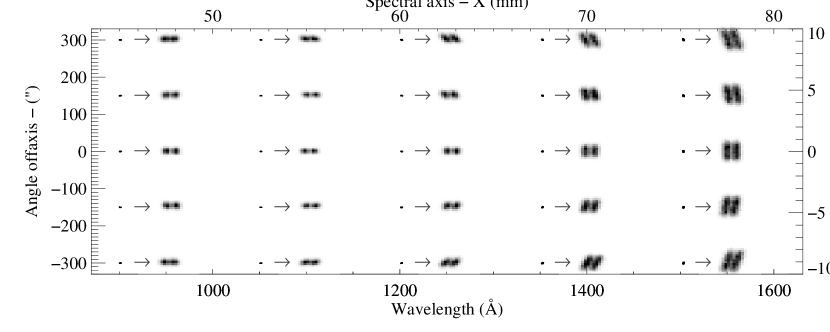
We have raytraced the design using the prescription given in Table 1. The telescope primary and secondary figures (before astigmatism correction) are those appropriate to an aplanatic Gregorian [24]. The input to the raytrace is a 5 5 array of Gaussian spots spanning 300′′and a wavelength range of 900 – 1500 Å. The spatial width of each Gaussian spot is 1′′ full width half maximum (FWHM). The spots come in wavelength pairs separated by 1 Å. Ray bundles are generated from the spots and the resulting distortions caused by the mirror surfaces and grating grooves as the rays traverse the optical system are shown in Figure 3. The degree of distortion depends on slit position and wavelength and have mirror symmetry in first order. The spectral focal plane is convex as is expected from an aplanatic Gregorian.
The insets in Figure 3 are the spots magnified by 10 and sampled with (0.015 mm)2 bins. On-axis (0′′) near the astigmatism corrected wavelength of 1100 Å there is very little distortion. At longer wavelengths astigmatism increases but the spectral resolution is maintained. The spatial resolution on-axis degrades at the longest wavelengths to 4′′. Off-axis there is some rotation in the spot pairs, which can be corrected with an appropriate distortion map. All spots show clean separation at 1 Å indicating the spectral resolution exceeds this level at all wavelengths. We find the Rayleigh resolution criteria is met in a projection of the on-axis point at 1050 Å with a wavelength separation of 0.7 Å yielding a spectral resolution of 1500.
The zero order spots (not shown) exhibit a 4.6′′ FWMH astigmatism as expected from using a toric like secondary surface figure. The width is 1′′ FWHM. In the first year we will explore options to correct this image distortion by applying power to the calcium fluoride window in front of the imaging detector.


Effective Area
We calculate the effective with
where is the clear area of the telescope, and are the reflectivities of the primary mirror and secondary grating, is the groove efficiency of the grating, is the quantum efficiency of the detector, and is the transmission of the ion repeller grids. Our component efficiencies are taken from [25], which we have found to be in good agreement with the of our current instrument.[18] The componet efficiencies are shown on the left in Figure 4. On the right of this figure we show the FORTIS effective area along with that for FUSE [26], and HUT [27].
Flux Detection Limits
The ability to detect a faint source is limited by the detector background equivalent flux (BEF). This is the signal that lies underneath all spectra that are extracted from the detector. The BEF present in the spectral region of a point source changes as a function of wavelength due to variations in the astigmatism height, the effective area, and scattered light profile from geocoronal lines, mostly Ly.
We estimate the BEF in ergs cm-2 s-1 Å-1 from
where is the astigmatism height variation with wavelength for our DOS, the FUSE, and HUT spectrographs, is the background rate, and is the dispersion, which is 40, 20, and 1 Å mm-1 for HUT, FORTIS, and FUSE respectively. The total background rate is a sum of the on-orbit dark rate, typically 1 Hz from radiation-induced background and intrinsic detector dark counts, and the contribution of geocoronal Ly scattered from the grating. We estimate the wavelength variation of 3 kRayleighs of Ly airglow from a 60′′ slit width using laboratory measurements of a scatter profile from a typical holographic grating. Ly is also included at the level of 15 Rayleighs. The result is shown on the left of Figure 5. We also show an estimate for a FORTIS long duration instrument with a 20′′ slit width expected from a microshutter array.


The expected flux limits yielding a signal-to-noise per 10 Å bin of 3 in 400 seconds for FORTIS and 2400 seconds for FORTIS long duration are shown on the right of Figure 5. Overplotted are the HUT spectra of the M83 starburst core and the He 2 Gunn-Peterson object HS 1700+64. FORTIS will be the most sensitive far ultraviolet spectrograph ever assembled.
Acknowledgements.
We would like to thank Erik Wilkinson for useful discussions regarding off Rowland-circle grating techniques. This work is supported through NASA grant NNG04WC03G to JHU.References
- [1] G. Sonneborn, C. S. J. Pun, R. A. Kimble, T. R. Gull, P. Lundqvist, R. McCray, P. Plait, A. Boggess, C. W. Bowers, A. C. Danks, J. Grady, S. R. Heap, S. Kraemer, D. Lindler, J. Loiacono, S. P. Maran, H. W. Moos, and B. E. Woodgate, “Spatially Resolved STIS Spectroscopy of SN 1987A: Evidence for Shock Interaction with Circumstellar Gas,” ApJ 492, pp. L139+, Jan. 1998.
- [2] P. D. Feldman, M. A. McGrath, D. F. Strobel, H. W. Moos, K. D. Retherford, and B. C. Wolven, “HST/STIS Ultraviolet Imaging of Polar Aurora on Ganymede,” ApJ 535, pp. 1085–1090, June 2000.
- [3] P. Madau and J. M. Shull, “Cosmic Metal Production and the Contribution of QSO Absorption Systems to the Ionizing Background,” ApJ 457, pp. 551–+, Feb. 1996.
- [4] J. M. Shull, D. Roberts, M. L. Giroux, S. V. Penton, and M. A. Fardal, “The Metagalactic Ionizing Radiation Field at Low Redshift,” AJ 118, pp. 1450–1460, Oct. 1999.
- [5] T. M. Heckman, K. R. Sembach, G. R. Meurer, C. Leitherer, D. Calzetti, and C. L. Martin, “On the Escape of Ionizing Radiation from Starbursts,” ApJ 558, pp. 56–62, Sept. 2001.
- [6] J.-M. Deharveng, S. Faiesse, B. Milliard, and V. Le Brun, “The Lyman continuum radiation escaping from galaxies.,” A&A 325, pp. 1259–1263, Sept. 1997.
- [7] S. H. Moseley, R. K. Fettig, A. S. Kutyrev, M. J. Li, D. B. Mott, and B. E. Woodgate, “Status of the development of a 128x128 microshutter array,” in Proc. SPIE Vol. 4178, p. 51-58, MOEMS and Miniaturized Systems, M. Edward Motamedi; Rolf Goering; Eds., pp. 51–58, Aug. 2000.
- [8] R. J. Rand, S. D. Lord, and J. L. Higdon, “The Eastern Arm of M83 Revisited: High-Resolution Mapping of ^12CO 1-0 Emission,” ApJ 513, pp. 720–732, Mar. 1999.
- [9] G. R. Meurer, T. M. Heckman, C. Leitherer, A. Kinney, C. Robert, and D. R. Garnett, “Starbursts and Star Clusters in the Ultraviolet,” AJ 110, pp. 2665–+, Dec. 1995.
- [10] C. A. Tremonti, D. Calzetti, C. Leitherer, and T. M. Heckman, “Star Formation in the Field and Clusters of NGC 5253,” ApJ 555, pp. 322–337, July 2001.
- [11] C. Leitherer, D. Schaerer, J. D. Goldader, R. M. G. Delgado, C. Robert, D. F. Kune, D. F. de Mello, D. Devost, and T. M. Heckman, “Starburst99: Synthesis Models for Galaxies with Active Star Formation,” ApJS 123, pp. 3–40, July 1999.
- [12] T. Namioka, “Theory of the ellipsoidal Concave grating. I,” J. Opt. Soc. Am. 51, pp. 4–12, 1961.
- [13] H. Noda, T. Namioka, and M. Seya, “Geometric theory of the grating,” J. Opt. Soc. Am. 64, pp. 1031–1036, 1974.
- [14] R. Grange, “Aberration-reduced holographic spherical gratings for Rowland circle spectrographs,” Appl. Opt. 31, pp. 3744–3749, July 1992.
- [15] J. C. Green, “Cosmic Origins Spectrograph,” in Proc. SPIE Vol. 4498, p. 229-238, UV/EUV and Visible Space Instrumentation for Astronomy and Solar Physics, Oswald H. Siegmund; Silvano Fineschi; Mark A. Gummin; Eds., pp. 229–238, Dec. 2001.
- [16] E. Wilkinson, R. Indebetouw, and M. Beasley, “Technique for Narrow-Band Imaging in the Far Ultraviolet Based on Aberration-Corrected Holographic Gratings,” Appl. Opt. 40, pp. 3244–3255, July 2001.
- [17] N. J. Cunningham and E. Wilkinson, “Holographic telescope design for wide-field imaging of O VI 1032, 1038 Å,” in UV/Optical/IR Space Telescopes: Innovative Technologies and Concepts. Edited by MacEwen, Howard A. Proceedings of the SPIE, Volume 5166, pp. 296-306 (2004)., pp. 296–306, Feb. 2004.
- [18] S. R. McCandliss, K. France, P. D. Feldman, and R. Pelton, “Long-slit imaging dual order spectrograph – LIDOS,” in Proc. SPIE Vol. 4854, p. 385-396, Future EUV/UV and Visible Space Astrophysics Missions and Instrumentation, J. C. Blades; Oswald H. Siegmund; Eds., 4854, pp. 385–396, Feb. 2003.
- [19] S. R. McCandliss, E. B. Burgh, and P. D. Feldman, “Ultraviolet groove efficiency of a holographic grating: implications for a dual-order spectrograph,” Appl. Opt. 40, pp. 2626–2642, June 2001.
- [20] S. R. McCandliss, M. E. Martinez, P. D. Feldman, R. Pelton, R. A. Keski-Kuha, and J. S. Gum, “Design and fabrication of a 40-cm-diameter SiC-coated normal incidence telescope and spectrometer,” in Proc. SPIE Vol. 2011, p. 310-321, Multilayer and Grazing Incidence X-Ray/EUV Optics II, Richard B. Hoover; Arthur B. Walker; Eds., pp. 310–321, Feb. 1994.
- [21] J. Ge, A. S. Kutyrev, B. H. Dean, H. S. Moseley, B. E. Woodgate, and C. Marx, “Optical design of rapid infrared-visible multi-object spectrometer: a NGST demonstration instrument,” in IR Space Telescopes and Instruments. Edited by John C. Mather . Proceedings of the SPIE, Volume 4850, pp. 535-543 (2003)., pp. 535–543, Mar. 2003.
- [22] J. Flamand, F. Bonnemason, A. Thevenon, and J. M. Lerner, “Blazing of holographic gratings using ion-etching,” in Proc. SPIE Vol. 1055, p. 288, Raman Scattering, Luminescence and Spectroscopic Instrumentation in Technology, Fran Adar; James E. Griffiths; Jeremy M. Lerner; Eds., 1055, p. 288, July 1989.
- [23] G. H. Mount and W. G. Fastie, “Comprehensive analysis of gratings for ultraviolet space instrumentation,” Appl. Opt. 17, pp. 3108–3116, Oct. 1978.
- [24] D. J. Schroeder, Astronomical optics, San Diego, CA, Academic Press, Inc, 1987, 1987.
- [25] S. R. McCandliss, E. B. Burgh, and P. D. Feldman, “Flyable windowless calibration lamps for far-UV spectroscopy,” in Proc. SPIE Vol. 4139, p. 70-79, Instrumentation for UV/EUV Astronomy and Solar Missions, Silvano Fineschi; Clarence M. Korendyke; Oswald H. Siegmund; Bruce E. Woodgate; Eds., 4139, pp. 70–79, Dec. 2000.
- [26] D. J. Sahnow, M. A. Gummin, G. A. Gaines, A. W. Fullerton, M. E. Kaiser, and O. H. Siegmund, “On-orbit performance of the double delay line detectors for the Far Ultraviolet Spectroscopic Explorer,” in Proc. SPIE Vol. 4139, p. 149-162, Instrumentation for UV/EUV Astronomy and Solar Missions, Silvano Fineschi; Clarence M. Korendyke; Oswald H. Siegmund; Bruce E. Woodgate; Eds., 4139, pp. 149–162, Dec. 2000.
- [27] J. W. Kruk, S. T. Durrance, G. A. Kriss, A. F. Davidsen, W. P. Blair, B. R. Espey, and D. S. Finley, “Performance and Preliminary Calibration of the Hopkins Ultraviolet Telescope on the Astro-2 Mission,” ApJ 454, pp. L1+, Nov. 1995.