The XMM-Newton view of the broad-line radio galaxy 3C 120
Abstract
We present the results of a 127 ks XMM-Newton observation of the broad-line radio galaxy 3C 120 performed simultaneously with RXTE. The data have yielded the highest quality 0.6–10 keV spectrum of a radio-loud active galaxy ever produced. The time-averaged spectrum is Seyfert-like, with a reflection amplitude , and a neutral Fe K line with equivalent width eV. The line is slightly broadened with a FWHM km s-1. This is consistent with arising from an accretion disc radius of at an inclination angle of degrees, consistent with the limit of degrees derived from the radio jets. At low energies the spectrum requires excess absorption above the Galactic value and a soft excess which is best fit with a bremsstrahlung model (– keV). The total luminosity in the bremsstrahlung component is just under half of the total hard X-ray luminosity. The emission may originate in either the broad line region, or in giant H ii regions adjacent to the nucleus. Weak O vii and O viii edges are detected with high precision, suggesting the presence of a warm absorber component. Broadband 0.6–50 keV fits to the data cannot unambiguously determine the accretion mode in 3C 120. A two-component ionized disc model, with a very highly ionized reflector presumably arising from very close to the black hole, is only a small improvement over a truncated disc model. The strength of the soft X-ray emission features produced by the distant neutral reflector are overpredicted in our solar abundance model, implying that the heavy metal abundance in 3C 120 is subsolar. Both broadband models could also fit a much shorter archival XMM-Newton observation. The total count-rate declined by 20 per cent over the course of the long observation, while small-scale rapid variability was present at the level of a few percent. A possible increase in the Fe K line flux, significant at the 90 per cent level, was identified at ks in the observation. The total unabsorbed luminosity of 3C 120 implies that it is accreting close to its Eddington rate, consistent with a model of a highly ionized thick disc. A possible connection between accretion disc thickness and radio jet production is discussed.
keywords:
galaxies: active – galaxies: individual: 3C 120 – X-rays: galaxies1 Introduction
3C 120 (; Burbidge 1967) is the brightest broad-line radio galaxy (BLRG) in the X-ray sky ( erg cm-2 s-1; Sambruna, Eracleous & Mushotzky 1999). It has been a well known and well studied source at almost every wavelength since the discovery of its optical counterpart (Clarke, Bolton & Shimmins, 1966). While the optical spectrum of 3C 120 is very typical of a Seyfert 1, it resides in an optically peculiar galaxy that shows only some indication of spiral structure (Arp, 1975; Moles et al., 1988). The galaxy has a very random and confused velocity field with only slight evidence of rotation (Baldwin et al., 1980; Moles et al., 1988). Photoionized gas is common in the galaxy, and was interpreted by Baldwin et al. (1980) as resulting from illumination by the nuclear continuum. However, more recent spectra of the nebulosity showed that the gas was at least partially photoionized by a significant episode of star formation in the galaxy (Moles et al., 1988; Soubeyran et al., 1989). This fact, together with the unusual velocity field, has lead to the hypothesis that 3C 120 is in the late stages of a merger (e.g., Heckman et al. 1986; although see comments in Baldwin et al. 1980). The optical continuum of the nucleus is known to be variable (e.g., Wlerick, Westerlund & Garnier, 1979; Webb, 1990), as are the emission lines (Oke, Readhead & Sargent, 1980; French & Miller, 1980; Peterson et al., 1998), thus allowing reverberation mapping to yield a well-constrained black hole mass of M⊙ (Wandel, Peterson & Malkan, 1999).
At radio wavelengths, 3C 120 is core-dominated and exhibits a superluminal jet ranging from sub-pc to nearly 100 kpc scales (Cohen et al., 1977; Seielstad et al., 1979; Walker, Benson & Unwin, 1987; Walker et al., 2001). The superluminal speed results in an upperlimit to the inclination angle of the jet — and, presumably, the accretion disc — to the line of sight of just 14 degrees (Eracleous & Halpern, 1998). Ejections of plasma into the jet may be connected to dips in the X-ray flux (Marscher et al., 2002).
The X-ray emission from the nucleus of 3C 120 has been observed since the beginning of satellite-based X-ray astronomy and was known to be a variable source with a canonical power-law spectral shape that softened as the source brightened (Maraschi et al. (1991) and references therein). A weak correlation between the highest frequency UV emission detected by IUE and the softest X-ray emission from EXOSAT (Maraschi et al., 1991) indicated a Comptonization origin for the X-rays, rather than synchrotron emission from the jet. 3C 120 was not observed by Ginga, so the first detection of Fe K emission was made by ASCA. This 50 ks observation clearly detected an Fe K line, but despite five different analyses of this dataset there has been no consensus on the strength of the line. Workers who modeled the continuum as an absorbed power-law (Reynolds, 1997; Sambruna et al., 1999) consistently found the line to be very broad ( keV) and very strong (equivalent width [EW] eV). If, however, the continuum was modeled with reflection (Grandi et al., 1997), or with a broken power-law (Woźniak et al., 1998), the line width and EW dropped by over a factor of two. This is consistent with the results of Nandra et al. (1997a), who fit a power-law to the 3–10 keV data. More recent observations of 3C 120 by RXTE (Eracleous, Sambruna & Mushotzky, 2000; Gliozzi, Sambruna & Eracleous, 2003) and BeppoSAX (Zdziarski & Grandi, 2001) have provided some consistency by requiring reflection to fit the continuum and obtained an Fe K EW eV. Thus, previous work has shown that 3C 120 has a curved X-ray continuum with spectral hardening at high energies and a Fe K line which may be broad.
A common result from the reflection models fit to these data is a weak reflection normalization (i.e., ; Gliozzi et al. 2003). This fact, together with the eV iron K EW, led Eracleous et al. (2000) and Zdziarski & Grandi (2001) to postulate that the optically thick accretion disc is truncated in 3C 120 to a hot, optically thin flow. Indeed, based on similar evidence, this interpretation has been applied to other BLRGs (Eracleous & Halpern, 1998; Grandi et al., 1999; Eracleous et al., 2000). If true, this change in accretion flow may provide an important clue to the cause of the radio-loud/radio-quiet dichotomy in AGN physics. However, other explanations, such as an ionized accretion disc (Ballantyne, Ross & Fabian, 2002), can fit the ASCA data of 3C 120 without resorting to a change in accretion geometry. Better data are required before a detailed comparison can be made between a BLRG and the radio-quiet Seyfert 1s.
This paper presents such data in the form of a simultaneous 127 ks XMM-Newton and RXTE observation of 3C 120. The resulting 0.6–10 keV spectrum has the highest signal-to-noise of any BLRG spectrum in that energy range. The observational details are outlined in the next section, and the data reduction is described in Section 3. The spectral and timing analyses of this dataset are presented in Sections 4 and 5, respectively. The results are discussed in Section 6, before we end by summarizing in Section 7.
2 Observations
XMM-Newton (Jansen et al., 2001) observed 3C 120 during revolution 680 between 2003 August 26 05:12:32 and 2003 August 27 18:50:52. The telescope contains two major instruments: the European Photon Imaging Camera (EPIC), which consists of two MOS (Turner et al., 2001) and one pn (Strüder et al., 2001) detector, and the Reflection Grating Spectrometers (RGS; den Herder et al. 2001). This paper focuses on the broadband continuum of 3C 120, so we will defer the analysis of the RGS spectra to a later publication. The medium optical filter was applied to the three EPIC cameras, and the MOS-2 and pn detectors were operated in small window mode. The MOS-1 detector was operated in timing mode, and those data were not included in the following analysis. Finally, the Optical Monitor (OM; Mason et al. 2001) onboard XMM-Newton obtained 26 exposures of 3C 120 in the UVW1 band (2450–3200 Å). Those data will also be presented in another publication.
RXTE observed 3C 120 between 2003 August 26 02:55:12 and 2003 August 27 18:59:44, entirely covering the duration of the XMM-Newton observation. The telescope contains two collimated instruments that together cover the energy range 3–250 keV. The Proportional Counter Array (PCA; Jahoda et al. 1996) consists of 5 xenon and propane-filled co-aligned proportional counter units (PCUs). Only PCU0 and PCU2 were switched on for the duration of the 3C 120 observation, with the other three units taking data intermittently. The High Energy X-ray Timing Experiment (HEXTE; Rothschild et al. 1998) contains two clusters each with four phoswich detectors. During an observation, the clusters are rocked on and off source so that one is collecting data from the source while the other is observing the background.
3 Data Reduction
3.1 XMM-Newton
The EPIC data were extracted from the Observation Data Files (ODF) using the ’emchain’ and ’epchain’ tasks within the XMM-Newton Science Analysis System (SAS) v.6.0. These chains generated calibrated event lists after removing bad pixels, and applying both gain and Charge Transfer Inefficiency (CTI) corrections111see, e.g., http://xmm.vilspa.esa.es/sas/current/doc/epchain/index.html. 3C 120 fell near the edge of the pn small window, and so the spectrum was extracted from a circular region with a radius of 45 arcseconds. The background region was also defined by a circle with the same radius in one of the corners of the window. The background was relatively steady during the observation except for a large increase in count rate during the last 4–5 ks of the observation when the telescope was approaching perigee. This period was not included in the data extraction. A circular region with a radius of 25 arcseconds was employed to extract data from the MOS-2 small window. A similar circle on an adjacent CCD was used to obtain background data for this detector. With these extraction procedures, we obtained a pn dataset with a total good exposure time of 87.5 ks (including the per cent live-time of the pn in small window mode; Strüder et al. 2001) which contained photons when both single and double events were included. The MOS-2 detector yielded photon in 123 ks of good exposure time. Single, double, triple and quadruple events were included in those data. Response matrices and ancillary response files for all the datasets were generated with the ’rmfgen’ and ’arfgen’ tools.
The SAS task ’epatplot’ was used to determine if the extracted spectra were affected by pileup (Ballet, 1999). Unfortunately, the observed count rate was high enough (5.5 s-1) that the MOS-2 spectra would be distorted by pileup. Therefore, we do not include the MOS-2 data in the following spectral analysis. The pn data were unaffected by pileup.
3.2 RXTE
The PCA and HEXTE data were reduced using the tools in FTOOLS v.5.3., with the assistance of the ’rex’ script. The PCA data were screened using the standard criteria. Events were accepted if the Earth elevation angle was degrees, the pointing offset was degrees, the spacecraft had been out of the South Atlantic Anomaly for at least 30 minutes, and the ELECTRON2 parameter (a measure of the background in PCU2) was less than 0.1. Data were then extracted from the top layer of PCU0 and PCU2. The background model appropriate for faint extragalactic sources, pca_bkgd_cmfaintl7_e5v20030331.mdl, was used in the reduction. The tool ’pcarsp’ was then used to produce the response matrix for the time averaged data.
The HEXTE data were also screened by the above criteria, but the background is extracted directly from the detector (since the HEXTE clusters alternate observing the source and the background). One of the detectors in Cluster-1 can no longer produce spectral information, therefore only data from Cluster-0 is used in the analysis presented below. The file xh97mar20c_pwa_64b.rmf is used as the response matrix for Cluster-0 data.
4 Spectral Analysis
In this section we analyze the time-averaged spectrum of 3C 120 from all three instruments (EPIC-pn, PCA, and HEXTE). The spectra were grouped to have a minimum of 20 counts per bin in order for minimization to be applicable. The spectral fitting was performed simultaneously on all datasets using XSPEC v.11.3.0p (Arnaud, 1996). The uncertainties on the best fit parameters are the 2 errorbars for one parameter of interest (i.e., ). Galactic absorption toward 3C 120 is taken to be cm-2 (Elvis, Lockman & Wilkes, 1989), and is modeled by the ’TBabs’ code (Wilms, Allen & McCray, 2000) in XSPEC. Unless otherwise specified, all fits restricted the energy range of the various instruments as follows: 0.6–10 keV (pn), 7–20 keV (PCA), and 20–50 keV (HEXTE). The spectrum hardens suddenly and drastically () at energies less than 0.6 keV. It is unknown if this is real or a calibration problem (the hardening appears below 0.5 keV in the MOS-2), so we have ignored those data pending further investigation. To account for any cross-calibration uncertainties between the different instruments, their relative normalizations were left free during the spectral fitting process.
In Figure 1, the observed source and background spectra are plotted for all three instruments indicating that, except for the HEXTE data, the source is much higher than the background over the energy range of interest.

4.1 The general spectra shape
To obtain an overview of the shape of the X-ray spectrum, we fit the pn, PCA and HEXTE data between 3 and 50 keV with a power-law model altered only by Galactic absorption. The best fit spectral index was , but was statistically unacceptable (/d.o.f.=1658/1435; d.o.f.=degrees of freedom). Extrapolating the model to low energies gives a view of the spectral shape over nearly two orders of magnitude in energy (Figure 2).

The residuals show that the spectrum exhibits significant curvature particularly below keV where a soft excess is required. A soft excess was not necessary in the ASCA analyses (Reynolds, 1997; Grandi et al., 1997) of 3C 120, but one was found in both the ROSAT (Grandi et al., 1997) and BeppoSAX data (Zdziarski & Grandi, 2001). These last authors attribute the soft excess to an extended thermal component possibly seen in the ROSAT High Resolution Imager (HRI). However, McKernan et al. (2003) very recently presented a Chandra gratings observation of 3C 120, and found that the object was entirely consistent with being a point source, with only a very weak (6 per cent of peak) extension in one direction. Therefore, it seems unlikely that the soft excess is due to thermal emission far away from the AGN.
The hard power-law fit also reveals significant residuals in the Fe K region (Figure 3), and a weak reflection hump at – keV.

Below, we will first concentrate on describing the hard X-ray spectrum of 3C 120, including the Fe K line and reflection features. We will then extrapolate these models to the low energy end to investigate their effect on the soft excess.
4.2 The hard X-ray continuum and Fe K line
In this section we attempt to describe the spectrum of 3C 120 between 3 and 50 keV using both simple and detailed models for the continuum. The results are summarized in Table 1.
| Model | d.o.f. | |||||||
|---|---|---|---|---|---|---|---|---|
| PL+G | 1.79 | 6.41 | 0.10 | 1441/1430 | ||||
| PL+2G† | 1.80 | 6.41 | 0.10 | 1419/1228 | ||||
| PEXRAV‡+2G | 1.83 | 6.41 | 0.09 | 18.2f | 0.46 | 1391/1428 | ||
| PEXRIV‡+2G | 1.83 | 6.41 | 0.09 | 18.2f | 0.42 | 0.05 | 1390/1427 | |
| PEXRAV‡+DL∗+G | 1.83 | 6.44 | 176 | 18.2f | 0.46 | 1389/1428 | ||
| 1.83 | 6.43 | 6.0 | 18.2f | 0.47 | 1394/1428 | |||
| 1xFeIONDISC+G | 1.85 | 0.45 | 52 | 1443/1430 | ||||
| blrd∗1xFeIONDISC+G | 1.85 | 74 | 10.2 | 0.44 | 10 | 1389/1428 | ||
| 1.86 | 6.0 | 10.4 | 0.49 | 10 | 1397/1428 | |||
| blrd∗0.5xFeIONDISC+G | 1.90 | 74 | 9.5 | 0.75 | 12 | 1389/1428 | ||
| blrd∗2xFeIONDISC+G | 1.82 | 73 | 10.1 | 0.26 | 10 | 1396/1428 |
Notes: f parameter fixed at value
p parameter pegged at lower limit
† second Gaussian added with keV. Best fit keV, which was fixed for subsequent fits.
‡ for these models the cutoff energy=150 keV and abundances=solar
∗ =1000 for the relativistic models
The fits clearly indicate two distinct emission lines between 6 and 7 keV. The lower energy line has an equivalent width (EW) of 53 eV, is consistent with arising from weakly ionized iron (Fe i–Fe xviii; House 1969), and is slightly broadened (FWHM km s-1). The unresolved higher energy line at keV is consistent with emission from H-like iron and is not very prominent (EW eV), but does significantly improve the fit (at per cent according to the F-test). These iron line parameters agree with those presented by Yaqoob & Padmanabhan (2004), who analyzed Chandra High-Energy Gratings (HEG) data of many bright Seyfert 1 galaxies. Those authors also found marginal evidence for an emission feature at keV from 3C 120 which we confirm with these XMM-Newton data.
Similarly to the previous BeppoSAX and RXTE analyses (Eracleous et al., 2000; Zdziarski & Grandi, 2001; Gliozzi et al., 2003), the spectrum of 3C 120 was well fit with a moderate amount of reflection. These high-quality XMM-Newton data constrain the reflection fraction to be for a solar abundance of Fe when using either the PEXRAV (Magdziarz & Zdziarski, 1995) reflection model, or the more detailed ionized disc (IONDISC) models of Ross & Fabian (1993) and Ross et al. (1999). Furthermore, the ionization parameter of the reflector is low, indicating that the prominent spectral features (the Fe K line and edge) are dominated by neutral reflection.
A diskline model for the Fe K line resulted in a relatively large value for the disc inner radius ( , where is the gravitational radius) for a typical steep emissivity of . However, a similar fit statistic was found when the inner radius was fixed at , and the emissivity allowed to be much flatter. When the curved IONDISC continuum and line spectrum was blurred with the diskline kernel (a significant improvement to the non-blurred case; see Table 1), the value of decreased to about 75 for an emissivity of . The difference is due to changes in the inclination angle and continuum shape. As mentioned in Sect. 1, radio data place an upper-limit of 14 degrees to the inclination angle of the jet (and likely the accretion disc) to the line-of-sight. The minimum angle allowed by the PEXRAV and PEXRIV codes is 18.2 degrees, and the diskline model was fixed at that angle for consistency. Allowing the inclination angle to vary in the PEXRAV model did not improve the fit. As with the PEXRAV+DL model, an acceptable fit was still obtained when and a flatter emissivity allowed.
IONDISC models with iron abundances that differed from solar were also fit to these data. While the resulting was satisfactory, the model with a supersolar iron abundance was a worse fit than the model with strictly solar abundances because of problems accounting for the shape of the iron edge and reflection hump. However, the IONDISC model with half the solar abundance of iron yielded the same fit statistic as the solar model by making use of a steeper primary spectrum of and a higher reflection fraction.
Extrapolating the PEXRAV+DL+G model to 2 keV yields a 2–10 keV flux of erg cm-2 s-1 and a luminosity of erg s-1 (assuming a WMAP cosmology: km s-1 Mpc-1, ; Spergel et al. 2003). Thus, 3C 120 was in a higher flux state during the XMM-Newton observation than found in the well-studied ASCA observation.
4.3 Broadband models
In the previous section, the 3–50 keV spectrum of 3C 120 was found to be well described by a moderate amount of neutral reflection plus two emission lines. Can this model account for the entire observed X-ray spectrum of 3C 120? In Figure 4 we plot the residuals when two of the best-fitting models from Table 1 (namely, PEXRAV+DL+G and the blurred 1xFeIONDISC+G) are extrapolated to 0.6 keV.


The plots show that the two models predict very different shapes for the softer energies. The PEXRAV continuum is very similar to a pure power-law, and so predicts a significant soft excess (e.g., Fig. 2). The IONDISC model has a substantial increase in emission at lower energies due to free-free emission and recombination lines (see, e.g., Ross et al. 1999). As a result, greater than Galactic absorption is predicted below 0.8 keV, as well as a soft-excess.
We first attempted to construct a broadband model of 3C 120 by adding a soft continuum component to the PEXRAV+DL+G model. Intrinsic absorption was also added to the model in case it proved necessary. The parameters of the three most successful fits are shown in Table 2, with the bremsstrahlung continuum providing the best fit to the soft excess.
| Model | d.o.f. | |||||||||
|---|---|---|---|---|---|---|---|---|---|---|
| bbody | 1.85 | 0 | 6.44 | 175 | 0.59 | 0.200 | 2040/1911 | |||
| power-law | 1.75 | 1.4 | 6.44 | 168 | 0.28 | 4.02 | 2026/1911 | |||
| bremss | 1.82 | 0.28 | 6.44 | 175 | 0.44 | 0.46 | 2024/1911 | |||
| 1.83 | 0.57 | 6.44 | 182 | 0.45 | 0.41 | 0.03 | 0.03 | 1999/1909 |
A significant ( per cent) improvement to the broadband model was found by including absorption edges from O vii and O viii. The maximum optical depths of the edges were measured with good precision, and are consistent with previous analyses (Reynolds, 1997; Sambruna et al., 1999; McKernan et al., 2003). The edges provide strong evidence for warm absorption along the line-of-sight to 3C 120 which will be further analyzed using RGS data. A plot of this best fitting broadband model, along with the residuals, is shown in Figure 5. The remaining residuals shown in the figure are dominated by systematics in the detector response, such as the neutral Si K-edge at 1.84 keV and the Au M-edge at 2.2 keV (e.g., Kirsch, 2003; Vaughan & Fabian, 2004).

The bremsstrahlung model requires only slight intrinsic absorption with a column of cm-2. This result was from a cold absorption model, but with the strong evidence for warm absorption provided by the oxygen edges, the actual value of the intrinsic cold absorbing column will likely be lower. Absorption in excess of the Galactic column was also inferred from ROSAT (Grandi et al., 1997), ASCA (Reynolds, 1997; Sambruna et al., 1999), and BeppoSAX (Zdziarski & Grandi, 2001) data. However, it was not found in EXOSAT data (Maraschi et al., 1991) or in the recent Chandra observation (McKernan et al., 2003), although this would depend on the correction for the ACIS degradation.
As seen in Figure 5, the bremsstrahlung component does not dominate the overall X-ray flux from 3C 120, contributing only 3.5 per cent of the 0.6–50 keV flux ( erg cm-2 s-1) and 20 per cent of the 0.6–2 keV flux ( erg cm-2 s-1). The EWs of the emission lines are 53 eV for the broad Fe K line and 11 eV for the ionized line, very similar to the values obtained from the 3–50 keV fits.
Intrinsic absorption, oxygen edges and soft excess models were then added to the IONDISC continuum model (Fig. 4, right-hand side), but the fits lost the good results at the high energy end. This is because the neutral reflection models predict Ly emission lines from H-like Mg and Si between 1 and 2 keV, as well as other recombination lines at lower energies (e.g., Ross et al., 1999). These emission lines are not required by the data at their predicted strengths (for solar abundances), and the fit therefore dropped the reflection fraction by , resulting in a poorer description to the Fe K line and reflection hump. One way to diminish the importance of the softer lines in the IONDISC model is if the reflection spectrum is a result of reprocessing from material at some distance from the illuminating power-law. Then the reflection spectrum can be adjusted independently of the continuum. Indeed, the values of and found by fitting the 3–50 keV spectrum indicate that the reprocessing is occurring well away from the central engine (Table 1).
We therefore attempted to fit the 0.6–50 keV spectrum of 3C 120 with a model of a power-law continuum and distant reflection (modeled with the IONDISC code), as well as intrinsic absorption, O vii and O viii edges, and a bremsstrahlung spectrum to account for the soft excess. This model is not too dissimilar from the two component model of MCG–6-30-15 put forward by Fabian & Vaughan (2003) and Miniutti & Fabian (2004). In this case, however, the reflection component does not extend to the innermost stable orbit of the accretion disc. The results of the spectral fit with this model are shown in Table 3.
| Added Continuum | d.o.f. | |||||||||
|---|---|---|---|---|---|---|---|---|---|---|
| Power-law | 1.86 | 1.0 | 10 | 66 | 9.7 | 0.37 | 0.06 | 0.04 | 2034/1909 | |
| Ionized Reflector† | 1.74 | 1.2 | 10 | 70 | 9.3 | 5 | 0.31 | 0.07 | 0.03 | 2027/1908 |
Notes: † highly ionized reflector added in with fixed at unity
pp parameter pegged at upper/lower limit
A decent fit is obtained, but with a worse reduced as was found for the PEXRAV+DL and bremsstrahlung model (Table 2). Again, this is due to the presence of the soft emission lines predicted by the model. However, these lines must be there at some level in a neutral reflection spectrum, so the better fit by the PEXRAV continuum argues for a subsolar abundance of metals (e.g., O, Mg, Si, and Fe) in 3C 120. Recall that the 3–50 keV spectrum was equally as well fit by a IONDISC model with half the solar abundance of iron. Unfortunately, grids of IONDISC models with other metal abundances differing from solar are not available, so their values cannot be directly constrained. Yet, there is optical spectroscopic evidence for non-solar abundances within 3C 120. Both Baldwin et al. (1980) and French & Miller (1980) find that the metal abundance (in particular O) in the nebular gas may differ from solar by factors of several. It is reasonable to expect that the gas feeding onto the black hole will not have a too dissimilar abundance pattern.
An improvement to the fit was obtained when the additional power-law was replaced by a highly-ionized reflector (from the same set of IONDISC models). The added reflection component included the intrinsic power-law, but had fixed at unity. This model is similar to the two-component ionized disc fit to MCG–6-30-15 presented by Ballantyne, Vaughan & Fabian (2003), but this new reflection component is ionized to the point that it does not contribute much, if any, emission to the Fe K line or absorption to the iron edge (Figure 6).

It does however exhibit a small amount of spectral curvature due to free-free emission at low energies from the hot surface of the slab. This small amount of curvature in the spectrum obviously makes an improvement to the fit from the power-law spectrum ( for 1 additional degree of freedom, giving a -test probability of 98.9 per cent). Since this ionized spectrum does not predict a significant spectral feature, it could not be relativistically blurred to constrain an emission radius. It seems reasonable to expect that it arises from the innermost parts of the accretion disc (e.g., Ballantyne et al., 2003). The EWs of the two emission lines are 50 eV and 12 eV, in good agreement with those obtained from the 3–50 keV fits (Sect. 4.2).
As expected from Fig. 4, the intrinsic absorption column is larger for the IONDISC-based models than with the PEXRAV-based ones, with a value of cm-2. Again, this values will likely drop by a small amount once the warm absorber has been correctly modeled.
The best fitting bremsstrahlung temperature is an order of magnitude lower than the surface temperature of the ionized reflector, and contributes only 0.2 per cent of the total 2–10 keV flux, erg cm-2 s-1. However, it produces 23 per cent of the total 0.6–2 keV flux, erg cm-2 s-1.
The reflection dominated spectrum has a very low ionization parameter, so is dominated by a neutral Fe K line plus recombination lines at lower energies. The width of the Fe K line restricts the reflection region to be greater than from the black hole (of course, a flatter emissivity would allow a lower ). This component contributes 3 per cent of the total 2–10 keV flux and 9 per cent of the total 0.6–50 keV flux, erg cm-2 s-1.
Using the PEXRAV+DL+G and bremsstrahlung continuum from Table 2, we find that the total unabsorbed X-ray luminosity between 2 and 50 keV is =2.9 erg s-1 (=1.2 erg s-1; Sect. 4.2). The Eddington luminosity for a M⊙ black hole is erg s-1, so if the hard X-rays contribute about 10 per cent of the bolometric luminosity of 3C 120 (Elvis et al., 1994), then this observation caught the source accreting very close ( per cent) to the Eddington rate. However, given the small inclination angle into the central engine, it is possible that the observed flux is enhanced due to beaming along the line-of-sight.
4.4 An earlier XMM-Newton observation of 3C 120
3C 120 was previously observed by XMM-Newton during revolution 502 as part of a Guaranteed Time observing program. The observation occurred on 2002 September 6, and lasted for 12.6 ks. The EPIC MOS2 and pn were in small-window mode, and the MOS1 detector was in timing mode. The ODF was downloaded from the XMM-Newton Science Archive222http://xmm.vilspa.esa.es/external/xmm_data_acc/xsa/index.shtml, and reduced using SAS v.6.0. following the same procedures as described in Sect. 3.1. Below, we analyze the pn spectrum from this observation. The total good exposure time after filtering and extraction was 8250 s. These data caught 3C 120 in a slightly lower flux state ( erg cm-2 s-1), and so it interesting to try our best fitting time-averaged models from the previous section to see if there were any important changes to the fit parameters.
We again fit the pn data from 0.6–10 keV, and used two models: (1) the bremsstrahlung and PEXRAV model from Table 2, and (2) the bremsstrahlung+2 IONDISC model from Table 3. Intrinsic absorption and O vii and O viii edges were also included in the models. The results are shown in Table 4.
| Model | EW1 | EW2 | d.o.f. | ||||||||
|---|---|---|---|---|---|---|---|---|---|---|---|
| 1† | 1.90 | 0.49 | 6.43 | 0.09 | 1.9 | 40 | 0.33 | 2 | 0.01 | 0 | 1235/1232 |
| 2∗ | 1.60 | 0.82 | 10 | 80 | 4.98 | 55 | 0.34 | 16 | 0.04 | 0 | 1245/1232 |
Notes: † G replaced DL since unconstrained in DL model
∗ highly ionized reflector has fixed ; other reflector has inclination angle frozen at 9.3 degrees
pp parameter pegged at upper/lower limit
Both models successfully fit the data with similar values of the reduced , but point to two different interpretations of the spectrum. In both cases, the oxygen absorption edges are not required by the fits, but the upper-limits are consistent with the values found from the later, longer XMM-Newton dataset (similarly for the intrinsic absorption columns).
The PEXRAV model results in a steep spectrum which has a high reflection fraction of . The neutral Fe K line is still present, but now has a reduced EW of 40 eV. These measurements imply a drastic change in the source between the two observations, even though the flux differed by only per cent. Indeed, a steeper spectrum at this flux state would be unusual, as 3C 120 has been observed to follow the typical Seyfert behaviour of exhibiting a harder spectrum at lower count rates (e.g., Gliozzi et al., 2003). The very strong Fe edge in the model diminished the contribution of the weak ionized line at keV.
In contrast, the IONDISC model results in a lower at this flux state, in agreement with past observations. The reduced is slightly worse than with the PEXRAV model, but, as in Sect. 4.3, this can be attributed to overestimating the metal abundances in the source. A stronger Fe K edge is possibly needed for this dataset, as ionization parameters that are smaller by a factor of a few are allowed for the highly ionized reflector. Lower values of will produce a more prominent (but still broad; Ross et al. 1999) iron edge. Unfortunately, the inner radius of the distant reflector is unconstrained at large radii, but is consistent with the neutral reflector being brought closer to the central engine. The strength of this component in the 2–10 keV band, relative to the total, was the same 3 per cent as in the longer observation, but the total flux in the bremsstrahlung component was lower by 18 per cent. The total unabsorbed luminosity between 2 and 10 keV predicted by this model is = erg s-1.
5 Timing analysis
3C 120 is a known variable X-ray source (e.g., Marshall et al., 2004), although previous observations have shown that any large amplitude variations occur on timescales of days to weeks (Gliozzi et al., 2003) rather than on the hours-to-days timescale of pointed observations (Reynolds, 1997; McKernan et al., 2003). Such is the case with the current XMM-Newton observation. Figure 7 plots the 0.2–10 keV EPIC pn lightcurve of 3C 120 in 500 s bins.

The lightcurve is dominated by a long timescale declining trend as the source count-rate drops by per cent from the start to the end of the observation. Fitting the lightcurve with a constant yields d.o.f.=5493/238. As it decays 3C 120 also exhibits low amplitude flickering on the order of 2–3 per cent.
Evidence for spectral variability has been previously presented by Zdziarski & Grandi (2001) and Gliozzi et al. (2003). These authors found that 3C 120 was more variable at lower energies, and showed the typical Seyfert 1 characteristic of becoming softer at higher count-rates. Figure 8 plots the EPIC pn 0.2–0.5 keV to 2–10 keV softness ratio from the long XMM-Newton observation.

Modest spectral variability is observed in the source (a constant fit results in d.o.f.=240/162), but it is not in the straightforward manner described above. It appears that the softness ratio remains roughly constant over the first 60 ks of the observation even though the overall count-rate is falling (Fig. 7). Beyond this point, the source shows a gradual hardening. The amplitude of the decrease in the softness ratio is small, which may be the result of the relative minor change in count-rate. Observations that probe longer timescales (e.g., Gliozzi et al., 2003) are necessary to fully understand the variability properties of 3C 120.
There is also modest evidence for an increase in the Fe K line flux in the latter part of the observation. Figure 9 shows
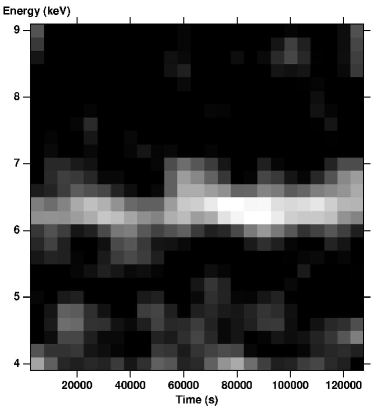
an image plotting the excess flux above the best-fit power-law continuum as a function of both energy (between 4 and 9 keV) and time. For full details on how the image was constructed see Iwasawa et al. (in prep). Concentrating only on the observed Fe K line band, we see that the excess flux appears to increase at ks into the observation, before diminishing 10–20 ks later. The observed increase is significant at per cent level (Figure 10), so future observations are required to verify the possibility of a variable Fe K line in 3C 120.

6 Discussion
In the previous sections we have presented the results of a simultaneous 127 ks XMM-Newton and RXTE observation of 3C 120, the brightest BLRG at X-ray energies. This dataset provides the highest quality 0.6–10 keV spectrum of a radio-loud AGN ever produced. Below, we will discuss the results of our analysis and attempt to place then in the larger context of AGN and jet physics.
6.1 Accretion mode
One of the long-standing puzzles in the study of AGN is the cause of the wide range of radio powers produced by the central engine. Only about 15–20 per cent of quasars and Seyfert galaxies produce large-scale, luminous radio jets (Kellermann et al., 1989). These radio-loud AGN tend to dwell in large elliptical galaxies, and thus have central black holes with masses M⊙ (Laor, 2000; McLure & Dunlop, 2001; Jarvis & McLure, 2002). In contrast, the radio-quiet AGN mostly inhabit spiral galaxies and so have less massive black holes. However, recent compilations of AGN black hole masses suggest that radio-loud sources can exist over a wide range of black hole mass and accretion rate (Ho 2002; Oshlack, Webster & Whiting 2002; Woo & Urry 2002; for a dissenting view see Laor 2004). Indeed, low-luminosity AGNs, such as LINERs, also appear to be more frequently radio-loud than Seyfert galaxies (Ho, 2002; Nagar et al., 2002).
As mentioned in Sect. 1, previous observations of 3C 120 and other BLRGs by ASCA or RXTE have found slightly harder X-ray continua and weaker reflection features than the radio-quiet Seyfert 1s (e.g., Eracleous & Halpern, 1998). These facts favoured an interpretation of an accretion geometry where the optically-thick disc was truncated into an optically-thin, but geometrically thick flow. Our analysis of the XMM-Newton data of 3C 120 confirms the previous findings of apparent weak reflection and Fe K line (Table 1). Moreover, the neutral Fe K line is observed to be rather narrow (FWHM km s-1), although, because of the low inclination angle into the system, this corresponds to a disc radius of assuming a emissivity. Based on these facts alone it would be tempting to conclude that this is strong evidence for a truncated accretion flow in 3C 120. However, if a flatter emissivity profile is allowed, then the line may extend down to the innermost stable circular orbit (ISCO) for a Schwarzschild black hole with little change in the fit statistic (Table 1). Such flat emissivity profiles have been postulated to explain some of the more unusual narrow lines observed by XMM-Newton (Yaqoob et al., 2003; Vaughan et al., 2004). While there is no a priori reason to expect flat emissivity profiles in the central engines of AGN, it is important to realize that the geometry of the X-ray emitting region is unknown even in radio-quiet Seyfert 1s. Since radio-loud AGN are already unusual in the manner of their radio emission, one could not rule out a non-standard emissivity profile for the Fe K line. For example, power removed from the disc by the jet could reduce the emissivity profile near the center. If this power is then released as an X-ray source above the black hole (e.g., Ghisellini, Haardt & Matt, 2004), a flat emissivity profile will also result (Vaughan et al., 2004). Alternatively, the jet may obscure the central regions of the disc from view, resulting in a narrower iron line (this could be relevant for face-on sources such as 3C 120). Thus, the width of the iron line in the XMM-Newton data cannot be used to argue for a truncated accretion disc in 3C 120. The low reflection amplitude can be explained by a subsolar iron abundance (Table 1) or dilution from another continuum component, rather than a low intrinsic covering factor. As all three explanations result in roughly the same statistical fit to the data, there is no clear indication for a change in accretion geometry in 3C 120.
An alternative explanation for the low reflection fraction and weak Fe K line in BLRGs was put forward by Ballantyne et al. (2002). These authors suggested that the observed properties could be explained by reflection from a highly photoionized accretion disc that may extend unaltered down to the ISCO. This model can fit the XMM-Newton data presented here, but requires a double reflection model (cf., Ballantyne et al., 2003) where the innermost reflector is highly ionized, and a neutral outer reflector which produces the observed Fe K line (see Fig. 6). Moreover, subsolar metal abundances (e.g., O, Mg and Si) are also required in order for the emission features at softer energies to be consistent with the data. However, the inner ionized reflector was required to have a very high ionization parameter, so that the reflection spectrum, when combined with the incident power-law, was almost indistinguishable from a power-law itself. As a result, we were unable to use relativistic blurring to test if it was consistent with arising from close to the ISCO. Furthermore, the differences between the highly ionized reflector and a pure power-law which resulted in the better fit are subtle and thus are dominated by systematics in the data and response matrices rather than physics. Therefore, although the double reflection model provided almost as good a spectral fit, it also cannot be judged to be the preferred accretion geometry for 3C 120.
The 12.7 ks observation of 3C 120 caught the source in a slightly lower flux state than the long XMM-Newton pointing, so one would hope to see evidence of a lower ionization state in the inner accretion disc. When fit to these data, the double reflection model provided a good fit with an ionization parameter and inner radius consistent with being smaller, but with large error-bars. It seems that to truly test this model (as well as the others) would require fits at a number of different flux levels. As 3C 120 varies most strongly on timescales of days to weeks (Gliozzi et al., 2003; Marshall et al., 2004), a number of 20–30 ks observations each separated by a month or two, might be the best strategy for finally determining the accretion mode in 3C 120.
6.2 The role of the relativistic jet
3C 120 possesses a superluminal radio jet which constrains the inclination angle to degrees. The angle resulting from the relativistic fits to the X-ray spectrum is consistent with this limit (Tables 1 and 3). This low inclination angle implies that 3C 120 may show some blazar characteristics, such as rapid X-ray variability or a very hard spectrum. At the very least, a jetted X-ray component could dilute a Seyfert spectrum, and cause the observed weak reflection features. The XMM-Newton observation clearly shows that any blazar-like features due to the jet do not dominate the X-ray emission. The Fe K line, reflection hump, spectral-energy distribution (Maraschi et al., 1991), and lack of COMPTEL or EGRET detection (Maisack et al., 1995; von Montigny et al., 1995) all point to a high-energy spectrum that is Seyfert-like (e.g. Zdziarski & Grandi, 2001). Furthermore, the observed variability properties (Gliozzi et al., 2003; Marshall et al., 2004) are also inconsistent with a jet origin for the X-ray emission. While it is hard to place a strict limit on any contribution by a blazar-like component (Gliozzi et al. (2003) estimate 5 per cent), the XMM-Newton data do not provide any evidence for this component. A higher-energy observation by Integral or ASTRO-E2 is necessary to determine the amount, if any, of jet contamination to the X-ray emission of 3C 120.
6.3 The origin of the soft excess
The XMM-Newton data indicates a clear need for a soft excess in the spectrum of 3C 120, in agreement with earlier work (Walter & Courvoisier, 1992; Grandi et al., 1997; Zdziarski & Grandi, 2001). However, we found that the soft excess is best fit by a thermal bremsstrahlung spectrum rather than a power-law (Grandi et al., 1997) or a line-emitting plasma (Zdziarski & Grandi, 2001). The best fit bremsstrahlung model had a temperature of – keV or – K, and was required to be subject to intrinsic as well as Galactic absorption (as opposed to the plasma model of Zdziarski & Grandi 2001). This agrees with the fact that the zeroth-order Chandra image of 3C 120 did not detect a significant extended component (McKernan et al., 2003). The total unabsorbed luminosity in the bremsstrahlung spectrum is erg s-1, which is less than half of the total X-ray luminosity of 3C 120, erg s-1. The unabsorbed free-free spectrum peaks in space at 0.2 keV.
The hot temperature of the bremsstrahlung spectrum and the close relation between the luminosities strongly suggests that the X-ray emission is the cause of the hot emitting gas. The lower bremsstrahlung flux observed from the archival observation of 3C 120 also points to a connection between the free-free emitting gas and the AGN. Two possible origins for this hot gas are the broad-line region, and nearby giant H ii regions. Optical studies of the broad emission lines in 3C 120 have all noticed the presence of strong He lines (e.g., Moles et al., 1988), which can be explained if the lines form in regions of very high density ( cm-3; Rudy et al. 1987). The inclination angle into 3C 120 is such that our line-of-sight may pass through a significant volume of the photoionized gas that makes up the broad-line region. With the high density implied by the He emission lines, a strong free-free continuum may be emitted. This scenario could be tested by other observations of Seyferts or BLRG with low inclination angles.
The area directly around the nucleus of 3C 120 is a chaotic region of photoionized gas (Hua, 1988; Soubeyran et al., 1989), with plenty of H and O [iii] emission observed to be within the point-spread function of XMM-Newton (Hua, 1988). If the AGN dominates the ionization of this surrounding gas, then, assuming the presence of high density gas to increase the free-free emissivity, these giant H ii regions may be the source of the observed bremsstrahlung component. A detailed analysis of the Chandra data which would miss most of this emission could test this model.
6.4 Implications for understanding jet formation
The goal of X-ray spectroscopy of radio-loud objects is to elucidate details on how relativistic collimated outflows are generated by comparing the results to the more numerous radio-quiet sources. Has this XMM-Newton observation of 3C 120 brought us closer to that goal? The exact accretion geometry close to the central black hole remains uncertain (Sect. 6.1). The observed luminosity and inferred black hole mass imply that 3C 120 is accreting close to its Eddington rate. This would seem to make a truncated accretion disc geometry rather unlikely if the inner disc had to take on a radiatively-inefficient form such as an ADAF (advection dominated accretion flow; Narayan & Yi 1995), which is stable only at low accretion rates. At high accretion rates, the disc will likely be thicker due to radiation pressure (see, e.g., ’slim’ discs; Abramowicz et al. 1988), but can extend down to the ISCO. If radio-loudness is more common (Xu, Livio & Baum, 1999) at very high and very low luminosities (where ADAFs are more likely) then that would suggest that thick accretion flows may be very important for the launching of jets (see also Marchesini, Celotti & Ferrarese 2004 and Begelman & Celotti 2004). This is consistent with some of the more recent theoretical considerations (Meier, 1999, 2001) which notes the importance of the poloidal magnetic field in the disc for jet production.
A highly ionized accretion disc would be consistent with a high accretion rate. Ionized Fe K lines have been observed in XMM-Newton observations of the high-luminosity Seyferts Mrk 205 and Mrk 509 (Reeves et al. 2001; Pounds et al. 2001; De Rosa et al. 2004; but see Page, Davis & Salvi 2003). Ionized discs have long been considered an explanation for the weak-to-non-existent Fe K lines in quasars (i.e., the X-ray Baldwin effect; Iwasawa & Taniguchi 1993; Nandra et al. 1997b), and have been successfully applied to some narrow-line Seyfert 1s (NLS1s) which are believed to be accreting at a significant fraction of Eddington (Ballantyne, Iwasawa & Fabian, 2001; Longinotti et al., 2003; Pounds et al., 2003). Interestingly, there are very few known radio-loud NLS1s which suggests that a high or low accretion rate relative to Eddington is not the only parameter important for jet formation. NLS1s have lower than typical black hole masses (Ferrarese et al., 2001; Warner, Hamann & Dietrich, 2004), which means their accretion discs would likely be denser and not as thick as ones around higher mass black holes accreting at the same fraction of Eddington (Shakura & Sunyaev, 1973). If jet production is strongly sensitive to disc thickness then this would be a possible explanation for apparent correlation between radio-loud AGN and black holes with masses M⊙. These ideas can also be extended down to the lower mass Galactic black hole candidates, where jet production is often observed only in the low/hard state (Gallo, Fender & Pooley, 2003), and is quenched when the systems move to the high/soft state (e.g., Fender et al., 1999). A truncated accretion disc geometry in the low/hard state when the accretion rate is small, moving to a thinner and denser configuration in the more rapidly accreting high/soft state would be consistent with the picture described above. Clearly, more observations are required to test the above scenario. In this regard, ionized disc modeling will be vitally important; as we have seen with 3C 120, there can be very subtle differences between a power-law and ionized-disc continuum which will need to be taken into account in order to obtain an accurate picture of the inner accretion disc in AGN.
7 Summary and Conclusions
This paper presented EPIC data from a 127 ks XMM-Newton observation of 3C 120 that was performed simultaneously with RXTE. The time averaged spectral fitting found similar results to previous observations: a weak reflection spectrum, with a relatively small (EW eV) neutral Fe K line. The data strongly requires absorption greater than the Galactic value and a soft excess. Small absorption edges from O vii and O viii also significantly improve the fits, implying the presence of a weak warm absorber. The soft excess was best fit by a thermal bremsstrahlung component, which we speculate arises from either the broad-line region or photoionized regions close to the nucleus. The data also prefers a weak ionized iron line at keV, as first suggested by a Chandra observation (Yaqoob & Padmanabhan, 2004). Tentative evidence for Fe K variability was presented which needs to be verified by future observations.
We are unable to convincingly determine whether a truncated or non-truncated accretion disc geometry provides the best description of the data. A basic power-law plus simple distant reflector model provided the best statistical fit. A double reflection model, combining the features of a very highly ionized and a neutral reflector also fits the broadband data, but requires subsolar metal abundances based on the strength of the soft X-ray emission features. There are no constraints on the location of the highly ionized reflector, but it most plausibly arises from very close to the ISCO. The neutral reflector arises from the outer parts ( ) of the disc. The spectral and variability results confirm the source is Seyfert-like, and that any jet emission in the observed band will be very small.
This observation has clarified many of the outstanding questions regarding the spectrum of 3C 120, but unfortunately further observations are required to produce a convincing physical model. The fact that 3C 120 was accreting close to the Eddington limit is consistent with the ionized disc model and implies that disc thickness may be a key parameter in the ability of a system to launch powerful relativistic jets.
Acknowledgments
Based on observations obtained with XMM-Newton, an ESA science mission with instruments and contributions directly funded by ESA Member States and the USA (NASA). DRB acknowledges financial support from the Natural Sciences and Engineering Research Council of Canada. ACF thanks the Royal Society for support.
References
- Abramowicz et al. (1988) Abramowicz M.A., Czerny B., Lasota J.P., Szuszkiewicz E., 1988, ApJ, 332, 646
- Arnaud (1996) Arnaud K.A., 1996, in ASP Conf. Ser. 101, Astronomical Data Analysis Software and Systems V, ed. G.H. Jacoby & J. Barnes (San Francisco: ASP), 17
- Arp (1975) Arp H., 1975, PASP, 87, 545
- Baldwin et al. (1980) Baldwin J.A., Carswell R.F., Wampler E.J., Smith H.E., Burbidge E.M., Boksenberg A., 1980, ApJ, 236, 388
- Ballantyne, Iwasawa & Fabian (2001) Ballantyne D.R., Iwasawa K., Fabian A.C., 2001, MNRAS, 323, 506
- Ballantyne et al. (2002) Ballantyne D.R., Ross R.R., Fabian A.C., 2002, MNRAS, 332, L45
- Ballantyne et al. (2003) Ballantyne D.R., Vaughan S., Fabian A.C., 2003, MNRAS, 342, 239
- Ballet (1999) Ballet J., 1999, A&AS, 135, 371
- Begelman & Celotti (2004) Begelman M.C., Celotti A., 2004, MNRAS Letters, in press (astro-ph/0406607)
- Burbidge (1967) Burbidge E.M., 1967, ApJ, 149, L51
- Clarke, Bolton & Shimmins (1966) Clarke M.E., Bolton J.G., Shimmins A.J., 1966, Australian J. Phys., 19, 375
- Cohen et al. (1977) Cohen M.H. et al., 1977, Nature, 268, 405
- den Herder et al. (2001) den Herder J.W. et al., 2001, A&A, 365, L7
- De Rosa et al. (2004) De Rosa A., Piro L., Matt G., Perola G.C., 2004, A&A, 413, 895
- Elvis, Lockman & Wilkes (1989) Elvis M., Lockman F.J., Wilkes B.J., 1989, AJ, 97, 777
- Elvis et al. (1994) Elvis M., Wilkes B.J., McDowell J.C., Green R.F., Bechtold J., Willner S.P., Oey M.S., Polomski E., Cutri R., 1994, ApJS, 95, 1
- Eracleous & Halpern (1998) Eracleous M., Halpern J.P., 1998, ApJ, 505, 577
- Eracleous et al. (2000) Eracleous M., Sambruna R., Mushotzky R.F., 2000, ApJ, 537, 654
- Fabian & Vaughan (2003) Fabian A.C., Vaughan S., 2003, MNRAS, 340, L28
- Fabian et al. (1989) Fabian A.C., Rees M.J., Stella L., White N.E., 1989, MNRAS, 238, 729
- Fender et al. (1999) Fender R., et al., 1999, ApJ, 519, L165
- Ferrarese et al. (2001) Ferrarese L., Pogge R.W., Peterson B.M., Merritt D., Wandel A., Joseph C.L., 2001, ApJ, 555, L79
- French & Miller (1980) French H.B., Miller J.S., 1980, PASP, 92, 753
- Gallo, Fender & Pooley (2003) Gallo E., Fender R.P., Pooley G.G., 2003, MNRAS, 344, 60
- Ghisellini, Haardt & Matt (2004) Ghisellini G., Haardt F., Matt G., 2004, A&A, 413, 535
- Gliozzi et al. (2003) Gliozzi M., Sambruna R.M., Eracleous M., 2003, ApJ, 584, 176
- Grandi et al. (1997) Grandi P., Sambruna R.M., Maraschi L., Matt G., Urry C.M., Mushotzky R.F., 1997, ApJ, 487, 636
- Grandi et al. (1999) Grandi P. et al., 1999, A&A, 343, 33
- Heckman et al. (1986) Heckman T.M., Smith E.P., Baum S.A., van Breugel W.J.M., Miley G.K., Illingworth G.D., Bothun G.D., Balick B., 1986, ApJ, 311, 526
- Ho (2002) Ho L.C., 2002, ApJ, 564, 120
- House (1969) House L.L., 1969, ApJS, 18, 21
- Hua (1988) Hua C.T., 1988, A&A, 199, 105
- Iwasawa & Taniguchi (1993) Iwasawa K., Taniguchi Y., 1993, ApJ, 413, L15
- Jahoda et al. (1996) Jahoda K., Swank J., Giles A.B., Stark M.J., Strohmayer T., Zhang W., Morgan E.H., 1996, Proc. SPIE, 2808, 59
- Jansen et al. (2001) Jansen F. et al., 2001, A&A, 365, L1
- Jarvis & McLure (2002) Jarvis M.J., McLure R.J., 2002, MNRAS, 336, L38
- Kellermann et al. (1989) Kellermann K.I., Sramek R., Schmidt M., Shaffer D.B., Green R., 1989, AJ, 98, 1195
- Kirsch (2003) Kirsch M., 2003, XMM-Newton Calibration Document XMM-SOC-CAL-TN-0018, available at http://xmm.vilspa.esa.es/docs/documents/CAL-TN-0018-2-1.pdf
- Laor (2000) Laor A., 2000, ApJ, 543, L111
- Laor (2004) Laor A., 2004, in AGN Physics with the Sloan Digital Sky Survey, eds. G.T. Richards & P.B. Hall, ASP Conf. Ser., in press (astro-ph/0312417)
- Longinotti et al. (2003) Longinotti A.L., Cappi M., Nandra K., Dadina M., Pellegrini S., 2003, A&A, 410, 471
- Magdziarz & Zdziarski (1995) Magdziarz P., Zdziarski A.A., 1995, MNRAS, 273, 837
- Maisack et al. (1995) Maisack M., et al., 1995, A&A, 298, 400
- Maraschi et al. (1991) Maraschi L., Chiappetti L., Falomo R., Garilli B., Malkan M., Tagliaferri G., Tanzi E.G., Treves A., 1991, ApJ, 368, 138
- Marchesini, Celotti & Ferrarese (2004) Marchesini D., Celotti A., Ferrarese L., 2004, MNRAS, 351, 733
- Marscher et al. (2002) Marscher A.P., Jorstad S.G., Gómez J.-L., Aller M.F., Teräsranta H., Lister M.L., Stirling A.M., 2002, Nature, 417, 625
- Marshall et al. (2004) Marshall K., Ferrara E.C., Miller H.R., Marscher A.P., Madejski G., 2004, in X-Ray Timing 2003: Rossi and Beyond, eds. P. Kaaret, F.K. Lamb, J.H. Swank (Melville, NY: American Institute of Physics) (astro-ph/0312422)
- Mason et al. (2001) Mason K.O. et al., 2001, A&A, 365, L36
- McKernan et al. (2003) McKernan B., Yaqoob T., Mushotzky R., George I.M., Turner T.J., 2003, ApJ, 598, L83
- McLure & Dunlop (2001) McLure R.J., Dunlop J.S., 2001, MNRAS, 327, 199
- Meier (1999) Meier D.L., 1999, ApJ, 522, 753
- Meier (2001) Meier D.L., 2001, ApJ, 548, L9
- Miniutti & Fabian (2004) Miniutti F., Fabian A.C., 2004, MNRAS, 349, 1435
- Moles et al. (1988) Moles M., del Olmo A., Masegosa J., Perea J.D., 1988, A&A, 1988, 197, 1
- Nagar et al. (2002) Nagar N.M., Falcke H., Wilson A.S., Ulvestad J.S., 2002, A&A, 392, 53
- Nandra et al. (1997a) Nandra K., George I.M., Mushotzky R.F., Turner T.J., Yaqoob T., 1997a, ApJ, 477, 602
- Nandra et al. (1997b) Nandra K., George I.M., Mushotzky R.F., Turner T.J., Yaqoob T., 1997b, ApJ, 488, L91
- Narayan & Yi (1995) Narayan R., Yi I., 1995, ApJ, 444, 231
- Oke, Readhead & Sargent (1980) Oke J.B., Readhead A.C.S., Sargent W.L.W., 1980, PASP, 92, 758
- Oshlack, Webster & Whiting (2002) Oshlack A.Y.K.N., Webster R.L., Whiting M.T., ApJ, 576, 81
- Page, Davis & Salvi (2003) Page M.J., Davis S.W., Salvi N.J., 2003, MNRAS, 343, 1241
- Peterson et al. (1998) Peterson B.M., Wanders I., Bertram R., Hunley J.F., Pogge R.W., Wagner R.M., 1998, ApJ, 501, 82
- Pounds et al. (2001) Pounds K., Reeves J., O’Brien P., Page K., Turner M., Nayakshin S., 2001, ApJ, 559, 181
- Pounds et al. (2003) Pounds K.A., Reeves J.N., Page K.L., Wynn G.A., O’Brien P.T., 2003, MNRAS, 342, 1147
- Reeves et al. (2001) Reeves J.N., Turner M.J.L., Pounds K.A., O’Brien P.T., Boller Th., Ferrando P., Kendziorra E., Vercellone S., 2001, A&A, 365, L134
- Reynolds (1997) Reynolds C.S., 1997, MNRAS, 286, 513
- Ross & Fabian (1993) Ross R.R., Fabian A.C., 1993, MNRAS, 261, 74
- Ross et al. (1999) Ross R.R., Fabian A.C., Young A.J., 1999, MNRAS, 306, 461
- Rothschild et al. (1998) Rothschild R.E. et al., 1998, ApJ, 496, 538
- Rudy et al. (1987) Rudy R.J., Rossano G.S., Puetter R.C., Cohen R.D., 1987, AJ, 92, 284
- Sambruna et al. (1999) Sambruna R.M., Eracleous M. & Mushotzky R.F., 1999, ApJ, 526, 60
- Seielstad et al. (1979) Seielstad G.A., Cohen M.H., Linfield R.P., Moffet A.T., Romney J.D., Schilizzi R.T., Shaffer D.B., 1979, ApJ, 229, 53
- Shakura & Sunyaev (1973) Shakura N.I., Sunyaev R.A., 1973, A&A, 24, 337
- Soubeyran et al. (1989) Soubeyran A., Wlérick G., Bijaoui A., Lelièvre G., Bouchet P., Horville D., Renard L., Servan B., 1989, A&A, 222, 27
- Spergel et al. (2003) Spergel D.N. et al., 2003, ApJS, 148, 175
- Strüder et al. (2001) Strüder L. et al., 2001, A&A, 365, L18
- Turner et al. (2001) Turner M.J.L. et al., 2001, A&A, 365, L27
- Vaughan & Fabian (2004) Vaughan S., Fabian A.C., 2004, MNRAS, 348, 1415
- Vaughan et al. (2004) Vaughan S., Fabian A.C., Ballantyne D.R., De Rosa A., Piro L., Matt G., 2004, MNRAS, 351, 193
- von Montigny et al. (1995) von Montigny C., et al., 1995, A&A, 299, 680
- Walker, Benson & Unwin (1987) Walker R.C., Benson J.M, Unwin S.C., 1987, ApJ, 316, 546
- Walker et al. (2001) Walker R.C., Benson J.M., Unwin S.C., Lystrup M.B., Hunter T.R., Pilbratt G., Hardee P.E., 2001, ApJ, 556, 756
- Walter & Courvoisier (1992) Walter R., Courvoisier T.J.-L., 1992, A&A, 258, 255
- Wandel, Peterson & Malkan (1999) Wandel A., Peterson B.M., Malkan M.A., 1999, ApJ, 526, 579
- Warner, Hamann & Dietrich (2004) Warner C., Hamann F., Dietrich M., 2004, ApJ, 608, 136
- Webb (1990) Webb J.R., 1990, AJ, 99, 49
- Wilms, Allen & McCray (2000) Wilms J., Allen A., McCray R., 2000, ApJ, 542, 914
- Wlerick, Westerlund & Garnier (1979) Wlerick G., Westerlund B., Garnier R., 1979, A&A, 72, 277
- Woo & Urry (2002) Woo J.-H., Urry C.M., 2002, ApJ, 581, L5
- Woźniak et al. (1998) Woźniak P.R., Zdziarski A.A., Smith D., Madejski G.M., Johnson W.N., 1998, MNRAS, 299, 449
- Xu, Livio & Baum (1999) Xu C., Livio M., Baum S., 1999, AJ, 118, 1169
- Yaqoob & Padmanabhan (2004) Yaqoob T., Padmanabhan U., 2004, ApJ, 604, 63
- Yaqoob et al. (2003) Yaqoob T., George I.M., Kallman T.R., Padmanabhan U., Weaver K.A., Turner T.J., 2003, ApJ, 596, 85
- Zdziarski & Grandi (2001) Zdziarski A.A., Grandi P., 2001, ApJ, 551, 186