The luminosity and redshift distributions of short-duration GRBs
Using the BATSE peak flux distribution we rederive the short GRBs luminosity function and compare it with the observed redshift distribution of long bursts. We show that both distributions are compatible with the assumption that short as well as long bursts follow the star formation rate. In this case the difference between the two observed distributions can be interpreted as arising mostly from differences in the detector’s sensitivity to long and short bursts, while the local rate of short bursts is Gpc-3yr-1 . We also consider the possibility that short GRBs may be associated with binary neutron star mergers and estimate the effect of the merging time delay on the luminosity function and redshift distribution. We find that in this case the local rate of short GRBs is Gpc-3yr-1. Assuming that all binary merging systems lead to short GRBs, we find a typical jet opening angle of .
Key Words.:
cosmology:observations-gamma rays:bursts1 Introduction
Our knowledge of gamma-ray bursts (GRBs) has improved enormously with the detection of optical afterglows that allowed determination of GRBs redshifts. We know now that GRBs are cosmological, that their emission is beamed in narrow jets, and that the isotropic equivalent energy emitted by gamma-rays ranges from to ergs while the actual emitted energy is around ergs. Moreover, afterglow studies suggest that GRBs are associated with the collapse of massive stars and that the burst rate may be linked to the rate of star formation in galaxies.
Our knowledge is limited, however, to long-duration GRBs with sec, since no afterglows have been observed so far for short bursts (Gandolfi et al. 2000) with sec (see Kouveliotou et al. (1993) for the classification of long and short GRBs). While current detectors are less sensitive to short bursts, it is not clear whether this is an observational artifact or a real feature (see e.g. Panaitescu, Kumar & Narayan 2001). Hopefully the upcoming detector Swift will answer this question. As a consequence there is no direct knowledge of the redshifts, luminosities, and space densities of short bursts.
In this paper we describe an attempt to determine the luminosity function and formation rate of short GRBs from the BATSE peak flux distribution. These two quantities are fundamental to understanding the nature of these objects. Unfortunately the observed flux distribution is a convolution of these two unknown functions, so it is impossible to determine both functions without additional information. We must, therefore, assume the formation rate of short bursts and determine the luminosity function, or vice versa. Cohen and Piran (1995) have shown that the observed BATSE flux distribution can be fitted with very different luminosity functions depending on the choice of the GRB rate. As it is easier to make physical assumptions about the rate of short GRBs, we derive the luminosity function for two physical assumptions concerning the rate of short GRBs. We, first, assume that short GRBs evolve in redshift like long ones and follow the star formation rate (SFR). Then we examine the possibility that short GRBs arise from neutron star mergers that lag behind the SFR by a specific distribution of time lags.
We parameterize our luminosity function following Schmidt (2001) and deterimne its parameters by obtaining the best fit to the differential peak flux distribution. Our analysis is slightly more elaborated than the one used by Schmidt (2001), who only fitted the first moment of the peak flux distribution . Given, the uncertainties and the assumptions concerning the shape of the luminosity function his method is, however, sufficient enough to give an idea of the relevant parameters. We find that under the assumption that both the long and short bursts follow the SFR, the local rate of the short bursts is more than 1/2 the value of the long ones, while the number of short GRBs detected by BATSE is of the long ones.
From comparison of the value of the long bursts (Guetta, Piran & Waxman 2004, GPW) with the one found in this paper for the short bursts , it is clear that the distribution of observed short bursts is different than the distribution of observed long ones (Mao, Narayan & Piran 1994, Katz & Canel 1996, Tavani 1998). In particular this implies that the population of observed short bursts is closer on average than the population of observed long ones. This does not imply, however, that the real distribution of short GRBs is necessarily different from the real long ones and it is possible that both intrinsic distributions are the same and both follow the SFR. In fact we find that we can explain most of the difference in values and in the observed redshift distributions by the different thresholds of BATSE for detecting long and short bursts. For a short burst one has to se a shorter (and hence noisier) temporal window (Mao, Narayan & Piran 1994). Specifically BATSE is usually triggered on a 64msec window for short bursts and on 1sec for long ones is less sensitive to short bursts by a factor of 4. (this ratio is intended for the peak flux averaged over the trigger time scale). The slightly different typical peak luminosities and spectra between long and short bursts have a small additional effect on the observed redshift distributions.
An interesting question is whether short bursts could arise from single peaks of long bursts in which the rest of the burst is hidden by noise. In this case the assumption that short GRBs follow the SFR-like long ones is correct: Nakar and Piran (2002) have shown that in most long bursts the second highest peak is comparable in height to the first one, thus, implying that the second peak should be above the noise like the first one. Short bursts seem to be a different entity. This duration-hardness distribution (Dezalay et al. 1996, Kouveliotou et al. 1996, Qin et al. 2000) that clearly shows that there are no soft short bursts, further support this hypothesis. It is natural, therefore, to consider the possibility that short GRBs have different progenitors than long ones. In particular is has been suggested that short bursts originate from neutron star-neutron star (NS-NS) mergers (Eichler et al. 1989). In this case we can expect a delay due to merging time between the SFR and the NS-NS merger rate (Piran 1992, Ando 2004). We repeat, therefore, our previous analysis under this assumption. We consider here the merging time distribution implied the current data for binary neutron stars (Champion et al. 2004). When this delay is taken into account, the real redshift distribution of the short bursts constitutes a closer population than the long population and the difference in the observed distributions of short and long bursts is not simply the effect of the BATSE threshold.
This paper is structured in two main parts. In the first part we derive the short GRB luminosity function (LF) and the observed redshift distribution while assuming that short bursts follow the star formation rate. In the second part we consider the possibility that binary neutron star mergers are the progenitors of short bursts and analyze the effect of the merging time delay both on the LF and on the observed redshift distribution.
2 Derivation of the luminosity function from the BATSE sample
We consider all the short GRBs (sec) (Kouveliotou et al., 1993) detected while the BATSE onboard trigger (Paciesas et al. 1999) was set for 5.5 over background in at least two detectors in the energy range 50-300keV. Among them we took bursts for which at the 64 ms timescale, where is the count rate in the second brightest illuminated detector and the minimum detectable rate. These selection criteria for the short GRBs sample used by Schmidt (2001) and are compatible with those used by GPW for the long bursts. These are the minimal conditions for a uniform sample with clear selection criteria. Note that BATSE has used several triggering modes, and using bursts triggered differently would result in a nonuniform sample. With this sample of 194 GRBs we find , which is significantly different than the value found in GPW for long GRBs.
Like GPW and Schmidt (2001), we consider a broken power law LF with lower and upper limits, and , respectively. The local luminosity function of GRB peak luminosities , defined as the co-moving space density of GRBs in the interval to is
| (1) |
where is a normalization constant so that the integral over the luminosity function equals unity. We stress that this luminosity function is the “isotropic-equivalent” luminosity function, i.e. it does not include a correction factor due to the fact that GRBs are beamed.
For given values of the parameters we determine the best fit values of the parameters , and , as well as their allowed region at level, by finding the least . We use the cosmological parameters km/sec/Mpc, , and .
The peak flux of a GRB of peak luminosity observed at redshift is
| (2) |
where is the bolometric luminosity distance and is the integral of the spectral energy distribution within the observed window keV and keV. Schmidt (2001) finds that the median value of -1.1 for the spectral photon index in this 50-300keV band for the short bursts sample. We use this value for a simplified k-correction.
Objects with luminosity observed by BATSE with a flux limit are detectable to a maximum redshift that can be derived from Eq. 2. We consider the average limiting flux ph cm-2 sec-1 taken from the BATSE sample. The number of bursts with a peak flux is given by
| (3) |
where is the local rate of GRBs at redshift , the factor accounts for the cosmological time dilation, and is the comoving volume element.
3 Short GRBs that follow the SFR
We consider, first, the possibility that the short GRBs follow the SFR as do long ones. Following Schmidt (2001) we employ the parameterization of Porciani & Madau (2001), in particular, their SFR model SF2
| (4) |
where is the present GRB rate and , with interpreted as the present day cosmological parameters.
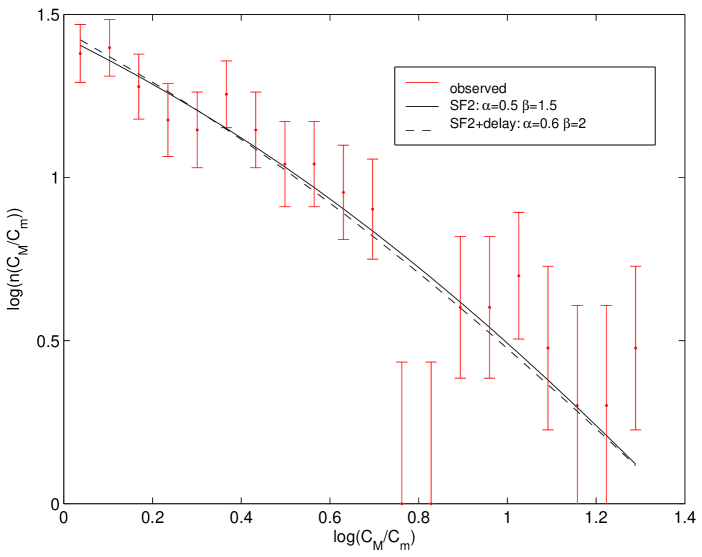
Since random errors in a cumulative distribution, , are correlated, we use the differential distributions, , for the best fit analysis. We perform a maximum likelihood analysis to obtain the luminosity function parameters and their 1 errors, keeping and . In the following, we show, that the results do not change significantly when we increase the values of . If we increase we add weak bursts that are practically undetectable. On the other hand, if we increase we add a small number of detectable bursts that are not numerous enough to influence the analysis.
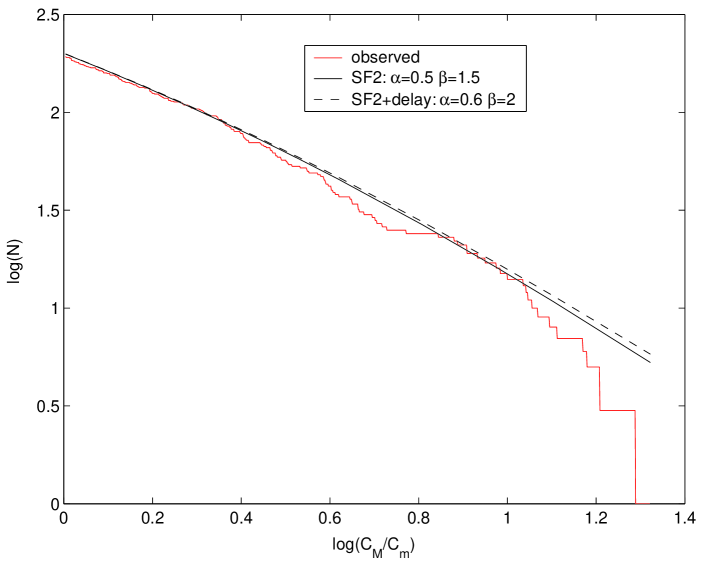
We find: ; and erg/sec. We also find that and are positively correlated, while and are negatively correlated: i.e. if we increase the absolute value of from 1.5 to 2, we should decrease from 0.5 to 0.3. The parameters found by Schmidt (2001) are within our 1- range.
The corresponding normalization yields a local rate of short GRBs per unit volume, Gpc-3yr-1, where we estimated the effective full-sky coverage of our GRB sample to be yr. The results obtained for the long bursts (GPW) - erg/sec, and Gpc-3yr-1 - are within the the range of 1 of the best fit values found for the short bursts. However we should remember that k-correction in these two cases is slightly different, as typically short bursts have harder spectra.
The total isotropic equivalent energy emitted during the burst can be estimated as , where is an “effective” duration of the short burst, which is given by the ratio of the fluence and the peak flux (Perna, Sari & Frail 2003, Nakar, Granot & Guetta 2004). In practice, varies from one burst to another. We estimated by considering both the peak fluxes (in photons/cm2/sec), averaged over the 64ms BATSE trigger, and the fluences in the 50-300keV energy band. We chose this energy band because the peak flux energy range is 50-300 keV, coinciding with the energy range of the nominal BATSE on-board burst trigger. In order to convert the peak fluxes to erg/cm2/sec we used the spectral photon index -1.1. Meanwhile is approximated by the ratio of the fluence and peak flux. To estimate the typical energy emitted in the 50-300 keV energy band we consider the average value of over all short bursts of the catalog and find sec, which implies erg.
The total bolometric energy emitted during the burst can be estimated by multiplying by the average value of the ratio of the fluences in the 20-2000 keV and 50-300 keV energy bands, . We find erg, which is a factor smaller than the corresponding value for the long bursts, erg, estimated in the same way (but averaging the peak fluxes over the 1024ms BATSE trigger, using the spectral photon index of -1.6 and ). For the sample of long bursts we find sec. Panaitescu, Kumar & Narayan (2001) suggest that the lower total isotropic energy of short GRB is the crucial reason their afterglow has not been detected so far (note that the early afterglow depends on the isotropic equivalent energy and not on the total energy). Their assumption (following Mukherjee et al., 1998) that the isotropic equivalent energy of short GRBs is smaller by a factor 20 than the energy of long GRBs is consistent with our results.
The best fit values of the parameters , and are insensitive to the choice of above a value mainly because GRBs with very low luminosity appear above the sensitivity limit of ph/cm2/sec only in a very small volume around the observer. The only parameter that changes with is the local rate, which clearly increases with increasing . However, this increase is meaningless as there is no evidence in the data that such weak bursts exist. Increasing also doesn’t affect our results since the LF decreases rapidly with luminosity and there are only a few bursts with very high luminosity, regardless of the exact value of . Fig. 1 and 2 compare the observed integrated and differential distributions with the predicted ones using the best fit parameters for the luminosity function.
We can now use the luminosity function to derive the expected redshift distribution of the observed bursts’ population in our model. Note that the observed bursts’ population depends on properties of the detector and is different from the intrinsic redshift distribution.
| (5) |
where is the luminosity corresponding to minimum peak flux for a burst at redshift z and . This minimal peak flux corresponds to the gamma-ray burst detector’s. In the case of BATSE ph/cm2/sec for short bursts, and ph/cm2/sec for long ones.
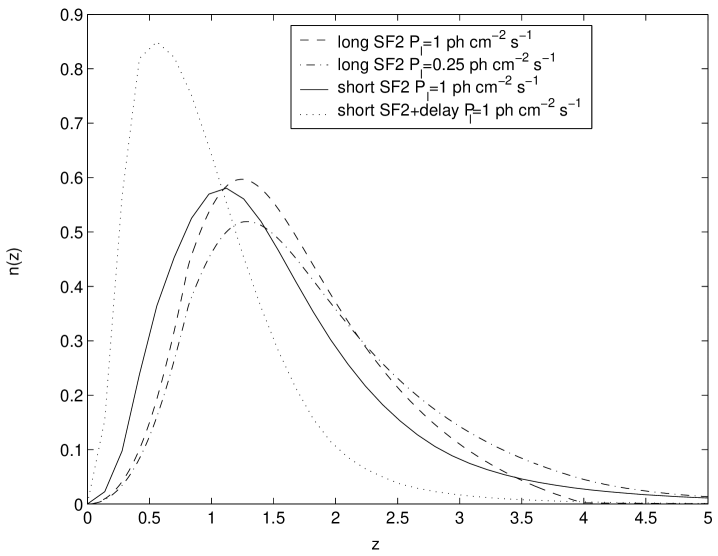
Fig. 3 shows the redshift distribution of long and short bursts under different assumptions. The dot-dashed line represents the long GRBs redshift distribution, assuming a SF2-SFR and considering the BATSE threshold for long bursts, ph/ cm2/sec. The solid line then depicts the short GRBs redshift distribution assuming a SF2 SFR and considering the BATSE threshold for short bursts ph/ cm2/sec while the dashed line represents the long GRBs redshift distribution assuming a SF2-SFR and considering the same BATSE threshold of the short bursts, ph/ cm2/sec.
From this figure it is clear that differences between long and short bursts in both the value and in the expected observed redshift distributions arise mostly from the differences in the threshold fluxes that trigger the BATSE detector. In fact if we consider the triggering of long GRBs on the 64 ms channel, thus reducing the effective sensitivity, we find , which is close to the short bursts’ value. When the difference in threshold is taken into account we find that long bursts are detected up to higher redshifts as is evident from Fig. 3. The effect of the different thresholds is much stronger than the differences in the typical peak luminosities and spectra between short and long bursts, which also contribute, albeit at a smaller amount, to the difference.
4 NS-NS mergers as short GRBs progenitors
There are several reasons to think that short GRBs may be linked to binary neutron star mergers (see e.g. Narayan, Piran & Kumar 2001). In such a case the short GRB rate is given by the convolution of the star formation rate with the distribution of the merging time of the binary system (Piran 1992, Ando 2004):
| (6) |
The merging time distribution strongly depends on the distribution of the initial orbital separation between the two stars and the distribution of initial eccentricities. Both are unknown. Champion et al. (2004) provide a list of known relativistic binary pulsar systems and their orbital parameters. Six of these objects are classified as double neutron star binaries, while the nature of a seventh pulsar system, PSR J1829+2456, still needs to be clarified. They also list coalescence times due to gravitational radiation emission for each system (see Fig.4). From the coalescence time distribution it seems that const, implying , in agreement with the suggestion by Piran (1992). Note, however, that selection effects that have to do with the difficulty of detecting binary pulsars in close orbit, due to the large and rapid varying Doppler shift, may significantly affect the short time distribution below a few hundred million years.
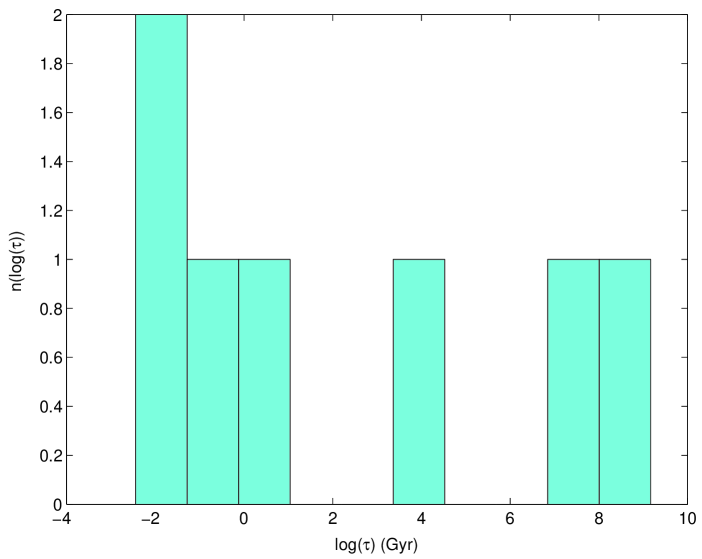
The binaries listed in Champion et al. (2004) span a wide range of orbital parameters but can be broadly split into two groups that will or will not coalesce within a Hubble time, with PSR J1829+2456 ( Gyr) lying at the border between these two groups. It is clear that the binaries not merging within a Hubble time will not affect neither the double neutron star merger rate calculations (Kalogera et al. 2004) nor our analysis of the luminosity function and redshift distribution. We are aware that the sample is too small to make predictive conclusions about ; on the other hand, it is the best one can do at present.
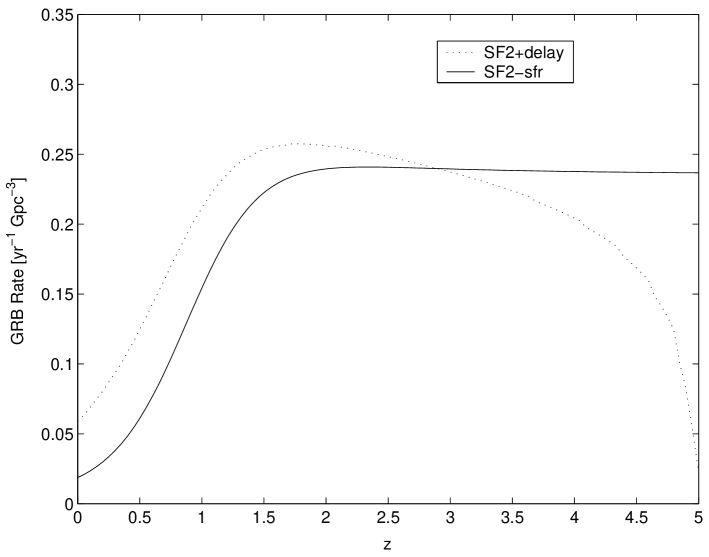
In Fig. 5 we show the short GRB rate density as a function of redshift due to binary neutron star mergers estimated using Eq. (6). The merging time delay increases the number of both mergers and of short bursts at low redshifts. This is also evident from the differential redshift distribution depicted in Fig. 3, which shows that the observed redshift distribution of short GRBs is closer than the long one when the delay is taken into account.
We repeated our analysis on the best fit parameters of the luminosity function using the corrected rate and found , and erg/sec, which is slightly lower than the typical luminosity found for the long bursts and lower than the typical value found in the case where short bursts follow the SF2-SFR. This is expected in case where the intrinsic distribution is nearer, and hence weaker pulses are needed. In such cases the typical isotropic-equivalent energy erg is a factor smaller than the energy in the long bursts. The results of this fit are shown in Figs. 1 and 2. Assuming that short GRBs are related to neutron star mergers and that in turn the rate of mergers follows the SFR with a delay probability , the local rate of short GRBs is /Gpc3/yr. This rate is a factor four larger than the local rate of long GRBs as inferred from the analysis of GPW, and a factor of eight larger than the value found in the case that short bursts follow the SF2-SFR.
It is interesting to compare this rate with the observationally inferred rate of NS-NS mergers in our galaxy (Phinney, 1992, Narayan, Piran & Shemi 1992). This rate was recently reevaluated after the discovery of PSR J1829+2456 to be rather large as /Myr, although the estimate contains a fair amount of uncertainty (Kalogera et al. 2004). If we assume that this rate is typical and that the number density of galaxies is /Mpc3, we find a merger rate of /Gpc3/yr. This value is significantly larger, by a factor of , than our estimate of the local rate of short GRB, /Gpc3/yr.
If this factor arises due to beaming, it implies that short GRBs are beamed into very narrow jets. Assuming that all the neutron star binary mergers produce a short GRB, we can estimate the average opening angle of the jet using this ratio to be . The typical beaming factor we find here is a factor 20 larger (narrower beams) than the one found for long GRBs (GPW). The corresponding typical total energy (corrected for beaming) of short GRBs is erg, which is smaller by 2 orders of magnitude than the total energy of long GRBs.
These estimates are based on our estimate that ; however, those selection effects that may affect the time distribution are important for small (at 100 Myr and lower). For this reason we also consider the extreme case in which most binary merger on a shorter time scale and there is no delay between formation and merging of the binary system. In this case if we compare the short GRB rate Gpc-3yr-1 with the local merger rate (even higher under this assumption), we find a very narrow jet opening angles . These beaming angles imply that the typical total energy of short GRBs is erg, more than three orders of magnitude smaller than the typical energy of long GRBs.
It is possible, of course, that every neutron star merger does not necessarily produce a GRB or that most mergers produce weak GRBs that are below the BATSE threshold, in which case the typical jet opening angle and the total energy will be larger. It is also possible that short GRBs are produced by black hole neutron star mergers whose rate might be lower than the rate of neutron star mergers, again leading to larger jet opening angles. It is even possible that we currently overestimate the rate of neutron star mergers. After all, this rate is dominated by a single object PSR J1829+2456. Prior to its discovery the estimates of the merger rate were lower by one order of magnitude (Kalogera 2004).
Still, it is worthwhile considering the implications of this result, if indeed it is correct. First, we note that the narrow beaming angles that we find, are almost the minimal allowed, as they are comparable to the inverse of a typical Lorentz factor of a few hundreds. This implies, first of all, that we should see a significant number of short burst ”sideways”. Such bursts will be weaker and have a softer spectrum, but their duration will remain the same. A more detailed study is required to determine if these are consistent or not with the current hard short GRB population. Second, this implies that the energy budget of short GRBs is much smaller than that of long GRBs. One could easily imagine several mechanisms in which neutron star mergers would release ergs in gamma-rays (see Rosswog & Ramirez-Ruiz, 2002). Third, these narrow jet opening angles would lead both to jet breaks taking place a few minutes after the burst and to a rapid subsequent decrease in the afterglow light curve. This might be yet another reason, combined with the low isotropic equivalent energy, for short GRB afterglows being not detected so far.
5 Conclusions
This work presents the results of our derivation of the luminosity function and the observed redshift distribution of short GRBs by fitting the peak flux distribution taken from BATSE, and shows that when the same intrinsic redshift distribution is assumed for long and short bursts (SFR), the luminosity function of short GRBs is comparable to that of long GRBs. Their isotropic equivalent energy is lower by a factor of 20 (SFR) or 40 (SFR+delay) due to their shorter duration. Difference in the values and the corresponding difference in observed redshift distributions simply reflect the different BATSE thresholds in the 1024msec and 64msec channels on which long and short bursts are triggered respectively. Even if the long and the short GRBs have slightly different typical luminosities and spectra, the main effect on the observed redshift distribution arises from the different threshold fluxes at which the two populations are detected.
We repeated our analysis assuming that short GRBs are associated with binary neutron star mergers. In this case a delay is expected between the star formation rate and the merger rate. We estimated the merging time distribution from the data of Champion et al. (2004) (in spite of the small number of objects that are available in this data). Naturally, the effect of the delay on the observed redshift distribution is to increase the number of short bursts at low redshift and to decreases their typical luminosity. Once we compare the local rate of short GRBs obtained from our analysis with the local coalescence rate of the binary neutron star systems in the galaxy we find, assuming that all neutron star binary mergers produce a short GRB, a typical jet opening angle that ranges between and . This corresponds to jets that are narrower, on average by a factor of (in ) than typical jets of long GRBs. The corresponding total energy emitted in this bursts is erg (SFR) or erg (SFR+delay), two or three orders of magnitude below the typical energy emitted in long GRBs. In the extreme case of no delay between the binary star formation and the merger we obtain even narrower jets and smaller energies.
The research was supported by the RTN “GRBs - Enigma and a Tool” a grant from the Israeli Space Agency - SELA.
References
- (1) Ando, S., 2004, Journal of Cosmology and Astroparticle Physics, Issue 06, pp. 007.
- (2) Champion et al., 2004, MNRAS 350, L61.
- (3) Cohen E., Piran T., 1995, ApJ, 444, L25
- (4) Dezalay, J. P. et al., 1996, ApJ 471, L27.
- (5) Eichler, D., Livio, M., Piran, T., Schramm, D., 1989, Nature, 340, 126
- (6) Gandolfi, G., et al. 2000, in AIP Conf. Proc. 526, Gamma-Ray Bursts, ed. R. M. Kippen, R. S. Mallozzi, & G. J. Fishman (New York: AIP), 23.
- (7) Guetta, D., Piran, T. & Waxman E., astro-ph/0311488, ApJ in press. (GPW).
- (8) Kalogera, V. et al., 2004, ApJ 603, L41, erattum, 2004, ApJ. 614, L137.
- (9) Katz, J. I. & Canel, M., 1996, ApJ 471, 915.
- (10) Kouveliotou, C. et al., 1993, ApJ 413, L101.
- (11) Kouveliotou, C. et al., 1996, in Gamma-ray bursts, Proceedings of the 3rd Huntsville Symposium. AIP Conference proceedings series, 1996, vol. 384, edited by Kouveliotou et al., ISBN: 156966859, p.42.
- (12) Mao, S., Narayan, R. & Piran, T., 1994, ApJ 420, 171.
- (13) Mukherjee, S. et al., 1998, ApJ 508, 314.
- (14) Nakar, E. & Piran, T., 2002, MNRAS 330, 920.
- (15) Nakar, E., Granot, J. & Guetta, D., 2004, ApJ 606, L37.
- (16) Narayan, R., Piran, T. & Kumar, P., 2001, ApJ 557, 949.
- (17) Paciesas et al., 1999, ApJ. Supp. 122, 465.
- (18) Panaitescu, A.,Kumar, P. & Narayan, R., 2001, ApJ 561, L171.
- (19) Perna, R., Sari, R. & Frail, D., 2003, ApJ 594, 379.
- (20) Piran, T., 1992, ApJ 389, L45.
- (21) Porciani, C., and Madau, P., 2001, ApJ 548, 522.
- (22) Qin, Y. et al., 2000, Publ. Astron. Soc. Japan 52, 759.
- (23) Rosswog, S. & Ramirez-Ruiz, E., 2002, MNRAS 336, L7.
- (24) Schmidt, M., 2001, ApJ 559, L79.
- (25) Tavani, M., 1998, ApJ 497, L21.