A first-overtone RR Lyrae star with cyclic period changes††thanks: Based in part on the observations obtained with the 1.3 m Warsaw telescope at Las Campanas Observatory of the Carnegie Institution of Washington.
Abstract
A detailed light curve analysis is presented for a first-overtone RR Lyrae star, MACHO* J050918.712695015.31, based on MACHO and OGLE-III observations. As a foreground object of the Large Magellanic Cloud, it gives an extraordinary opportunity to study an almost continuous, 12-year long dataset of a relatively bright () RRc star with rapid period change. Cyclic period modulation is suggested by the method, where the cycle length is about 8 years. With the available unique dataset, we could draw strong limits on other light curve changes that may be associated to the period modulation. We could exclude both multiple periodicity and amplitude modulation unambiguously. Any theoretical model should reproduce the observed lack of photometric modulations. Simple arguments are also given for possible hydromagnetic effects.
keywords:
stars: variables: RR Lyrae – stars: individual: MACHO* J050918.712695015.311 Introduction
Period changes in RR Lyrae stars have been an intriguing issue since the discovery of this phenomenon (Bailey 1913, Prager 1939). Numerous studies have been carried out for RR Lyrae stars in globular clusters (e.g., Szeidl 1975, Wehlau et al. 1992, Rathbun & Smith 1997, Jurcsik et al. 2001) and in the galactic field (see a collection of field stars in Firmanyuk 1976, 1982, and a recent re-analysis of a particular object by Jurcsik et al. 2002). Stellar evolution is expected to cause very slow continuous changes in period (Lee 1991, Cox 1998), but the observations tend to reveal abrupt and/or cyclic changes that are too fast to be explained in this way. The Blazhko effect (Blazhko 1907), which refers to amplitude modulation in RR Lyrae stars, does not yet have a generally accepted explanation (Chadid et al. 2004) and is also known to be associated with period modulations. To make the overall picture even more complicated, Paparó et al. (1998) found opposite period changes in the modes of two double-mode RR Lyrae stars in M15. A number of theoretical studies have attempted to explain period changes in RR Lyrae stars with various mechanisms, such as mixing events in the semiconvective zone (Sweigart & Renzini 1979). Good reviews can be found in Rathbun and Smith (1997) and Smith (1995, 1997). Understanding these period variations remain an important unsolved problem in the stellar pulsation theory (Alcock et al. 2000).
Globular clusters that are rich in RR Lyrae variables offer a good opportunity to study period changes. For example, Rathbun & Smith (1997) studied the period changes of RR Lyrae variables in seven globular clusters by collecting all data in the literature over 50 years. They found that the rates of period changes of fundamental-mode RR Lyrae (RRab) stars are usually larger than those of first-overtone (RRc) and double-mode (RRd) variables. However, they concluded that current theories did not explain the irregular period changes. More recently, Jurcsik et al. (2001) presented an analysis of the RR Lyrae variables of Centauri. They studied diagrams of altogether 126 RRab, RRc and RR Lyrae-like stars and found that the period changes of most RRab were in good agreement with the evolutionary model predictions, but those of the first-overtone RRc-type stars showed a much more complex, irregular behaviour (Jurcsik et al. 2001).
Despite the great value of cluster RR Lyrae stars, no one has ever followed a cluster continuously with the same instrument for many years or decades. The essentially random samples over many decades with various instruments do not provide a homogeneous view of the period changes of RR Lyrae variables. The situation changed in the early 1990s, when microlensing projects started monitoring the sky towards the Large and Small Magellanic Cloud and the Galactic Bulge, providing continuous photometric observations of millions of stars during several years. Of these, MACHO and OGLE projects had the best coverage. These data present a great opportunity for investigating period changes of RR Lyrae stars. Alcock et al. (2000, 2004) analysed MACHO light curves for more than 1000 RRc stars and found that 10% showed strong period changes, whose strength and patterns excluded simple evolutionary explanations. Meanwhile, Soszyński et al. (2003) compiled a more complete catalog of 7600 RR Lyrae stars in the LMC based on the OGLE-II observations. It remains for a future study to combine these two sources of data for examining period changes over a longer time base.
Although a large amount of data is available for the RR Lyrae stars in the Large Magellanic Cloud, there is a major drawback with these stars: they are very faint at the distance of the LMC (). Hence, the signal-to-noise ratio (S/N) of the MACHO observations for the LMC RR Lyrae stars is very low (Alcock et al. 2000) and neither light curve parameters nor their changes can be determined accurately. Although OGLE-II RR Lyrae observations have higher S/N ratio due to better seeing and more advanced photometric reductions technique, they were carried out over a shorter time span and with only a single filter. These problems could be circumvented if we found suitably bright foreground stars in the MACHO and OGLE databases. During an analysis of more than 6000 MACHO variable stars (Derekas et al. in prep.), we noticed MACHO* J050918.712695015.31 (hereafter M050969), an RR Lyrae star with intriguing period changes. At magnitude , period and amplitude , this star offers a unique opportunity, because of its high S/N ( in the MACHO data and in the OGLE-III data) light curve, for analysing the correlation between period changes and light curve shape variations. This is expected to tell us something about the physical mechanism causing the modulations. We note that M050969 was also included in the study of Alcock et al. (1997), who discussed 20 foreground RR Lyrae stars towards the LMC and noticed the changing period of this star.
The main aim of this work is to demonstrate the period modulation of M050969, and show that it is not accompanied by any variations in amplitude or light curve shape. Our study exploits the homogeneity, the continuity and the 12-year long time span of the combined MACHO and OGLE-III CCD observations. In Sect. 2 we describe the data and their basic analysis. We show several pieces of evidence for pure period modulation of M050969 in Sect. 3. Finally, we briefly discuss possible mechanisms in Sect. 4.
2 Initial data analysis
Our attention was drawn to this star during an on-going study of MACHO variable stars, that are classified as eclipsing binaries in the on-line MACHO Variable Star Catalog. The MACHO observations were obtained between June 1992 and January 2000, with the 50 inch telescope at Mt. Stromlo Observatory using a two-channel system (Hart et al. 1996). Two-colour data in the specifically designed MACHO blue () and MACHO red () bands are publicly available at the MACHO website111http://wwwmacho.mcmaster.ca/. Stars have been classified by an automatic software and we downloaded individually every target, 6837 in total. However, it became obvious very quickly that the classification was not perfect, as large fraction of “eclipsing binaries” was found to be Cepheids, RR Lyrae stars or long-period variables. We therefore decided to re-classify all stars and during this procedure we noted the peculiar light curve of M050969. Whereas the period and amplitude unambiguously place this star among the first-overtone RR Lyraes (Poretti 2001), the light curve showed enormous phase modulations.
In light of the strange behavior of M050969 in the MACHO data, we decided to supplement them with OGLE observations. Unfortunately, this object is located outside the fields covered during the second phase of the OGLE project (Udalski et al. 1997) so that OGLE-II photometry from 1997–2000 is not available. However, this field was covered in the OGLE-III phase, which started in June 2001, and the star is continuously monitored up to now. Thus the gap between the MACHO and OGLE-III observations is only 621 days. The OGLE observations were obtained with the 1.3 m Warsaw telescope located at Las Campanas Observatory, Chile, which is operated by the Carnegie Institution of Washington, equipped with pixel mosaic camera. Photometry was derived with the standard OGLE data pipeline based on DIA image subtraction technique (Udalski 2003). Observations were done through -band filter.
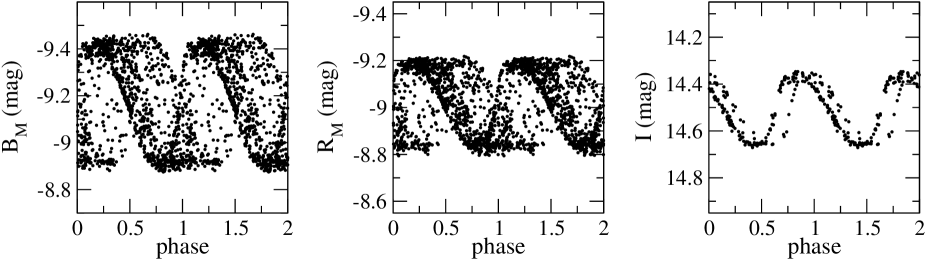
As the first step of the analysis of M050969, we searched for the period using the Phase Dispersion Minimization method (Stellingwerf 1978), then we refined that period using the String Length method (Lafler & Kinman 1965, Clarke 2002). The phase diagram with the finally adopted period (Sect. 3.2) is plotted in Fig. 1. Both the phase diagram and random checks of short subsets suggested a strong period modulation, so we therefore determined epochs of maximum light to construct the classical diagram. To this, we divided the whole dataset into 50-day long subsets, which did not show any noticeable phase shift. Then we phased each subset with the period given by the String Length method (0.32806 days). When there were too few points within 50 days, then we used 100-day long subsets. The best of these phase diagrams was fitted with a fourth-order Fourier-polynomial. This polynomial was used as a master curve – allowing both vertical and horizontal shifts to fit every other phase diagram. The same procedure was applied for the OGLE-III data. From the resulting phase shifts, the period and the epochs of each phase diagram, we calculated the times of maximum light, listed in Table 1. Typical uncertainties are about 0.001–0.0015 days.
Finally, we note that downloadable MACHO data are in Modified Julian Date, so that we had to add 0.5 days to all epochs of maximum.
| filter | filter | ||
|---|---|---|---|
| 2448885.1603 | 2449937.4734 | ||
| 48885.1712 | 50037.2174 | ||
| 48948.1480 | 50039.1748 | ||
| 48950.1030 | 50139.2403 | ||
| 48997.0187 | 50139.2513 | ||
| 49001.2712 | 50241.9485 | ||
| 49045.2343 | 50243.9034 | ||
| 49050.1431 | 50342.3490 | ||
| 49095.0899 | 50349.2265 | ||
| 49099.9961 | 50436.1742 | ||
| 49146.9115 | 50446.3549 | ||
| 49152.4765 | 50543.1468 | ||
| 49197.4241 | 50547.0712 | ||
| 49200.3659 | 50649.4351 | ||
| 49253.1684 | 50653.3818 | ||
| 49253.1796 | 50749.4961 | ||
| 49292.5371 | 50749.5064 | ||
| 49303.3733 | 50850.2163 | ||
| 49397.1685 | 50850.2268 | ||
| 49397.1801 | 50955.2051 | ||
| 49447.0279 | 51034.5776 | ||
| 49452.2878 | 51074.6031 | ||
| 49497.2208 | 51120.1905 | ||
| 49497.5391 | 51181.5408 | ||
| 49547.4005 | 51290.1142 | ||
| 49551.3507 | 51317.9810 | ||
| 49597.2600 | 51394.4042 | ||
| 49599.2387 | 51432.4460 | ||
| 49648.4325 | 51502.3273 | ||
| 49652.3801 | 51516.0922 | ||
| 49697.3256 | 52227.1610 | I | |
| 49699.2805 | 52333.7701 | I | |
| 49749.1449 | 52578.8074 | I | |
| 49752.1087 | 52667.7100 | I | |
| 49834.1273 | 52895.0690 | I | |
| 49836.0847 | 52995.7926 | I | |
| 49936.4784 |
3 Results
3.1 Multiple periodicity
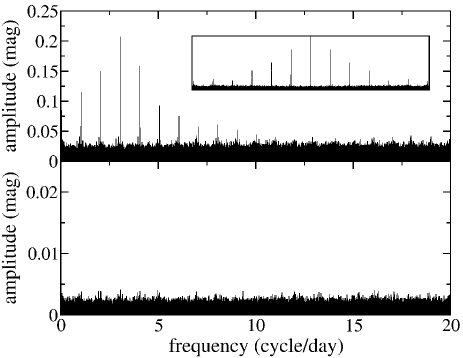
We examined the possibility of multiple periodicity in the MACHO blue-band light curve of M050969. We chose this set because of the higher amplitude, thus better S/N. The frequency analysis was carried out by standard Fourier-analysis using Period98 of Sperl (1998). The calculated amplitude spectrum is shown in the top panel of Fig. 2. The main peak at is in very good agreement with the result by the String Length method (). Usual prewhitening steps resulted in the same behaviour as the one found for RR1-PC-type stars by Alcock et al. (2000): the prewhitened frequency spectrum contained significant remnant power very close to the main component. As was shown in Alcock et al. (2000), this can be attributed to long-term period and/or amplitude change. Since the procedure of determining epochs of maximum proved the stability of the amplitude (i.e. every phase diagram could be fitted very well with the master curve), we checked for the presence of multiple periodicity in two different ways. Firstly, we did regular prewhitening in the best three 50-day long subsets to check the residual frequency spectra for any significant peak unrelated to the pulsational frequency. For that reason, we fitted and subtracted not only , but , and from the subsets. None of the residual spectra contained a significant peak other than , after which we could not find anything else.
Secondly, we subtracted individually fitted Fourier-polynomials from every subset in form of
| (1) |
where the amplitudes and phases were fitted with Period 98. After subtracting each polynomial, we re-united the residual light curves and calculated the frequency spectrum of the whole set. As expected from the asymmetric shape of the mean light curve, we detected only and with amplitudes of and . After subtracting these two frequencies, the S/N ratios (Breger et al. 1993) of the next three peaks were about 4, close to the limit of significance. We could identify these frequencies as close remnants of the primary peak and its harmonics or daily aliases. Finally, we arrived at pure white noise (bottom panel in Fig. 2), confirming the monoperiodic nature of M050969. Similar results were given by the red data too, but their S/N is lower than that of the blue data, which we preferred in our analysis.
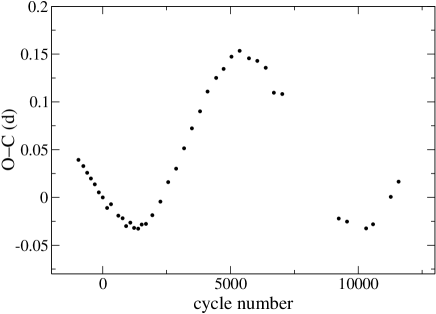
3.2 The OC diagram
Having excluded multiple periodicity, the diagram was made from the times of maxima in Table 1.Initially, we used the period given by the String Length method, with the following ephemeris: . It showed very clear cyclic period changes without colour dependence (i.e. the blue and the red points drew the same curve).
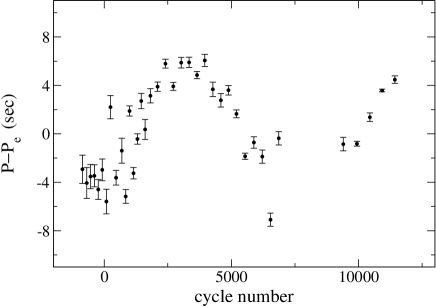
There is a well-known problem with the method: although it is a very effective tool to detect tiny period changes, the shape of the diagram strongly depends on the period used in the calculation. Moreover, it can be discontinuous after long periods, so that we analysed the diagram using the continuous method suggested by Kalimeris et al. (1994). In this approach, both the period and its rate of change are continuous functions of time. Rather than using various assumptions on period change (e.g. assuming constant change of period and thus fitting parabola to the ; or fitting straight lines to selected parts of the ), we determined the “instantaneous” periods from every neighbouring pair of subsets, simply as the local derivative of the plot plus the period used in the ephemeris (). The difference between the “instantaneous” period and is plotted in the bottom panel of Fig. 3. As can be seen here, the period change is enormous: the difference between the longest and the shortest period is about 12 seconds; in other words, the relative period change is !
The use of the “instantaneous” period has a further advantage: this way we can combine MACHO and OGLE-III data without involving systematic phase shift between the and bands. We checked several foreground RR Lyraes with simultaneous MACHO and OGLE-II observations (Zebrun et al. 2001) and found that I-band maxima are usually within 0.010.03 in phase relative to -band maxima. With the “instantaneous” period, even this small effect is eliminated.
Finally, we corrected the period by assuming that the time-span of the combined MACHO+OGLE-III data is long enough to average out the period modulation. In other words, we searched that period which resulted in zero mean period difference in the bottom panel of Fig. 3. The resulting ephemeris is the following:
| (2) |
and the finally adopted diagram in the top panel of Fig. 3 was also calculated with this ephemeris.
3.3 Amplitude modulation
Some RR Lyrae stars show cycle-to-cycle changes in the shape of their light curves, which can be caused either by double-mode pulsation (in RRd stars) or the still-puzzling Blazhko-effect. Since double-mode pulsation was ruled out in Sect. 3.1, what remains to be checked is the possibility of amplitude modulation.
Although the master curve fitted very well all subsets, we wanted to examine quantitatively the possibility of light curve shape change. Therefore, we fitted fourth-order Fourier-polynomials to each subset using equation (1) at the primary frequency and its harmonics. Then we measured the light curve shapes with the Fourier parameters (Simon and Teays 1982), of which we show particular results for (these are the most accurate parameters). Fig. 4 shows the relative variations of and . The error bars are quite large (because the light curve is not too asymmetric, so that higher harmonics are fairly weak), but it is evident that there were no measurable shape changes.
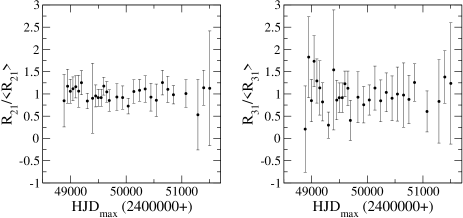
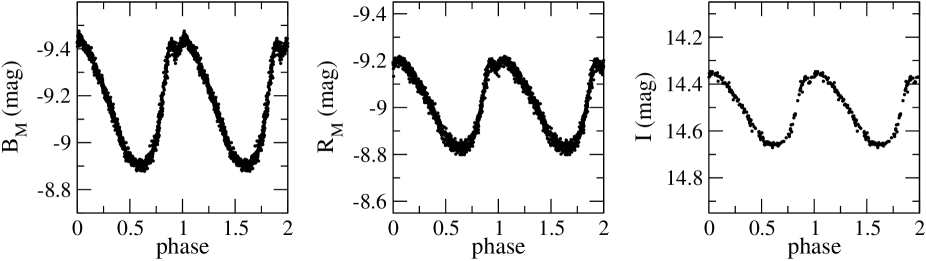
Since individual subsets rarely contained enough data points for determining accurate Fourier-parameters, we also examined the correlation between the period change and the light curve shape using five subsets around the minimum and five around maximum of the “instantaneous” period. Then we corrected these phase diagrams for any phase shifts to form high-quality, continuous phase diagrams representing the two extrema of the period. Then we fitted sixth-order Fourier polynomials to both phase diagrams and the resulting parameters are shown in Table 2. As can be seen, none of the Fourier-coefficients differs significantly for the two cases. This means that we could not detect any light curve change associated with the period variation. This conclusion is also supported by the phase diagram of the whole MACHO and OGLE-III datasets (Fig. 5), where we shifted every subset to match the master curve in phase. The well-defined shapes show no evidence for any additional variation in light curve shape.
| parameter | values at | values at |
|---|---|---|
| –9.165 0.003 | –9.168 0.001 | |
| –0.278 0.005 | –0.270 0.005 | |
| –0.046 0.004 | –0.044 0.005 | |
| 0.023 0.005 | 0.022 0.005 | |
| 0.024 0.004 | 0.016 0.005 | |
| –0.017 0.005 | –0.010 0.005 | |
| –0.015 0.004 | –0.008 0.005 | |
| 1.249 0.016 | 1.251 0.018 | |
| –3.780 0.104 | –3.639 0.112 | |
| 0.602 0.182 | 0.492 0.228 | |
| 2.007 0.199 | 2.303 0.312 | |
| –0.181 0.256 | –0.313 0.476 | |
| 0.332 0.324 | 0.155 0.580 |
4 Discussion
It is obvious from Fig. 3 that the period change seems to be cyclic, which implies there must be some (quasi)periodic mechanism affecting the pulsation. The shape of the curve in the bottom panel of Fig. 3 is largely independent of the period used for the diagram (provided that it is close to the real mean period), so that the observed change cannot be explained by some numerical artifact caused by a wrong period in the ephemeris.
As a first possibility, we consider light-time effect (LITE) due to orbital motion in a binary system. Although it was suggested for several RR Lyrae stars that their cyclic diagrams were caused by LITE, so far this was supported by spectroscopic observations only for TU UMa (Wade et al. 1999). For M050969, the half-amplitude of the in Fig. 3 is A(OC)=0.09 d, while the time separation of the two minimum is 2900 d. Assuming that , the estimated semi-major axis is about AU. Given =2900 d 7.95 yr; the minimum mass of the system would be almost .
Although there are models that predict the existence of detached black hole binaries with M⊙ and M⊙ (see, e.g., Table 1 in Podsiadlowski et al. 2003), the secondary components in these theoretical systems are not expected to follow the evolution of “normal” stars with the same masses. This is because they are descendants of more massive progenitor stars that transferred most of their masses to the black hole primaries (but models also predict that they can evolve through the classical instability strip, even becoming “RR Lyrae-like” variables). In principle, we cannot exclude this possibility until it is checked by spectroscopy (any sign of orbital motion should be relatively easily detectable spectroscopically even at mag), although seems extraordinary large. Also, the high occurrence rate of strong period changes in RR Lyrae stars argues against this exotic explanation.
Stellar evolution can be safely excluded, since both the strength and the cyclic nature of the period change exceed theoretical expectations by orders of magnitudes (Smith 1995).
Another interesting possibility is related to hypothetic hydromagnetism. Stothers (1980) argued that RR Lyrae stars may be considered as fair analogues of the Sun. He proposed that radius changes may be driven by some sort of magnetic activity, which in turn would cause observable period changes. The correlation between the frequency changes and the magnetic variations was confirmed by Howe et al. (2002), who performed a detailed study on the solar cycle frequency shifts in global -modes of the Sun. They found that the latitudinal distributions of the frequency shifts shows close temporal and spatial correlation with the unsigned surface magnetic flux.
In our case we can calculate the radius change of M050969 from the period-density relation, i.e. . Substituting the values determined from the bottom panel in Fig. 3, it follows:
| (3) |
Note that this equation is an approximation that omits a term that contains the magnetic energy (see Stothers 1980).
Very recently, Noël (2004) presented an analysis of 13 years of apparent radius measurements of the Sun. Interestingly, he found a correlation between the solar radius variation and the sunspot numbers, related to the solar magnetic activity. Based on the data in his fig. 5, the relative change of the solar radius was about . Assuming that RR Lyrae stars can show solar-like magnetic activity cycles, these two similar relative radius changes seem to support the hypothetic hydromagnetic period change.
We know little about the presence of magnetic fields in RR Lyrae stars. Most recently, Chadid et al. (2004) presented high-precision longitudinal magnetic field measurements of RR Lyrae itself taken over 4 years. Their results provided no evidence for a strong magnetic field in the photosphere of this star, which was often postulated in various explanations for the Blazhko effect (see, e.g., Jurcsik et al. 2002). If the period change in M0509–69 is indeed caused by solar-type magnetic activity, this field might be quite difficult to detect observationally. In fact, the only Blazhko-related phenomena that have been detected so far seem to be small line-profile variations (possibly related to non-linear pulsations; Chadid et al. 1999, Chadid 2000) and even these are only detectable with high S/N high-resolution spectra.
Although the effects of hydromagnetism on pulsating stars are not well understood, we conclude that the Stothers-mechanism can perhaps explain the pure period modulation of M050969. However, new theoretical investigations are necessary to interpret this observed behaviour. Detailed models should also address the absence of any light curve shape change and multiple periodicity.
Acknowledgments
This work has been supported by the FKFP Grant 0010/2001, OTKA Grant #T042509 and the Australian Research Council. AD is supported by the International Postgraduate Research Scholarship (IPRS) programme of the Australian Department of Education, Science and Training. Partial support to the OGLE project was provided with the Polish KBN grant 2P03D02124, NSF grant AST-0204908 and NASA grant NAG5-12212. The NASA ADS Abstract Service was used to access data and references. This paper utilizes public domain data obtained by the MACHO Project, jointly funded by the US Department of Energy through the University of California, Lawrence Livermore National Laboratory under contract No. W-7405-Eng-48, by the National Science Foundation through the Center for Particle Astrophysics of the University of California under cooperative agreement AST-8809616, and by the Mount Stromlo and Siding Spring Observatory, part of the Australian National University.
References
- [] Alcock, C., et al., 1997, ApJ, 490, L59
- [] Alcock, C., et al., 2000, ApJ, 542, 257
- [] Alcock, C., et al., 2004, AJ, 127, 334
- [] Bailey, S. I., 1913, Annals of Harv. Coll. Observ., 78, 1
- [] Blazhko, S. N., 1907, Astr. Nachr., 175, 325
- [] Breger, M., et al., 1993, A&A, 271, 482
- [] Chadid, M., 2000, A&A, 359, 991
- [] Chadid, M., Kolenberg, K., Aerts, C., & Gillet, D., 1999, A&A, 352, 201
- [] Chadid, M., Wade, G. A., Shorlin, S. L. S., & Landstreet, J. D., 2004, A&A, 413, 1087
- [] Clarke, D., 2002, A&A, 386, 763
- [] Cox, A. N., 1998, ApJ, 496, 246
- [] Firmanyuk, B. N., 1976, IBVS, No. 1152
- [] Firmanyuk, B. N., 1982, IBVS, No. 2247
- [] Hart, J., et al., 1996, PASP, 108, 220
- [] Howe, R., Komm, R. W., & Hill, F., 2002, ApJ, 580, 1172
- [] Jurcsik, J., Clement, C., Geyer, E. H., & Domsa, I., 2001, AJ, 121, 951
- [] Jurcsik, J., Benkő, J. M., & Szeidl, B., 2002, A&A, 396, 539
- [] Kalimeris, A., Rovithis-Livaniou, H., & Rovithis, P., 1994, A&A, 282, 775
- [] Lafler, J., & Kinman, T. D., 1965, ApJ, 11, 216
- [] Lee, Y. W., 1991, ApJ, 367, 524
- [] Noël, F., 2004, A&A, 413, 725
- [] Paparó, M., Saad, S. M., Szeidl, B., Kolláth, Z., Abu Elazm, M. S., & Sharaf, M. A., 1998, A&A, 332, 102
- [] Podsiadlowski, P., Rappaport, S., & Han, Z., 2003, MNRAS, 341, 385
- [] Poretti, E., 2001, A&A, 371, 986
- [] Prager, R., 1939, Harv. Coll. Observ. Bull., No. 911, 1
- [] Rathbun, P., & Smith, H., 1997, PASP, 109, 1128
- [] Simon, N. R., & Teays, T. J., 1982, ApJ, 261, 586
- [] Smith, H. A., 1995, RR Lyrae Stars, Cambridge University Press
- [] Smith, H. A., 1997, Balt. Astr., 6, 89
- [] Soszyński, I., et al., 2003, Acta Astron., 53, 93
- [] Sperl, M., 1998, Comm. Astr. Seis., 111
- [] Stellingwerf, R. F., 1978, ApJ, 224, 953
- [] Stothers, R., 1980, PASP, 92, 475
- [] Sweigart, A. V., & Renzini, A., 1979, A&A, 71, 66
- [] Szeidl, B., 1975, IAUS, 67, 545
- [] Udalski, A., 2003, Acta Astron., 53, 291
- [] Udalski, A., Kubiak, M., & Szymański, M., 1997, Acta Astron., 47, 319
- [] Wade, R. A., Donley, J., Fried, R., White, R. E., & Saha, A. 1999, AJ, 118, 2442
- [] Wehlau, A., Nemec, J. M., Hanlan, P., & Rich, R. M., 1992, AJ, 103,1583
- [] Zebrun, K., et al., 2001, Acta Astron., 51, 317