H2O Masers in W49 North and Sagittarius B2
Abstract
Using the Very Large Array (VLA) of the National Radio Astronomy Observatory in the A and B configurations, we have obtained simultaneous high resolution observations of both the 22 GHz H2O maser lines as well as the 22 GHz continuum for the H ii regions W49N and Sagittarius B2. The angular resolution of both observations is 01, which at the distance of W49N (11.4 kpc; Gwinn, Moran, & Reid 1992) and Sgr B2 (8.5 kpc) corresponds to a physical size of 1000 AU in both sources. The velocity coverage for W49N is 435 km s-1; positions for 316 H2O maser components were obtained. The velocity coverage for Sgr B2 is -40 to +120 km s-1; positions for 68 maser components were determined in Sgr B2 Main, 79 in Sgr B2 North , 14 in Sgr B2 Mid-North, and 17 in Sgr B2 South, for a total of 178 H2O maser positions in Sgr B2.
The cross calibration scheme of Reid & Menten (1990, 1997) was used. Using this procedure, high dynamic range continuum images were obtained with accurate registration (001) of the continuum and maser positions. A detailed comparison between H ii components and maser positions for both Sgr B2 and W49N is presented. In Sgr B2 Main, the H2O masers are predominantly located at the outside edge of the high-frequency continuum, lending support to the proposal that entrainment by stellar winds may play an important role in H2O maser emission.
1 Introduction
H2O masers have long been known to be signposts of active star formation and regions of extremely dense ( cm-3) gas. As such, they have proven to be very useful tools to study the dynamics and kinematics of the environment around young, massive stars, tracing high velocity outflows and shock fronts (Elitzur, 1995). Additionally, masers are extremely short-lived phenomena, and therefore pinpoint a precise period in a star’s evolution. In particular, H2O masers are often associated with ultra-compact (UC) H ii regions, the short-lived phase that can be associated with massive stars as they move towards the main sequence and produce UV photons which ionize the nearby gas (eg., Garay & Lizano 1999).
These observations focus on two well-known high mass star forming regions in our galaxy, W49A and Sgr B2. W49A has been studied extensively at radio wavelengths (eg., Mezger, Schraml, & Terzian 1967; Moran et al. 1973; Walker, Matsakis, & Garcia-Barreto 1982; Gwinn, Moran & Reid, 1992; DePree et al., 2000). Mezger et al. (1967) observed W49A to have two thermal components: A2, a small (diameter = 1 pc) high-density (n104 cm-3) source embedded in a second source, A1, which is larger (diameter = 14 pc) and lower density (n 200 cm-3). In their investigation, Mezger et al. (1967) pointed out that the high-density sources might surround O stars still embedded in their ionized dust cocoons. W49A has also been the subject of several investigations at infrared (IR) wavelengths. Conti & Blum (2002) have carried out near-infrared observations of the W49A region that indicate the presence of approximately 100 O stars. Alves & Homeier (2003) have also observed this region in the near-IR, and their J, H, and K band images indicate the presence of four star-forming clusters in W49A.
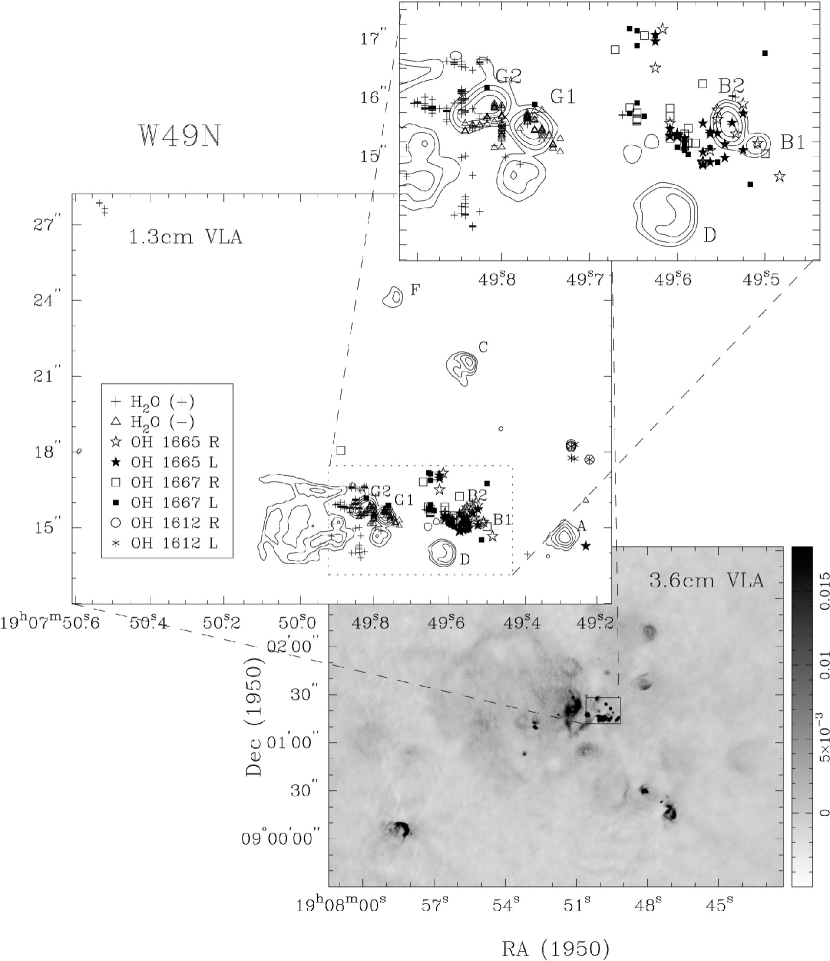
Located within W49A, the source W49N is composed of several compact and ultra-compact H ii regions in a ring formation spanning 20′′, or 1pc in diameter (e.g., DePree et al. 2000). Fig. 1 shows the 3.6 cm continuum image of the entire W49A complex with the H ii regions where maser activity is prominent (W49N) indicated. These regions are shown in more detail in the inset 1.3 cm continuum images. The H ii region G1/G2 is the main locus of water masers in W49N, along with a smaller cluster of H2O masers located near the H ii region B1/B2. The H2O maser velocity distribution in W49N is known to span at least 560 km s-1 (Walker et al., 1982), and is the most luminous source of H2O maser activity in the Galaxy.
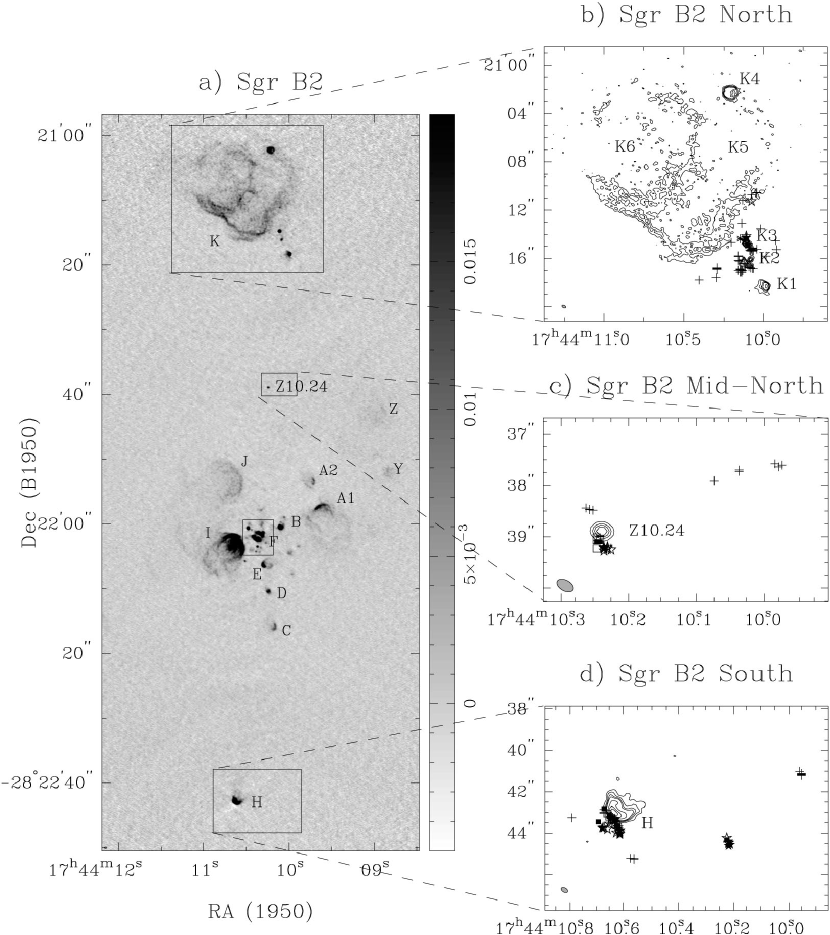
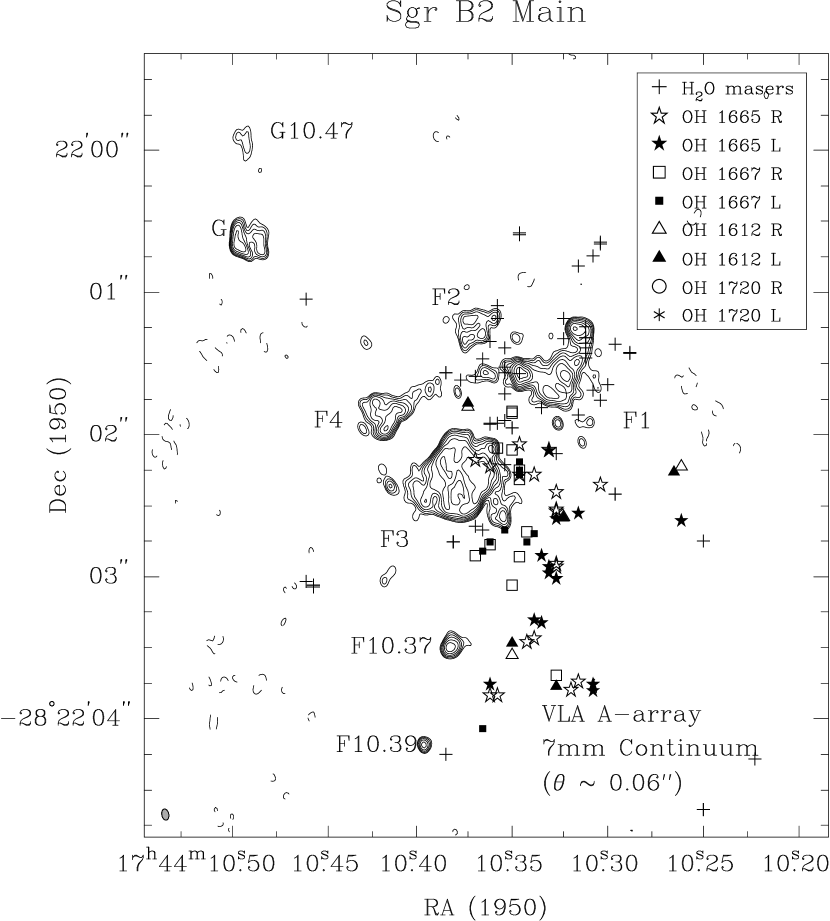
The Sgr B2 star-forming region and its ultra- and hyper-compact H ii regions have also been studied in great detail (eg., Gaume et al. 1995; DePree et al. 1995, 1996; DePree, Goss & Gaume 1998). A variety of morphologies are found among the H ii regions, including ring, shell, arc, and cometary structures. The entire Sgr B2 complex covers an area of 1 2′, or 2.5 5 pc (see Fig. 2), which consists of more than 49 H ii regions, 3 of which exhibit maser activity, and a fourth region that shows maser activity but no associated H ii region (Kobayashi et al., 1989). The K2 region in Sgr B2 North (Fig. 2b) is a region of strong H2O maser activity and is coincident with the dynamical center of molecular outflow (Lis et al. 1993). DePree et al. (1995) suggest that this source is similar to source F in Sgr B2 Main (Fig. 3), another region of intense H2O maser emission and bipolar molecular outflow (Lis et al. 1993; Mehringer, Goss, & Palmer 1995a). Additionally, age determinations suggest that the Sgr B2 Main complex of H ii regions and the molecular outflow are related (DePree et al. 1996). From observations of H110 and H2CO towards Sgr B2 North and Main, Mehringer et al. (1993, 1995b) find that Sgr B2 North is probably more distant, and suggest that two or more different events triggered star formation in each core, rather than a single global star formation event. Takagi et al. (2002) find strong X-ray sources located in Sgr B2 Main associated with the H ii regions F3 and I, as well as a weaker source near Sgr B2 North. The X-ray spectra and luminosities are consistent with emission arising from groups of young stellar objects (YSOs).
The study of H2O masers in high mass star forming regions has provided an important contribution to both observation and theory relating to YSO molecular outflows. Studies of water masers in W49 have been carried out with single dish antennas (Morris, 1976) and Very Long Baseline Interferometry (VLBI) (Moran et al., 1973; Walker et al., 1982; Gwinn et al., 1992). Previous observations of water masers in Sgr B2 have been carried out with VLBI (Reid et al., 1988) and the Nobeyama Millimeter Array (Kobayashi et al., 1989). The resolution and subsequent absolute positions from Kobayashi et al. (1989) have rms errors of 1030 (), while the relative positions have rms errors of 03. In order to perform a detailed comparison between the UC H ii regions and the maser positions, sub-arcsec resolution and positional accuracy is required. The current observations provide an unprecedented velocity coverage of H2O masers in both W49N and Sgr B2, covering a range of 870 and 160 km s-1 respectively, with angular resolutions of 01. At the distance of W49N (11.4 kpc; Gwinn et al., 1992), this resolution corresponds to a physical size of 0.005 pc, and for Sgr B2 at 8.5 kpc, this angular size corresponds to 0.004 pc, i.e. 1000 AU in both cases. Additionally, the uncertainty of the relative positions of the H2O masers is 0005, or a factor of at least ten better than previous observations of W49 (Gwinn et al., 1992), and 100 times improved over previous data for Sgr B2 (Kobayashi et al., 1989). With the increased precision and velocity coverage of the current data, we can for the first time accurately compare the positions of H2O masers and the UC H ii regions in these two sources, as well as gain a better understanding of the environments near these young stellar objects.
2 Observations
Observations of W49N and Sgr B2 were carried out with the VLA in both A and B configurations using the correlator in line mode with 2 IFs at 22 GHz. Tab. 1 summarizes the parameters of these observations. All maser observations had 63 channels per IF, with a bandwidth of 3.125 MHz, resulting in a velocity resolution of 0.66 km s-1 and a total velocity coverage of 41.6 km s-1 for each observation. In each case, IF1 was centered on velocity multiples of 30 km s-1 from the H2O line transition at 22.23508 GHz, which provided some overlap between observations to allow for the decreased sensitivity at the band edges. The velocity of 170 km s-1 was chosen as the central velocity of IF2 for both sources. In W49N, this velocity corresponds to a bright maser feature which was used both as a positional reference point and to self-calibrate the data (see §2.1). In Sgr B2, this velocity is line free, which allowed us to obtain continuum images simultaneously with the line observations. Integration times were approximately 15 minutes for each of the 29 velocity cubes in W49N, for a total of 7.3 hours on W49N, and 20 minutes for each of the 5 velocity cubes in Sgr B2, for a total of 1.7 hours on Sgr B2. The primary phase calibrators for W49N and Sgr B2 were 1932+210 (1.44 Jy) and 1730-130 (4.73 Jy), respectively, and the primary flux density calibrator was 3C 286.
2.1 W49
For W49N, we were able to self-calibrate the line cube data using a strong maser feature (S50 Jy) at 170.7 km s-1 in IF2, observed in parallel during all observations. After self-calibration the typical rms noise values were 1.0 Jy beam-1 in a line-free channel, and 0.25 Jy beam-1 in channels with a 10-50 Jy beam-1 H2O maser feature. For the W49N 1.3cm August 1998 continuum data, IF1 was centered on v=500 km s-1. At this velocity, there are no detectable H2O masers. We were then able to use the strong maser feature at 170.7 km s-1 in IF2 to cross-calibrate the broad-band continuum at v=500 km s-1 in IF1 using the technique outlined by Reid & Menten (1990, 1997). This technique utilizes the phase and amplitude corrections obtained from self-calibrating the maser emission at v=170.7 km s-1 in IF2, applying these corrections to the broad-band continuum in IF1. The resulting rms noise in the continuum was 4.3 mJy beam-1. Further details of the reduction of the 1.3 cm continuum data are presented by DePree et al. (2000).
In order to obtain an improved alignment between the H2O masers and the 1.3 cm continuum, we assumed that the position of the 170.7 km s-1 maser feature in IF2 as observed with the August 1998 continuum data was fixed. Then all other observations of the 170.7 km s-1 maser were shifted by small amounts (typically 005 in both and ) in order to align the various epochs. The shifts required to bring the IF2 170.7 km s-1 maser features into agreement with the position of the reference maser at 170.7 km s-1 in the August 1998 data were then applied to the IF1 maser line cubes using the AIPS task OGEOM. This method assumes negligible proper motion of the reference maser feature over the length of the observations (1 year). In the case of W49N, this procedure is justified since typical proper motions of these masers are on the order of a few mas per year (Gwinn et al., 1992). This calibration technique allowed us to obtain a relative maser alignment with respect to the 1.3 cm continuum of 001, and a relative positional accuracy of 0005 between the masers.
2.2 Sgr B2
For Sgr B2, the maser lines and the continuum were observed simultaneously in order to cross-calibrate the continuum with the masers, again following the technique of Reid & Menten (1990, 1997). The line data was first self-calibrated, and then the corrections were applied to the line-free continuum in IF2. Each line cube was therefore accurately aligned to its corresponding continuum. The typical rms noise obtained for the Sgr B2 observations was similar to that of W49 (1.0 Jy beam-1 in a line-free channel).
The centroids of the H ii regions in the continuum observed with the IF1 velocity cube at 40 km s-1 were found to agree with positions tabulated in Gaume et al. (1995) to within their quoted rms errors of 001 in and 01 in . This continuum was used as a reference for the other data cubes. We then shifted each observation in order to match this continuum, and applied these shifts to each corresponding IF1 line cube. Once again, shifts were typically 005 in and . The rms error in the alignment of the H2O masers and the continuum was again 001, with a relative positioning accuracy of 0005 for the maser features in Sgr B2.
3 Results
3.1 W49
Over the velocity range -435 km s-1 to +435 km s-1, we find 316 H2O maser components between velocities -352.1 and 375.5 km s-1 in W49N. The positions, velocities and flux densities of these H2O masers are listed in Tab. 2 and a spectrum of the masers is shown in Fig. 4. The same three regions of prominent maser activity noted by Moran et al. (1973), Walker et al. (1982), and Gwinn et al. (1992) around H ii regions G1/G2 are observed, as well as the separation between blueshifted features to the west and redshifted features to the east of the outflow center (see Fig 1). The high and low velocity features co-exist in the region around the center of outflow, while at greater distances from the outflow center, only high velocity features are observed. In addition to the masers surrounding the UC H ii regions G1 and G2, there is another cluster of masers to the west around H ii region B2 (see Fig 1). This cluster consists mostly of OH masers (from Argon, Reid, & Menten 2000), but a few redshifted H2O masers (100 km s-1) are detected there as well, which suggests that these H2O masers are not associated with the G1/G2 outflow, since all other H2O masers west of source G1 are blueshifted. Approximately 16″ to the northeast of source G2 there is a cluster of H2O masers that is not associated with any prominent H ii region. The velocity range of these masers is from 5.3 km s-1 to 121.3 km s-1. There is also a group of OH masers at the 1612 MHz transition (Argon et al. 2000) approximately 35 north of source A, that are not associated with any detected H ii region.
3.2 Sgr B2
In Sgr B2, a velocity range of -40 km s-1 to 120 km s-1 was investigated. We detected 79 H2O masers in Sgr B2 North between -16.1 and 119.8 km s-1 (Fig. 2b), 14 masers in Sgr B2 Mid-North between 23.8 and 117.8 km s-1 (Fig. 2c), and 17 masers in Sgr B2 South between 3.4 and 82.8 km s-1 (Fig. 2d). In Sgr B2 Main we detected 68 masers between -13.4 and 117.1 km s-1 which are plotted over the high resolution 7mm continuum image of DePree et al. (1998) in Fig. 3 along with the OH masers detected by Argon et al. (2000). Absolute positional errors for the OH masers are 03 in and , while the absolute alignment between the H2O masers and the 7 mm continuum is 005. Figures 5 and 6 show the entire spectrum of maser emission in Sgr B2 Main and North, and Mid-North and South, respectively, while Tables 3 - 6 list the positions, velocities, and flux densities of the H2O masers detected in all Sgr B2 regions.
In Sgr B2 North, the H2O maser positions center around K2 (see Fig. 2b), while the OH masers are clustered around K3. The H2O masers in Sgr B2 Mid-North shown in Fig. 2c are coincident with the OH masers around the compact source labeled Z10.24 by Gaume et al. (1995). A few (10) high and low velocity H2O masers are visible to the west, which may indicate another region of outflow. In Sgr B2 South, the H2O and OH masers are coincident around the front edge of the cometary source H, and have comparable velocities. A clump of mostly low velocity H2O masers to the west of source H is detected. Another clump of OH masers is detected between source H and the outlying H2O masers to the west.
4 Discussion
4.1 W49
The observed H2O maser velocity range (-352 to 375 km s-1) is the largest observed for any region in the Galaxy to date, making W49N a truly exceptional H2O maser source. Due to prominent time variations in the maser emission (eg., Sullivan 1971), however, observations at other epochs may well exhibit a different velocity extreme. Morris (1976) suggests a smaller velocity range for W49N (-256 to +271 km s-1), albeit still large by comparison to other active H2O maser regions in the Galaxy. Gwinn et al. (1992) suggest that the H2O masers in W49N are accelerating from a common origin in a bipolar outflow. The high resolution continuum imaging of DePree et al. (2000) indicates that the center of this high velocity outflow lies directly between the two ultra-compact H ii regions, G1 and G2a.
The majority of the OH masers detected by Argon et al. (2000) appear to be clustered around source B2, where there is limited H2O maser emission. Additionally, Gaume & Mutel (1987) find a larger cluster of OH masers around the main region of H2O maser activity, sources G1 and G2. The relative strength of OH and H2O masers in these two H ii regions may indicate different evolutionary stages, or simply different excitation levels due to the number of stars producing UV radiation in each region. Water masers are typically associated with the presence of young O and B stars, but are also found to be associated with even younger sources like hot molecular cores, and in these cases are thought to trace the outflows associated with young stellar objects (e.g. De Buizer et al. 2000). Some examples of possible hot cores indicated by the H2O maser data include the region 16′′ to the northeast of sources G1/G2 and the group of OH masers 35 north of source A, where maser activity is observed but no associated H ii region is detected. Wilner et al. (2001) find CH3CN emission at the former position which they attribute to a hot core, but do not detect any CH3CN emission at the latter location.
4.2 Sgr B2
From Fig. 3, we can see that the H2O maser positions in Sgr B2 Main fall almost perfectly along the outside edge of the 7mm continuum. One interpretation of this alignment, is that entrainment may play a role in maser formation, whereby the masers form in the dense material swept up by the stellar winds. Alternatively, these masers may be associated with the molecular outflow of the Sgr B2 F region itself (e.g. Kuan & Snyder 1996). OH masers in Sgr B2 Main are detected farther from the 7mm continuum, and there appears to be a dichotomy between the H2O and OH masers; the H2O masers are found primarily around source F1, whereas the majority of OH masers are found to the south of F3. Torrelles et al. (1997) find a similar dichotomy in the relative positions of OH and H2O masers in W75N; the H2O masers appear to be aligned more closely along the outflow axis, while the OH masers appear to be more distant. They note that this arrangement is consistent with the idea proposed by Forster & Caswell (1989) in which OH masers are formed at a later stage in the lifetime of the YSO, in the less dense surrounding material, but they also examine the possibility that the OH masers trace an older outflow region, distinct from that of the H2O masers.
In Sgr B2 North we see another dichotomy between H2O and OH masers. The velocities of the OH masers are lower than the velocities of the H2O masers at the same position, so it is possible that as suggested for Sgr B2 Main, the H2O and OH masers may trace different outflows, or the OH masers may trace an older outflow event. A few clusters of masers were discovered in areas not associated with an H ii region, notably the area west of Z10.24 in Sgr B2 Mid-North, and two regions west of source H in Sgr B2 South. Each of these may indicate hot cores in various evolutionary stages and of various intensities, given the differences in the relative contribution from both H2O and OH masers at each location.
5 Conclusions
Positions and velocities for 316 and 178 1.3cm H2O maser components have been determined in the massive H ii regions, W49N and Sgr B2, respectively. These represent the best velocity coverage and relative maser positions to date for these sources. The relative positions of the continuum and maser positions have been determined to a level of 001, while the relative positions of the H2O maser components have a precision of 0005. Both sources show high velocity outflows and strong maser emission regions, indicative of active star formation.
W49N and Sgr B2 show similarities in the velocity structure of masers around a center of outflow; close to the center, a range of maser velocities is observed, while farther away only high velocity features are present. This type of structure can be explained with the model proposed by Mac Low & Elitzur (1992), where the maser features lie along a shocked shell expanding outwards from a central star or group of stars, driven by a strong central wind. Alternatively, Gwinn et al. (1992) suggest that the masers trace the bipolar outflow itself and that a shell of shocked emission is not a necessary condition for maser formation.
Additionally, we find that the OH and H2O masers in W49N and Sgr B2 appear to trace different regions, which could be interpreted as an evolutionary effect; the younger sources predominantly give rise to H2O masers, while the older outflows excite OH masers. In both W49N and Sgr B2, the H2O masers are found in denser regions (as traced by molecular gas) than the OH masers, tracing out the very edge of the 7mm continuum. These observations support the idea that clumps of dense gas from which the H2O masers originate may be entrained by stellar winds sweeping up the gas into an expanding shell.
Finally, several regions of H2O maser activity have been detected that do not appear to correspond with H ii regions (far northeast of source G in W49N, north of source A in W49N, west of source Z10.24 in Sgr B2 Mid-North, and two regions west of source H in Sgr B2 South). These represent regions for further study, as they may pinpoint stars in the earliest stages of formation, surrounded by hot cores still moving onto the main sequence.
References
- Alves & Homeier (2003) Alves, J., & Homeier, N. 2003, ApJ, 589, L45
- Argon et al. (2000) Argon, A. L., Reid, M. J., & Menten, K. M. 2000, ApJS, 129, 159
- Conti & Blum (2002) Conti, P. S., & Blum, R. D. 2002, ApJ, 564, 827
- De Buizer et al. (2000) De Buizer, J. M., Piña, R. K., & Telesco, C. M. 2000, ApJS, 130, 437
- DePree et al. (1995) DePree, C. G., Gaume, R. A., Goss, W. M., & Claussen, M. J. 1995, ApJ, 451, 284
- DePree et al. (1996) DePree, C. G., Gaume, R. A., Goss, W. M., & Claussen, M. J. 1996, ApJ, 464, 788
- DePree et al. (1997) DePree, C. G., Mehringer, D. M., & Goss, W. M. 1997, ApJ, 482, 307
- DePree et al. (1998) DePree, C. G., Goss, W. M., & Gaume, R. A. 1998, ApJ, 500, 847
- DePree et al. (2000) DePree, C. G., Wilner, D. J., Goss, W. M., Welch, W. J., & McGrath, E. J. 2000, ApJ, 540, 308
- Elitzur (1995) Elitzur, M. 1995, in RevMexAA Ser. de Conf. 1, Circumstellar Disks, Outflows and Star Formation, eds. S. Lizano, & J. M. Torrelles (Cozumel, Mexico: RevMexAA), 85
- Garay & Lizano (1999) Garay, G., & Lizano, S. 1999, PASP, 111, 1049
- Gaume et al. (1995) Gaume, R. A., Claussen, M. J., DePree, C. G., Goss, W. M., & Mehringer, D. M. 1995, ApJ, 449, 663
- Gaume & Mutel (1987) Gaume, R. A., & Mutel, R. L. 1987, ApJS, 65, 193
- Gwinn et al. (1992) Gwinn, C. R., Moran, J. M., & Reid, M. J. 1992, ApJ, 393, 149
- Forster & Caswell (1989) Forster, J. R., & Caswell, J. L. 1989, A&A, 213, 339
- Kobayashi et al. (1989) Kobayashi, H., Ishiguro, M., Chikada, Y., Ukita, N., Morita, K.-I., Okumura, S. K., Kasuga, T., & Kawabe, R. 1989, PASJ, 41, 141
- Kuan & Snyder (1996) Kuan, Y.-J., & Snyder, L. E. 1996, ApJ, 470, 981
- Lis et al. (1993) Lis, D. C., Goldsmith, P. F., Carlstrom, J. E., & Scoville, N. Z. 1993, ApJ, 402, 238
- Mac Low & Elitzur (1992) Mac Low, M.-M., & Elitzur, M. 1992, ApJ, 393, 33
- Mehringer et al. (1993) Mehringer, D. M., Palmer, P., Goss, W. M., & Yusef-Zadeh, F. 1993, ApJ, 412, 684
- Mehringer et al. (1995a) Mehringer, D. M., Goss, W. M., & Palmer, P. 1995a, ApJ, 452, 304
- Mehringer et al. (1995b) Mehringer, D. M., Palmer, P., & Goss, W. M. 1995b, ApJS, 97, 497
- Mezger et al. (1967) Mezger, P. G., Schraml, J., & Terzian, Y. 1967, ApJ, 150, 807
- Moran et al. (1973) Moran J. M., Papadopoulos, G. D., Burke, B. F., Lo, K. Y., Schwartz, P. R., & Thacker, D. L. 1973, ApJ, 185, 535
- Morris (1976) Morris, M. 1976, ApJ, 210, 100
- Reid & Menten (1990) Reid, M. J., & Menten, K. M. 1990, ApJ, 360, L51
- Reid & Menten (1997) Reid, M. J., & Menten, K. M. 1997, ApJ, 476, 327
- Reid et al. (1988) Reid, M. J., Schneps, M. H., Moran, J. M., Gwinn, C. R., Genzel, R., Downes, D., & Rönnäng, B. 1988, ApJ, 330, 809
- Sullivan (1971) Sullivan, W. T., III 1971, ApJ, 166, 321
- Takagi et al. (2002) Takagi, S., Murakami, H., & Koyama, K. 2002, ApJ, 573, 275
- Torrelles et al. (1997) Torrelles, J. M., Gómez, J. F., Rodríguez, L. F., Ho, P. T. P., Curiel, S., & Vázquez, R. 1997, ApJ, 489, 744
- Walker et al. (1982) Walker, R. C., Matsakis, D. N., & Garcia-Barreto, J. A. 1982, ApJ, 255, 128
- Wilner et al. (2001) Wilner, D. J., De Pree, C. G., Welch, W. J., & Goss, W. M. 2001, ApJ, 550, L81


| Observation | VLA | IF 1 Central Vel. | IF 2 Central Vel. | P.A. | |
|---|---|---|---|---|---|
| Date | Config. | (km s-1) | (km s-1) | (arcsec) | (deg) |
| W49N | |||||
| 1998 Jul 24 | B | -60, -30, 0, 30, 60 | 170 | 0.300.27 | 1 |
| 1998 Aug 24 | B | 500 | 170 | 0.280.24 | 8 |
| 1998 Sep 6 | B | -150, -120, -90, 90, 120, 150 | 170 | 0.320.29 | 25 |
| 1999 Jun 26 | A | -240, -210, -180, 180, 210, 240 | 170 | 0.100.09 | -3 |
| 1999 Jul 18 | A | -330, -300, -270, 270, 300, 330 | 170 | 0.110.09 | 34 |
| 1999 Nov 17 | B | -420, -390, -360, 360, 390, 420 | 170 | 0.410.28 | 44 |
| Sgr B2 | |||||
| 1998 Jun 6 | BnA | -20, 10, 40, 70, 100 | 170 | 0.380.18 | 50 |
| (s) | (′′) | Flux Density | Error | |
|---|---|---|---|---|
| 19h07m (B1950) | 09o01′(B1950) | (km s-1) | (Jy) | (Jy) |
| 49.904 | 15.91 | 375.5 | 0.59 | 0.20 |
| 49.904 | 15.90 | 372.8 | 1.44 | 0.20 |
| 49.898 | 15.92 | 271.3 | 6.30 | 0.10 |
| 49.892 | 16.01 | 259.1 | 1.07 | 0.03 |
| 49.893 | 15.84 | 256.5 | 17.09 | 0.04 |
| 49.894 | 15.87 | 253.2 | 17.39 | 0.04 |
| 49.893 | 15.84 | 250.5 | 3.20 | 0.02 |
| 49.897 | 15.90 | 247.9 | 5.05 | 0.02 |
| 49.889 | 15.81 | 238.0 | 1.34 | 0.02 |
| 49.897 | 15.90 | 236.7 | 1.59 | 0.02 |
| 49.897 | 15.91 | 234.1 | 1.12 | 0.02 |
| 49.882 | 15.86 | 232.7 | 0.64 | 0.02 |
| 49.900 | 15.94 | 229.1 | 0.44 | 0.03 |
| 49.890 | 15.82 | 227.1 | 2.30 | 0.03 |
| 49.882 | 15.86 | 226.8 | 2.18 | 0.02 |
| 49.869 | 15.59 | 225.8 | 2.32 | 0.03 |
| 49.849 | 16.10 | 223.8 | 3.16 | 0.03 |
| 49.850 | 16.10 | 218.6 | 4.56 | 0.03 |
| 49.850 | 16.10 | 212.6 | 7.14 | 0.03 |
| 49.848 | 15.72 | 211.3 | 0.54 | 0.02 |
| 49.887 | 15.80 | 209.3 | 3.61 | 0.03 |
| 49.887 | 15.90 | 207.4 | 1.29 | 0.03 |
| 49.844 | 15.75 | 204.7 | 1.12 | 0.03 |
| 49.887 | 15.82 | 204.1 | 0.71 | 0.03 |
| 49.852 | 16.14 | 202.7 | 9.12 | 0.03 |
| 49.867 | 15.77 | 201.4 | 1.25 | 0.03 |
| 49.844 | 15.75 | 200.8 | 0.91 | 0.03 |
| 49.846 | 16.10 | 199.1 | 9.56 | 0.04 |
| 49.887 | 15.82 | 198.1 | 1.04 | 0.03 |
| 49.867 | 15.77 | 197.8 | 1.55 | 0.03 |
| 49.887 | 15.82 | 196.2 | 1.73 | 0.03 |
| 49.868 | 15.79 | 194.5 | 6.28 | 0.03 |
| 49.844 | 15.75 | 193.2 | 4.13 | 0.03 |
| 49.853 | 16.13 | 191.2 | 1.35 | 0.03 |
| 49.868 | 15.79 | 189.9 | 2.24 | 0.02 |
| 49.867 | 15.78 | 187.3 | 1.20 | 0.03 |
| 49.844 | 15.75 | 186.6 | 11.01 | 0.03 |
| 49.852 | 15.79 | 183.3 | 22.98 | 0.05 |
| 49.888 | 15.82 | 183.3 | 5.87 | 0.05 |
| 49.844 | 15.75 | 181.3 | 3.68 | 0.03 |
| 49.841 | 15.99 | 180.7 | 2.16 | 0.03 |
| 49.852 | 16.13 | 179.3 | 16.46 | 0.04 |
| 49.866 | 15.76 | 178.0 | 22.12 | 0.08 |
| 49.849 | 16.09 | 178.0 | 21.81 | 0.08 |
| 49.845 | 15.75 | 178.0 | 5.58 | 0.08 |
| 49.841 | 15.99 | 178.0 | 2.45 | 0.08 |
| 49.851 | 15.80 | 177.4 | 10.17 | 0.05 |
| 49.884 | 15.80 | 175.4 | 2.79 | 0.03 |
| 49.879 | 15.97 | 174.7 | 1.55 | 0.03 |
| 49.852 | 16.11 | 172.8 | 5.79 | 0.04 |
| 49.840 | 15.96 | 172.8 | 13.21 | 0.04 |
| 49.879 | 15.97 | 172.1 | 5.58 | 0.04 |
| 49.852 | 16.12 | 172.1 | 5.85 | 0.04 |
| 49.884 | 15.79 | 172.1 | 1.18 | 0.04 |
| 49.841 | 15.98 | 170.8 | 9.8 | 0.1 |
| 49.844 | 15.75 | 170.1 | 84.2 | 0.2 |
| 49.855 | 16.13 | 170.1 | 4.0 | 0.2 |
| 49.852 | 15.79 | 168.8 | 4.57 | 0.04 |
| 49.841 | 15.98 | 166.8 | 94.7 | 0.2 |
| 49.854 | 16.11 | 165.8 | 47.1 | 0.2 |
| 49.844 | 15.76 | 165.2 | 85.5 | 0.3 |
| 49.844 | 15.75 | 164.8 | 127.1 | 0.2 |
| 49.855 | 16.13 | 162.9 | 7.42 | 0.04 |
| 49.865 | 15.82 | 159.9 | 19.0 | 0.1 |
| 49.849 | 16.06 | 156.6 | 25.1 | 0.1 |
| 49.873 | 15.81 | 154.6 | 7.37 | 0.02 |
| 49.845 | 15.76 | 152.6 | 29.70 | 0.08 |
| 49.855 | 16.13 | 152.0 | 14.98 | 0.05 |
| 49.835 | 13.80 | 150.0 | 21.24 | 0.06 |
| 49.846 | 15.76 | 146.7 | 17.50 | 0.05 |
| 49.846 | 15.76 | 145.4 | 19.92 | 0.06 |
| 49.871 | 15.78 | 144.1 | 8.2 | 0.1 |
| 49.835 | 13.80 | 144.1 | 38.1 | 0.1 |
| 49.850 | 16.07 | 138.8 | 13.29 | 0.04 |
| 49.834 | 13.80 | 138.4 | 2.3 | 0.1 |
| 49.881 | 15.86 | 136.2 | 6.62 | 0.04 |
| 49.900 | 15.91 | 133.8 | 7.45 | 0.03 |
| 49.835 | 13.80 | 131.2 | 9.82 | 0.04 |
| 49.881 | 15.82 | 129.2 | 14.16 | 0.04 |
| 49.844 | 14.20 | 127.2 | 4.54 | 0.02 |
| 49.834 | 13.81 | 125.3 | 9.9 | 0.2 |
| 49.883 | 15.80 | 124.0 | 198.0 | 0.5 |
| 50.538 | 27.85 | 121.3 | 1.42 | 0.05 |
| 49.844 | 15.79 | 121.3 | 12.63 | 0.05 |
| 49.835 | 13.81 | 116.7 | 4.09 | 0.02 |
| 49.843 | 14.14 | 116.7 | 1.53 | 0.02 |
| 49.845 | 15.78 | 113.4 | 42.6 | 0.1 |
| 49.533 | 16.01 | 113.4 | 1.6 | 0.1 |
| 49.846 | 15.78 | 110.1 | 13.67 | 0.04 |
| 50.537 | 27.85 | 108.8 | 0.43 | 0.03 |
| 49.536 | 16.02 | 107.5 | 20.42 | 0.07 |
| 49.783 | 14.87 | 105.2 | 4.94 | 0.04 |
| 49.837 | 15.81 | 102.5 | 22.5 | 0.2 |
| 49.537 | 16.02 | 101.9 | 35.0 | 0.2 |
| 49.883 | 15.74 | 100.5 | 154.8 | 0.5 |
| 49.836 | 15.81 | 99.2 | 27.6 | 0.1 |
| 49.536 | 16.03 | 97.2 | 102.0 | 0.2 |
| 49.840 | 15.01 | 94.6 | 2.59 | 0.09 |
| 49.666 | 15.70 | 93.3 | 2.14 | 0.08 |
| 49.883 | 15.74 | 92.0 | 565.1 | 1.5 |
| 49.667 | 15.71 | 89.3 | 1.68 | 0.03 |
| 49.844 | 14.31 | 87.4 | 1.17 | 0.03 |
| 49.843 | 16.52 | 85.4 | 2.87 | 0.04 |
| 49.537 | 16.03 | 84.7 | 9.92 | 0.05 |
| 49.803 | 15.44 | 83.4 | 5.38 | 0.04 |
| 49.840 | 14.01 | 81.4 | 2.21 | 0.06 |
| 49.842 | 14.27 | 80.1 | 1.88 | 0.04 |
| 49.814 | 15.69 | 78.8 | 42.4 | 0.1 |
| 49.849 | 16.61 | 78.1 | 6.77 | 0.08 |
| 49.820 | 15.67 | 74.8 | 15.16 | 0.08 |
| 49.856 | 15.91 | 72.2 | 42.3 | 0.3 |
| 49.857 | 16.59 | 70.5 | 5.4 | 0.1 |
| 49.830 | 16.60 | 70.5 | 5.4 | 0.1 |
| 49.882 | 15.83 | 67.9 | 151.2 | 0.8 |
| 49.842 | 14.02 | 66.6 | 17.1 | 0.2 |
| 49.858 | 16.57 | 64.6 | 31.7 | 0.4 |
| 49.824 | 15.65 | 64.6 | 14.4 | 0.4 |
| 49.830 | 16.59 | 64.0 | 20.4 | 0.4 |
| 49.883 | 15.78 | 61.3 | 415.1 | 2.0 |
| 49.833 | 15.48 | 61.3 | 24.4 | 2.0 |
| 49.840 | 14.14 | 61.3 | 29.7 | 2.0 |
| 49.852 | 15.93 | 58.7 | 520.8 | 3.4 |
| 49.914 | 14.66 | 58.0 | 31.9 | 2.8 |
| 49.829 | 16.65 | 58.0 | 28.6 | 2.8 |
| 49.936 | 14.40 | 56.7 | 148 | 10 |
| 49.880 | 15.73 | 56.7 | 1410 | 10 |
| 49.864 | 16.62 | 56.7 | 90.9 | 10.0 |
| 49.832 | 14.06 | 56.7 | 96.5 | 10.0 |
| 49.851 | 15.93 | 55.4 | 72.8 | 1.6 |
| 49.849 | 14.98 | 55.4 | 35.3 | 1.6 |
| 49.829 | 16.57 | 54.1 | 48.4 | 0.8 |
| 49.834 | 16.47 | 52.8 | 24.2 | 0.4 |
| 49.850 | 15.95 | 52.1 | 35.4 | 0.5 |
| 49.854 | 16.56 | 51.4 | 34.2 | 0.9 |
| 49.836 | 15.53 | 51.4 | 91.0 | 0.9 |
| 49.807 | 15.53 | 50.8 | 20.7 | 0.7 |
| 49.860 | 16.60 | 48.1 | 17.4 | 0.8 |
| 49.837 | 16.47 | 48.1 | 62.8 | 0.8 |
| 49.538 | 16.04 | 45.5 | 12.7 | 0.4 |
| 49.825 | 15.64 | 43.8 | 36.8 | 0.6 |
| 49.882 | 15.83 | 43.5 | 368 | 10 |
| 49.858 | 16.57 | 42.5 | 27.9 | 0.5 |
| 49.841 | 14.02 | 41.2 | 48.0 | 0.4 |
| 49.883 | 15.81 | 38.6 | 319.0 | 1.5 |
| 49.857 | 16.57 | 37.2 | 28.5 | 0.6 |
| 49.865 | 15.63 | 33.3 | 164.3 | 2.9 |
| 49.882 | 15.83 | 33.3 | 767.2 | 2.9 |
| 49.806 | 15.49 | 32.6 | 40.9 | 2.6 |
| 49.857 | 16.62 | 32.6 | 60.0 | 2.6 |
| 49.537 | 16.04 | 31.3 | 11.6 | 0.7 |
| 49.823 | 16.64 | 29.3 | 12.3 | 0.8 |
| 49.799 | 15.53 | 29.3 | 8.87 | 0.80 |
| 49.538 | 16.04 | 27.4 | 31.3 | 1.1 |
| 49.883 | 15.85 | 27.4 | 245.9 | 1.1 |
| 49.825 | 16.62 | 26.0 | 13.4 | 0.6 |
| 49.537 | 16.03 | 24.7 | 26.3 | 0.8 |
| 49.847 | 14.00 | 24.1 | 40.0 | 1.0 |
| 49.882 | 15.85 | 24.1 | 218.8 | 1.0 |
| 49.795 | 14.99 | 23.4 | 45.7 | 0.9 |
| 50.536 | 27.87 | 23.4 | 24.5 | 0.9 |
| 50.536 | 27.85 | 21.4 | 39.4 | 1.4 |
| 49.775 | 15.59 | 20.8 | 18.9 | 1.8 |
| 49.807 | 15.52 | 20.8 | 27.2 | 1.8 |
| 49.883 | 15.84 | 20.1 | 243.1 | 2.3 |
| 49.853 | 16.53 | 19.5 | 239.1 | 2.8 |
| 49.912 | 15.15 | 19.5 | 27.1 | 2.8 |
| 49.849 | 14.03 | 18.1 | 478 | 11 |
| 49.849 | 15.92 | 16.2 | 285.5 | 3.8 |
| 49.810 | 15.82 | 16.2 | 284.5 | 3.8 |
| 49.770 | 15.54 | 15.5 | 85.1 | 2.9 |
| 49.387 | 13.96 | 15.5 | 73.8 | 2.9 |
| 49.825 | 15.49 | 14.9 | 89.3 | 4.1 |
| 49.885 | 15.85 | 14.5 | 314.0 | 1.8 |
| 50.522 | 27.64 | 13.8 | 237.3 | 3.0 |
| 49.856 | 16.56 | 13.2 | 36.4 | 2.8 |
| 49.853 | 14.15 | 13.2 | 103.6 | 2.8 |
| 49.855 | 15.92 | 12.5 | 102.8 | 4.2 |
| 49.837 | 13.82 | 12.5 | 69.4 | 4.2 |
| 49.886 | 15.85 | 11.2 | 424.0 | 7.9 |
| 49.768 | 15.60 | 11.2 | 290.3 | 7.9 |
| 49.803 | 15.59 | 9.2 | 5040 | 30 |
| 49.838 | 14.68 | 9.2 | 481 | 31 |
| 49.857 | 14.00 | 7.9 | 313 | 24 |
| 49.808 | 15.25 | 5.9 | 1080 | 10 |
| 50.522 | 27.47 | 5.3 | 98.8 | 5.0 |
| 49.853 | 15.90 | 3.9 | 384.0 | 3.1 |
| 49.768 | 15.57 | 3.9 | 306.8 | 3.1 |
| 49.801 | 15.83 | 3.3 | 362.2 | 2.1 |
| 49.853 | 15.99 | 2.0 | 220.8 | 1.6 |
| 49.814 | 15.18 | 0.7 | 282.0 | 1.4 |
| 49.854 | 16.00 | -0.7 | 109.6 | 1.8 |
| 49.840 | 15.44 | -0.7 | 161.1 | 1.8 |
| 49.769 | 15.63 | -0.7 | 118.0 | 1.8 |
| 49.814 | 15.15 | -1.3 | 242.5 | 1.7 |
| 49.842 | 15.42 | -3.3 | 188.2 | 2.1 |
| 49.748 | 15.38 | -3.9 | 349.9 | 2.6 |
| 49.804 | 15.57 | -6.6 | 2070 | 10 |
| 49.771 | 15.70 | -9.2 | 510.4 | 3.1 |
| 49.771 | 15.69 | -13.2 | 544.2 | 2.8 |
| 49.771 | 15.62 | -15.8 | 909 | 22 |
| 49.804 | 15.16 | -15.8 | 373 | 22 |
| 49.803 | 15.31 | -16.8 | 506.5 | 3.3 |
| 49.809 | 15.83 | -21.4 | 133.4 | 1.2 |
| 49.772 | 15.66 | -25.4 | 126.5 | 1.0 |
| 49.811 | 15.86 | -25.4 | 77.8 | 1.0 |
| 49.804 | 15.35 | -33.3 | 2520 | 10 |
| 49.771 | 15.64 | -36.6 | 178.4 | 1.7 |
| 49.810 | 15.81 | -37.2 | 182.4 | 1.4 |
| 49.771 | 15.69 | -41.8 | 339.3 | 3.7 |
| 49.802 | 15.68 | -43.8 | 1350 | 10 |
| 49.773 | 15.59 | -45.8 | 107.7 | 9.8 |
| 49.814 | 15.90 | -47.5 | 109.6 | 0.6 |
| 49.805 | 15.37 | -48.8 | 71.6 | 0.5 |
| 49.803 | 15.67 | -54.1 | 1650 | 10 |
| 49.771 | 15.69 | -58.7 | 1830 | 10 |
| 49.803 | 15.68 | -60.0 | 619.3 | 4.0 |
| 49.771 | 15.69 | -60.7 | 1240 | 10 |
| 49.802 | 15.68 | -67.2 | 106.3 | 1.1 |
| 49.833 | 15.53 | -70.9 | 308.7 | 3.4 |
| 49.772 | 15.68 | -72.5 | 4791 | 2 |
| 49.833 | 15.53 | -73.8 | 716.2 | 4.5 |
| 49.802 | 15.68 | -76.2 | 570.6 | 1.7 |
| 49.771 | 15.57 | -76.8 | 523.5 | 1.7 |
| 49.832 | 15.53 | -79.5 | 233.6 | 0.9 |
| 49.812 | 15.89 | -80.1 | 178.9 | 0.9 |
| 49.805 | 15.42 | -82.8 | 177.6 | 0.8 |
| 49.832 | 15.53 | -84.1 | 325.2 | 0.7 |
| 49.832 | 15.53 | -86.1 | 868.9 | 1.8 |
| 49.767 | 15.62 | -88.7 | 88.9 | 0.3 |
| 49.799 | 15.62 | -92.0 | 45.8 | 0.2 |
| 49.770 | 15.64 | -92.6 | 98.7 | 0.2 |
| 49.831 | 15.54 | -95.9 | 32.8 | 0.2 |
| 49.805 | 15.53 | -97.9 | 48.3 | 0.2 |
| 49.772 | 15.67 | -100.5 | 349.8 | 0.8 |
| 49.833 | 15.54 | -100.9 | 99.8 | 0.8 |
| 49.775 | 15.74 | -102.5 | 461.7 | 0.9 |
| 49.773 | 15.71 | -103.6 | 197.4 | 0.8 |
| 49.832 | 15.54 | -103.8 | 40.2 | 0.3 |
| 49.807 | 15.53 | -107.5 | 28.1 | 0.5 |
| 49.805 | 15.31 | -112.1 | 44.7 | 1.3 |
| 49.771 | 15.67 | -113.4 | 1210 | 3 |
| 49.841 | 15.56 | -120.7 | 19.0 | 0.5 |
| 49.805 | 15.86 | -123.9 | 67.8 | 0.6 |
| 49.805 | 15.46 | -129.9 | 182.4 | 0.5 |
| 49.807 | 15.54 | -133.2 | 59.6 | 0.3 |
| 49.805 | 15.43 | -133.6 | 77.8 | 0.7 |
| 49.772 | 15.67 | -133.6 | 219.0 | 0.7 |
| 49.803 | 15.70 | -137.5 | 159.2 | 0.9 |
| 49.772 | 15.66 | -138.8 | 289.1 | 0.7 |
| 49.771 | 15.67 | -142.8 | 299.6 | 0.7 |
| 49.801 | 15.87 | -145.4 | 22.0 | 0.3 |
| 49.771 | 15.67 | -146.1 | 152.6 | 0.4 |
| 49.819 | 15.65 | -147.4 | 31.6 | 0.2 |
| 49.839 | 15.47 | -147.4 | 11.5 | 0.2 |
| 49.817 | 15.67 | -151.3 | 22.2 | 0.1 |
| 49.771 | 15.66 | -152.0 | 90.1 | 0.2 |
| 49.802 | 15.82 | -152.6 | 19.8 | 0.2 |
| 49.819 | 15.65 | -154.6 | 6.71 | 0.07 |
| 49.772 | 15.65 | -160.3 | 103.8 | 0.2 |
| 49.805 | 15.42 | -162.5 | 13.94 | 0.05 |
| 49.772 | 15.65 | -162.9 | 130.8 | 0.2 |
| 49.767 | 15.45 | -163.6 | 9.8 | 0.3 |
| 49.804 | 15.46 | -164.2 | 33.7 | 0.1 |
| 49.805 | 15.87 | -165.5 | 1.30 | 0.07 |
| 49.810 | 15.59 | -166.2 | 1.36 | 0.08 |
| 49.756 | 15.35 | -168.8 | 2.34 | 0.04 |
| 49.767 | 15.45 | -169.5 | 3.39 | 0.04 |
| 49.772 | 15.66 | -173.4 | 84.7 | 0.2 |
| 49.767 | 15.45 | -174.7 | 2.60 | 0.04 |
| 49.744 | 15.14 | -174.7 | 1.79 | 0.04 |
| 49.815 | 15.84 | -174.7 | 1.04 | 0.04 |
| 49.747 | 15.35 | -175.4 | 1.59 | 0.03 |
| 49.815 | 15.83 | -178.7 | 4.61 | 0.05 |
| 49.764 | 15.70 | -178.7 | 2.44 | 0.05 |
| 49.784 | 15.48 | -179.3 | 4.92 | 0.05 |
| 49.762 | 15.78 | -179.3 | 2.18 | 0.05 |
| 49.805 | 15.48 | -180.0 | 12.51 | 0.05 |
| 49.747 | 15.35 | -180.7 | 2.08 | 0.05 |
| 49.765 | 15.46 | -181.3 | 2.12 | 0.04 |
| 49.747 | 15.35 | -184.6 | 5.81 | 0.04 |
| 49.761 | 15.79 | -185.3 | 0.75 | 0.04 |
| 49.747 | 15.35 | -186.6 | 7.33 | 0.07 |
| 49.763 | 15.44 | -186.6 | 4.33 | 0.07 |
| 49.756 | 15.28 | -187.2 | 27.56 | 0.08 |
| 49.771 | 15.68 | -188.5 | 11.18 | 0.06 |
| 49.763 | 15.44 | -189.2 | 8.81 | 0.06 |
| 49.754 | 15.47 | -189.9 | 4.60 | 0.06 |
| 49.747 | 15.35 | -191.2 | 22.18 | 0.06 |
| 49.747 | 15.35 | -193.6 | 21.96 | 0.06 |
| 49.764 | 15.45 | -194.9 | 5.50 | 0.06 |
| 49.770 | 15.68 | -195.5 | 12.16 | 0.07 |
| 49.754 | 15.47 | -195.8 | 3.56 | 0.11 |
| 49.754 | 15.46 | -196.2 | 2.89 | 0.07 |
| 49.804 | 15.48 | -199.5 | 67.6 | 0.1 |
| 49.747 | 15.35 | -200.1 | 4.41 | 0.10 |
| 49.808 | 15.38 | -201.5 | 10.69 | 0.07 |
| 49.804 | 15.48 | -204.7 | 991.1 | 1.9 |
| 49.747 | 15.35 | -206.7 | 13.30 | 0.29 |
| 49.803 | 15.48 | -208.0 | 917.2 | 1.9 |
| 49.763 | 15.45 | -212.6 | 1.82 | 0.03 |
| 49.742 | 15.19 | -222.3 | 0.88 | 0.03 |
| 49.734 | 15.30 | -223.6 | 1.18 | 0.03 |
| 49.818 | 15.55 | -225.5 | 0.64 | 0.03 |
| 49.804 | 15.48 | -225.5 | 8.55 | 0.03 |
| 49.759 | 15.44 | -228.8 | 15.55 | 0.04 |
| 49.742 | 15.20 | -230.1 | 10.67 | 0.09 |
| 49.805 | 15.48 | -231.5 | 15.89 | 0.05 |
| 49.759 | 15.43 | -232.8 | 28.46 | 0.09 |
| 49.742 | 15.21 | -236.7 | 5.36 | 0.03 |
| 49.759 | 15.43 | -238.0 | 9.75 | 0.03 |
| 49.754 | 15.40 | -242.6 | 4.21 | 0.02 |
| 49.759 | 15.43 | -245.3 | 2.37 | 0.02 |
| 49.734 | 15.08 | -248.5 | 8.79 | 0.03 |
| 49.734 | 15.08 | -255.8 | 3.54 | 0.03 |
| 49.231 | 16.09 | -349.5 | 0.09 | 0.01 |
| 49.234 | 16.08 | -352.1 | 0.06 | 0.01 |
Note. — Relative positional errors are 0005 in and . Absolute errors are 005.
| (s) | (′′) | Flux Density | Error | |
|---|---|---|---|---|
| 17h44m (B1950) | -28o22′(B1950) | (km s-1) | (Jy) | (Jy) |
| 10.361 | 01.92 | 117.1 | 0.67 | 0.02 |
| 10.290 | 01.43 | 111.9 | 0.44 | 0.01 |
| 10.362 | 01.92 | 111.2 | 0.47 | 0.01 |
| 10.296 | 02.42 | 109.9 | 13.46 | 0.03 |
| 10.457 | 03.07 | 109.2 | 36.60 | 0.05 |
| 10.457 | 03.07 | 107.2 | 2.39 | 0.03 |
| 10.296 | 02.42 | 106.6 | 36.74 | 0.04 |
| 10.223 | 04.28 | 105.9 | 0.44 | 0.02 |
| 10.362 | 01.93 | 105.9 | 0.93 | 0.02 |
| 09.800 | 05.74 | 104.6 | 1.32 | 0.02 |
| 10.456 | 03.07 | 104.0 | 1.17 | 0.02 |
| 10.457 | 03.07 | 100.0 | 10.81 | 0.03 |
| 09.802 | 05.73 | 99.3 | 0.54 | 0.03 |
| 10.457 | 03.06 | 97.4 | 0.77 | 0.04 |
| 10.353 | 01.95 | 95.4 | 1.81 | 0.02 |
| 10.250 | 04.64 | 93.4 | 0.52 | 0.02 |
| 10.313 | 01.32 | 90.8 | 4.32 | 0.02 |
| 10.352 | 01.95 | 88.8 | 1.64 | 0.02 |
| 10.386 | 01.56 | 88.8 | 1.26 | 0.02 |
| 10.250 | 04.64 | 88.8 | 0.96 | 0.02 |
| 10.314 | 01.32 | 86.2 | 0.95 | 0.03 |
| 10.385 | 01.56 | 85.5 | 40.63 | 0.04 |
| 10.354 | 01.71 | 82.9 | 0.56 | 0.02 |
| 10.315 | 00.81 | 81.2 | 1.88 | 0.02 |
| 10.382 | 02.76 | 79.9 | 10.07 | 0.03 |
| 10.354 | 01.90 | 79.2 | 10.06 | 0.03 |
| 10.460 | 03.03 | 77.9 | 1.45 | 0.04 |
| 10.347 | 01.57 | 77.2 | 5.60 | 0.04 |
| 10.382 | 02.76 | 77.2 | 16.16 | 0.04 |
| 10.346 | 00.59 | 75.9 | 6.12 | 0.07 |
| 10.382 | 02.76 | 75.3 | 36.47 | 0.08 |
| 10.295 | 01.37 | 75.3 | 7.81 | 0.08 |
| 10.336 | 01.81 | 74.6 | 29.41 | 0.06 |
| 10.360 | 01.18 | 74.0 | 4.44 | 0.06 |
| 10.388 | 04.25 | 72.6 | 19.85 | 0.08 |
| 10.457 | 03.06 | 72.0 | 8.3 | 0.2 |
| 10.324 | 01.33 | 72.0 | 31.9 | 0.2 |
| 10.303 | 01.76 | 72.0 | 7.1 | 0.2 |
| 10.371 | 01.59 | 72.0 | 143.0 | 0.2 |
| 10.290 | 01.42 | 70.0 | 14.6 | 0.4 |
| 10.458 | 03.06 | 68.7 | 10.6 | 0.2 |
| 10.310 | 01.69 | 68.7 | 13.8 | 0.2 |
| 10.377 | 01.62 | 68.0 | 366.1 | 0.4 |
| 10.312 | 01.39 | 67.4 | 50.9 | 0.3 |
| 10.301 | 01.65 | 65.4 | 132.4 | 0.2 |
| 10.313 | 01.46 | 64.1 | 272.7 | 0.3 |
| 10.314 | 01.36 | 60.8 | 126.3 | 0.3 |
| 10.360 | 01.09 | 60.1 | 12.4 | 0.1 |
| 10.315 | 01.86 | 59.5 | 5.35 | 0.10 |
| 10.348 | 00.58 | 58.8 | 2.11 | 0.09 |
| 10.313 | 01.43 | 58.1 | 78.8 | 0.1 |
| 10.327 | 02.13 | 56.8 | 2.7 | 0.2 |
| 10.363 | 01.34 | 56.5 | 47.4 | 0.3 |
| 10.303 | 00.65 | 54.5 | 15.8 | 0.2 |
| 10.355 | 01.56 | 53.8 | 7.1 | 0.2 |
| 10.303 | 00.66 | 53.2 | 13.1 | 0.2 |
| 10.356 | 01.52 | 51.2 | 3.45 | 0.13 |
| 10.462 | 01.05 | 49.2 | 9.26 | 0.10 |
| 10.357 | 01.39 | 46.6 | 9.65 | 0.12 |
| 10.354 | 02.21 | 34.1 | 5.64 | 0.08 |
| 10.249 | 02.75 | 33.4 | 3.33 | 0.10 |
| 10.312 | 01.24 | 32.1 | 2.40 | 0.08 |
| 10.323 | 01.18 | 29.1 | 1.41 | 0.12 |
| 10.369 | 02.67 | 17.9 | 3.38 | 0.33 |
| 10.308 | 00.74 | 14.6 | 0.90 | 0.02 |
| 10.371 | 02.65 | 13.3 | 1.47 | 0.03 |
| 10.366 | 01.47 | 12.6 | 0.83 | 0.02 |
| 09.758 | 00.64 | -13.4 | 4.95 | 0.02 |
Note. — Relative positional errors are 0005 in and . Absolute errors are 005.
| (s) | (′′) | Flux Density | Error | |
|---|---|---|---|---|
| 17h44m (B1950) | -28o21′(B1950) | (km s-1) | (Jy) | (Jy) |
| 10.044 | 15.24 | 119.8 | 2.19 | 0.03 |
| 10.064 | 16.83 | 116.5 | 6.51 | 0.04 |
| 09.924 | 14.54 | 115.8 | 4.85 | 0.04 |
| 10.071 | 15.21 | 114.5 | 2.05 | 0.02 |
| 10.087 | 15.34 | 110.5 | 1.27 | 0.03 |
| 10.162 | 15.84 | 105.3 | 1.60 | 0.03 |
| 10.089 | 16.67 | 103.3 | 0.63 | 0.02 |
| 10.089 | 16.68 | 99.3 | 16.37 | 0.07 |
| 10.089 | 16.68 | 98.0 | 19.91 | 0.08 |
| 10.161 | 15.85 | 97.4 | 9.14 | 0.08 |
| 10.083 | 15.30 | 94.7 | 6.14 | 0.04 |
| 10.073 | 15.24 | 94.1 | 9.91 | 0.05 |
| 10.089 | 16.68 | 92.1 | 7.57 | 0.04 |
| 10.067 | 15.20 | 87.5 | 17.51 | 0.07 |
| 10.069 | 15.18 | 84.5 | 1.81 | 0.03 |
| 10.118 | 16.45 | 84.2 | 0.54 | 0.03 |
| 10.155 | 16.99 | 83.2 | 8.37 | 0.05 |
| 10.082 | 15.39 | 83.2 | 2.25 | 0.05 |
| 10.071 | 15.14 | 82.5 | 3.09 | 0.04 |
| 09.984 | 15.81 | 81.2 | 3.07 | 0.03 |
| 09.917 | 15.28 | 79.9 | 3.22 | 0.04 |
| 10.070 | 15.22 | 77.9 | 5.28 | 0.05 |
| 10.116 | 16.44 | 76.6 | 3.56 | 0.07 |
| 10.092 | 16.46 | 76.6 | 5.43 | 0.07 |
| 10.131 | 11.18 | 75.3 | 1.98 | 0.10 |
| 10.039 | 10.54 | 75.3 | 8.40 | 0.10 |
| 10.067 | 15.19 | 74.0 | 3.13 | 0.11 |
| 10.131 | 17.01 | 74.0 | 17.0 | 0.1 |
| 10.039 | 10.56 | 74.0 | 12.4 | 0.1 |
| 10.405 | 17.79 | 73.3 | 27.6 | 0.1 |
| 10.294 | 16.82 | 71.3 | 24.3 | 0.2 |
| 10.405 | 17.79 | 70.7 | 23.0 | 0.2 |
| 10.146 | 16.95 | 69.3 | 33.5 | 0.4 |
| 10.293 | 16.82 | 68.0 | 73.6 | 0.5 |
| 10.135 | 13.10 | 66.0 | 3.6 | 0.3 |
| 10.296 | 17.60 | 65.4 | 3.3 | 0.3 |
| 09.467 | 12.36 | 65.4 | 4.4 | 0.3 |
| 10.017 | 13.55 | 64.1 | 38.7 | 0.3 |
| 10.293 | 16.83 | 62.8 | 18.1 | 0.3 |
| 10.143 | 16.94 | 62.1 | 12.5 | 0.4 |
| 10.065 | 15.31 | 61.4 | 172.9 | 0.7 |
| 10.293 | 16.79 | 59.5 | 2.2 | 0.1 |
| 10.140 | 16.94 | 59.5 | 16.0 | 0.1 |
| 10.063 | 15.36 | 57.1 | 5.1 | 0.4 |
| 10.150 | 16.86 | 56.5 | 160.2 | 0.6 |
| 10.074 | 10.70 | 56.5 | 19.2 | 0.6 |
| 10.203 | 14.67 | 55.8 | 67.5 | 0.5 |
| 10.146 | 16.90 | 55.1 | 131.9 | 0.5 |
| 10.155 | 15.80 | 54.5 | 6.5 | 0.4 |
| 10.157 | 16.19 | 53.8 | 7.1 | 0.3 |
| 10.292 | 16.92 | 53.8 | 6.0 | 0.3 |
| 10.140 | 16.97 | 53.2 | 126.2 | 0.5 |
| 10.151 | 16.24 | 51.9 | 6.5 | 0.3 |
| 10.068 | 15.40 | 49.9 | 59.1 | 0.3 |
| 10.161 | 15.83 | 48.6 | 3.9 | 0.2 |
| 10.140 | 16.97 | 47.9 | 41.7 | 0.2 |
| 10.068 | 15.40 | 45.9 | 73.2 | 0.3 |
| 10.158 | 16.18 | 45.3 | 4.7 | 0.1 |
| 10.114 | 16.66 | 44.0 | 4.6 | 0.1 |
| 10.138 | 16.98 | 43.3 | 34.2 | 0.1 |
| 10.093 | 16.63 | 42.6 | 3.54 | 0.08 |
| 10.139 | 16.98 | 40.7 | 29.1 | 0.1 |
| 10.114 | 16.65 | 40.0 | 5.10 | 0.08 |
| 10.092 | 16.62 | 38.0 | 21.5 | 0.1 |
| 10.136 | 17.11 | 37.4 | 54.5 | 0.2 |
| 10.072 | 16.83 | 35.4 | 7.19 | 0.10 |
| 10.137 | 17.15 | 33.4 | 62.2 | 0.2 |
| 10.136 | 17.15 | 32.1 | 52.2 | 0.2 |
| 10.142 | 17.12 | 27.8 | 108.6 | 0.4 |
| 10.143 | 17.13 | 22.5 | 27.9 | 0.1 |
| 10.047 | 10.57 | 21.2 | 1.63 | 0.05 |
| 10.078 | 16.78 | 20.5 | 8.59 | 0.08 |
| 10.143 | 17.13 | 19.9 | 21.16 | 0.08 |
| 10.142 | 17.11 | 18.6 | 24.33 | 0.08 |
| 10.100 | 16.51 | 17.9 | 3.11 | 0.06 |
| 10.134 | 16.13 | 13.3 | 9.14 | 0.04 |
| 10.124 | 16.28 | -12.1 | 0.49 | 0.02 |
| 10.122 | 16.29 | -14.1 | 0.42 | 0.03 |
| 10.092 | 16.57 | -16.1 | 0.38 | 0.03 |
Note. — Relative positional errors are 0005 in and . Absolute errors are 005.
| (s) | (′′) | Flux Density | Error | |
|---|---|---|---|---|
| 17h44m (B1950) | -28o21′(B1950) | (km s-1) | (Jy) | (Jy) |
| 09.972 | 37.60 | 117.8 | 1.81 | 0.02 |
| 09.972 | 37.60 | 106.6 | 1.36 | 0.04 |
| 09.972 | 37.60 | 100.0 | 2.86 | 0.03 |
| 10.259 | 38.47 | 88.1 | 1.55 | 0.03 |
| 10.259 | 38.46 | 83.8 | 1.87 | 0.03 |
| 09.971 | 37.60 | 69.3 | 3.8 | 0.3 |
| 10.263 | 38.44 | 64.7 | 8.1 | 0.2 |
| 10.263 | 38.44 | 62.1 | 24.4 | 0.3 |
| 10.038 | 37.70 | 60.1 | 4.2 | 0.2 |
| 10.074 | 37.91 | 59.5 | 19.0 | 0.1 |
| 10.253 | 38.48 | 57.8 | 3.7 | 0.2 |
| 10.035 | 37.73 | 57.5 | 108.1 | 0.3 |
| 09.977 | 37.64 | 41.3 | 2.22 | 0.05 |
| 09.986 | 37.58 | 23.8 | 0.78 | 0.04 |
Note. — Relative positional errors are 0005 in and . Absolute errors are 005.
| (s) | (′′) | Flux Density | Error | |
|---|---|---|---|---|
| 17h44m (B1950) | -28o22′(B1950) | (km s-1) | (Jy) | (Jy) |
| 09.949 | 41.20 | 82.8 | 0.29 | 0.02 |
| 09.951 | 41.18 | 73.3 | 10.4 | 0.1 |
| 10.671 | 42.87 | 72.0 | 2.7 | 0.2 |
| 10.580 | 45.22 | 70.0 | 69.3 | 0.3 |
| 10.672 | 43.02 | 68.7 | 20.8 | 0.2 |
| 10.793 | 43.26 | 66.7 | 4.3 | 0.2 |
| 10.672 | 43.01 | 66.0 | 20.0 | 0.2 |
| 10.567 | 45.27 | 66.0 | 3.1 | 0.2 |
| 10.673 | 43.03 | 63.4 | 17.2 | 0.2 |
| 10.568 | 45.23 | 62.1 | 4.5 | 0.2 |
| 09.949 | 41.11 | 59.5 | 27.5 | 0.1 |
| 09.953 | 41.22 | 56.5 | 42.0 | 0.3 |
| 09.950 | 41.17 | 53.2 | 11.8 | 0.3 |
| 09.951 | 41.16 | 51.9 | 14.2 | 0.2 |
| 09.951 | 41.16 | 49.9 | 11.7 | 0.2 |
| 09.958 | 41.01 | 13.3 | 0.37 | 0.03 |
| 09.959 | 41.01 | 3.4 | 0.52 | 0.03 |
Note. — Relative positional errors are 0005 in and . Absolute errors are 005.