eurm10 \checkfontmsam10 \pagerange
A note on Temperature Profiles of rich Clusters of Galaxies
Abstract
We derive here the mean temperature profile for a sample of hot, medium distant clusters recently observed with XMM-Newton, whose profiles are available from the literature, and compare it with the mean temperature profile found from BeppoSAX data. The XMM-Newton and BeppoSAX profiles are in good agreement between 0.05 and 0.25 . From 0.25 to about 0.5 both profiles decline, however the BeppoSAX profile does so much more rapidly than the XMM-Newton profile.
1 Introduction
Temperature profiles of galaxy clusters are of great importance for two main reasons: firstly they allow us to measure the total mass of these systems through the hydrostatic equilibrium equation and secondly they provide informations on the thermodynamic state of the Intra Cluster Medium (hereafter ICM).
Measurements of temperature profiles have been performed with the the first generation of X-ray satellites carrying telescopes operating in the medium energy band (2-10 keV), namely ASCA and BeppoSAX. A detailed description of results obtained with these experiments may be found in De Grandi & Molendi (2002) and refs. therein.
In the last 3 years various authors have published XMM-Newton temperature profiles of individual clusters. Arnaud et al. (2003) with a sample of 7 objects comprising 5 clusters and 2 groups find that the temperature profiles are essentially isothermal within , and possibly declining at larger radii, where the statistics is rather limited. Recently, Zhang et al. (2003) have published temperature profiles for a sample of 9 clusters, in the outer regions they find both flat and strongly decreasing profiles, however they do not provide a mean temperature profiles of their sample. In this note we derive the mean temperature profile for a sample of hot, medium distant clusters whose profiles are available from the literature and compare it with our mean BeppoSAX profile.
2 XMM-Newton sample selection from the literature
We have selected from the literature all hot (i.e. kT keV) clusters in the redshift range between 0.1 and 0.3 with an available projected radial temperature profile. The resulting sample comprises a total of 15 clusters: 9 REFLEX clusters at redshift (Zhang et al. 2003), A1413 at z=0.143 (Pratt & Arnaud 2002), A2163 at z=0.201 (Pratt et al. 2001), A1835 at z=0.250 (Majerovitz et al. 2002), PKS 0745191 at z=0.1028 (Chen et al. 2003), ZW 3146 at z=0.291 and E1455223 at z=0.258 both taken from Mushotzky (2003). The adopted redshift range allows us to compare the temperature profiles measured from XMM-Newton data with those derived from BeppoSAX observations. The profiles published for the clusters in the XMM-Newton sample extend out to from the core, corresponding to physical radii of Mpc (H km s-1 Mpc-1). The same physical radii are reached by BeppoSAX observations of clusters laying in the redshift range and detected out to (see De Grandi & Molendi 2002). The average cluster temperature of the XMM-Newton sample is 7 keV, very similar to that of the BeppoSAX sample ( keV). We have converted all temperature uncertainties at the 90% confidence level into errors at the 68% c.l. by dividing them by the scaling factor 1.65. For each cluster we have computed the virial radius () from the relation derived by Evrard et al. (1996): using published cluster mean temperatures and redshifts.
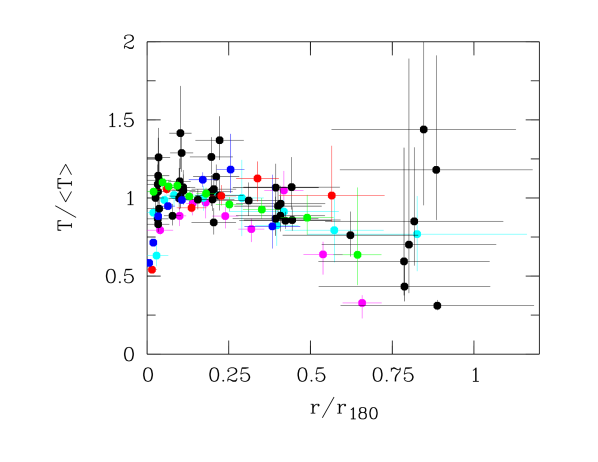
Visual inspection of Fig.1, where we report the individual XMM-Newton temperature profiles, shows that the profiles are about isothermal from 0.10 to ; beyond there seems to be a decline. It is also clear that points at are heavily fluctuating and tend to have larger errors.
We have modelled the XMM-Newton profiles in Fig. 1 with a power law and converted the slope into the polytrophic gas index accordingly to the calculation reported in the appendix of De Grandi & Molendi (2002). In the range we have obtained a polytrophic index , which is close to the isothermal value 1. Whereas, for r we have found , which is formally above the adiabatic limit of 5/3, although consistent at the 68% confidence level with values below 5/3. The drop in the profiles at 0.55 r180 (clearly visible in Fig. 2) highlights a possible problem in the XMM-Newton profiles.
3 The mean profile
The binned error-weighted average temperature profile computed from the 15 clusters is shown in Fig. 2, where we also plot the BeppoSAX cool core and non cool core clusters profiles (see De Grandi & Molendi 2002 for details). We have added here to the BeppoSAX cool core clusters the Ophiuchus cluster.
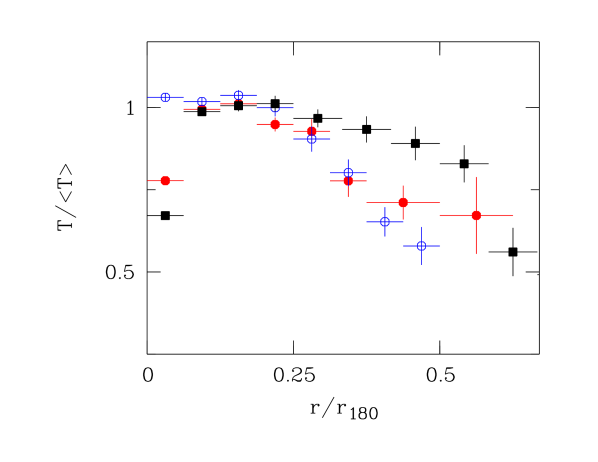
The XMM-Newton and BeppoSAX profiles are in good agreement between 0.05 and 0.25 . From 0.25 to about 0.5 both profiles decline, however the BeppoSAX profile does so more rapidly than the XMM-Newton profile. The presence of a temperature jump, at the limit of convective stability, at the largest radii explored with XMM-Newton, hints to a problem possibly related to the low signal-to-noise ratio of the outermost cluster regions and to the difficulties in operating a correct background subtraction (see Molendi these proceedings for a discussion of this issue).
References
- [] Arnaud, M., Pratt, G. W. & Pointecouteau, E. 2004, Mem. S.A.It. astro-ph/0312398.
- [] Chen, Y., Ikebe, Y. & Boehringer, H. 2003, A&A, 407, 41.
- [] De Grandi, S. & Molendi, S. 2002, ApJ, 567, 163.
- [] Majerowicz, S., Neumann, D. M. & Reiprich, T. H. 2002, A&A, 394, 77.
- [] Molendi, S. 2004, these proceedings.
- [] Mushotzky, R. F. 2003, astro-ph/0311105.
- [] Pratt, G. W. & Arnaud, M. 2002, A&A, 394, 375.
- [] Pratt, G. W. et al. 2001, Proc. of XXIth Moriond Astroph. Meeting, p.38.
- [] Zhang, Y.-Y., Finoguenov, A., Boehringer, H., et al. 2004, A&A, 413, 49.