STAR FORMATION IN GALAXY MERGERS:
Scaling up a universal process or a violent mode of SF?
I briefly review some measures of star formation rates in galaxies and discuss their respective uncertainties before outlining the range of star formation rates encountered in starbursts from isolated dwarf through massive gas-rich interacting systems. I present our current understanding of molecular cloud masses and structures and on star formation processes and efficiencies in starburst and interacting galaxies. Star cluster formation is an important mode of star formation, in particular in strong star formation regimes. I discuss the role of star clusters and their properties in helping us assess the question if star formation is a universal process allowing for considerable scaling or if there’s two different regimes for normal and violent SF.
Keywords: Stars: formation, Galaxies: evolution, formation, interactions, ISM, starburst, star clusters, globular clusters: general, open clusters and associations: general
1 Motivation
Despite considerable efforts by many researchers over more than 30 yr, the question if Star Formation (SF) is basically described by one universal process that can be scaled up and down considerably from lowest levels in dwarf and low surface brightness galaxies to extremely high levels observed in massive gas-rich interacting galaxies, ULIRGs, and SCUBA galaxies or if, on the other hand, there are two fundamentally different modes or processes of SF – violent as opposed to normal SF – still is one of the major unresolved issues in astrophysics.
2 Star Formation Rates: Measures and Regimes
2.1 Star Formation Rates: Measures and Limitations
In nearby galaxies, spirals, irregulars and starburst galaxies, SF Rates (SFRs) are conventionally derived from Hα or FIR luminosities using handy formulae like
that are valid for a Salpeter IMF from 0.1 through 100 , for constant or slowly varying SFRs and for metallicities close to solar.
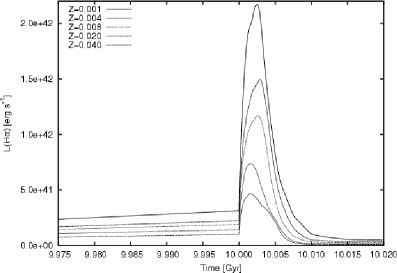
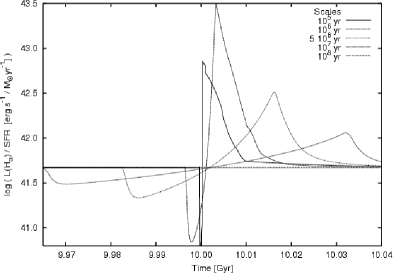
Our evolutionary synthesis models GALEV for galaxies or star clusters of various metallicities do include gaseous emission in terms of lines and continuum on the basis of the time evolving and metallicity-dependent summed-up Lyman continuum photon rate (Smith et al. 2002, Schaerer & de Koter 1997) from all the hot stars present in a cluster or a galaxy. While hydrogen emission line strengths are taken from photoionisation models, the line ratios of heavy element lines relative to for low metallicities are taken from empirical compilations by Izotov et al. (1994, 1997) and Izotov & Thuan (1998). Our models confirm the relations between H and [OII] line luminosities in normal SF regimes and show their limitations: 1) at significantly subsolar metallicities SFRs estimated from luminosities by the above formula are overestimated by factors for continuous SF regimes and by factors for starbursts. This is due to the fact that low-metallicity stars are hotter and have stronger ionising fluxes. 2) In case of SFRs fluctuating on short timescales ( yr) errors up to factors of 100 can arise. For short-timescale fluctuations of the SFR, as e.g. in dwarf galaxies and their starbursts as well as in SF regions/complexes within larger galaxies, the delay of the luminosity maximum with respect to the maximum of the SFR due to the fact that massive supergiants have even stronger ionising fluxes than their main sequence progenitors increases the errors in the SFRs estimated from beyond the metallicity effect discussed above. Fig. 1a shows the good agreement of our solar metallicity const. SF model with Kennicutt’s relation and the differences arising for metallicities other than solar. Starbursts with durations from to yr are put on top of the constant SFR models around ages of 10 Gyr. The rapid rise of the SFR is not immediately reflected in a corresponding increase in luminosity: the ratio of log( decreases by a factor up to 10 for the shortest burst before it strongly increases by a factor in the course of the burst and comes down to the pre-burst value after the burst (see Fig. 1b and Weilbacher & FvA 2001 for details).
SFRs of distant galaxies are often estimated from their [OII]3727 luminosities. The metallicity dependence of the [OII]3727line is twofold. [OII] fluxes depend on the oxyen abundance and, hence, increase with increasing metallicity of the ionised gas, and on the strength of the ionising flux that decreases with increasing metallicity. The combination of both effects accounts for a factor change in the transformation factor between and SFR (see also Weilbacher & FvA 2001).
SFRs are particularly meaningful if expressed in relation to galaxy masses. In normal SF mode, spiral galaxies with typical masses of order have global SFRs around . Irregular and dwarf irregular galaxies with masses in the range have SFRs of order . Starbursts in dwarf galaxies, e.g. Blue Compact Dwarf Galaxies (BCDGs) feature SFRs of order .
2.2 Burst Strengths
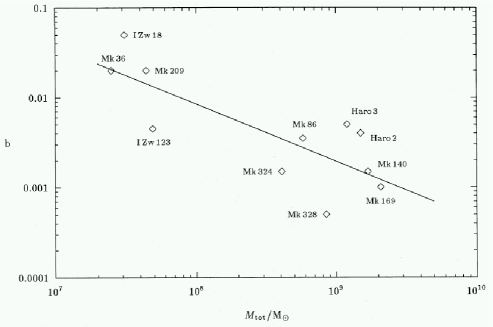
Bursts strengths – defined as the relative increase in stellar mass during the burst – in BCDGs have been shown by Krüger, FvA & Loose (1995) with evolutionary synthesis modelling compared to optical through NIR photometry to range from to , and to decrease with increasing total mass of the galaxy, including M(HI), as shown in Fig. 2, in agreement with expectations from stochastic self-propagating SF scenarios.
All of the starbursting dwarf galaxies we have analysed so far, however, are fairly isolated. Note that accurate burst strengths can only be given for systems at the end of the burst, i.e. for young post-starburst galaxies. As post-starbursts galaxies age, the precision to which burst strengths can be measured starts to decrease significantly as soon as the peak of the strong Balmer absorption line phase is over about 1 Gyr after the burst. For galaxies with ongoing starbursts only lower limits to the burst strength can be estimated.
Massive gas-rich interacting galaxies feature high and sometimes very high SFRs of order and up to for Luminous and Ultraluminous IR Galaxies, LIRGs and ULIRGs, in their global or nuclear starbursts which typically last over a few yr. Evolutionary synthesis modelling of post-starbursts in massive gas-rich spiral – spiral merger remnants like NGC 7252 have shown that these systems can also have tremendous bursts strengths that increase their stellar masses by and possibly up to 50% (FvA & Gerhard 1994a, b). Starbursts in massive interacting galaxies hence are completely off the burst strength – galaxy mass relation for starbursts in non-interacting dwarf galaxies. Whether this is due to the presence/absence of an external trigger or due to the difference in gravitational potential and dynamical timescale between dwarf and giant galaxies is an open question still. Careful analyses of dwarf – dwarf or giant – dwarf galaxy mergers should tell the difference.
2.3 Star Formation Efficiencies
Even under the most conservative assumptions – that the pre-merger spirals were drawn from the high end of their type-specific luminosity function and were particularly gas-rich for their type – the SF Efficiencies (SFEs), defined in terms of SFE:mass of stars/mass of gas available, in these cases must have been extremely high. For the global starburst happening slightly less than 1 Gyr ago during the merger of two bright gas-rich spirals now called NGC 7252, the analysis of the deep Balmer absorption line spectrum taken by F. Schweizer with our models indicated a SFE % – on a global scale (cf. FvA & Gerhard 1994a, b). This should be compared to the large-scale SFEs around % as determined for normal spiral and irregular galaxies and for starbursts in (isolated) dwarf galaxies.
Small scale SFEs in Milky Way Molecular Clouds (MCs) can be defined as the mass ratio of the core mass of a MC to its total mass, SFE:, and also have values in the range %. I.e., a very small mass fraction of order to few % of Galactic MCs has the high densities relevant for SF and makes up the cloud core.
On scales of pc, ULIRGs that all have been shown to be advanced stages of massive gas-rich galaxy mergers, feature SFEs in the range %. Their extremely strong nuclear starbursts are heavily dust-obscured, emitting the bulk of their bolometric luminosities at FIR wavelengths.
3 Molecular Clouds and Star Formation
3.1 Molecular Cloud Structure and Star Formation
In the Milky Way and nearby galaxies, molecular clouds are observed using sub-mm lines with different lines being tracers of molecular gas at different densities. The most often observed CO(10) line traces gas at densities , the HCN(10) line traces gas at , and the CS(10) line traces gas at . Within the Milky Way and the nearest Local Group galaxies detailed observations of MC complexes in these different lines allow to assess their internal structure. It is from this kind of observations that we know that MCs typically have much more than 90% of their mass in low density envelopes as traced by CO and only a few % in their high density cores as traced by HCN or CS. I.e., on small scales for Milky Way MCs
For galaxies beyond the Local Group, only integrated measures of luminosities in these different lines are possible and allow to estimate integrated mass ratios of molecular gas at various densities. On scales of 10300 pc it has been shown for ULIRGs that
suggesting that the MC structure in these massive gas-rich interacting galaxies with their tremendous starbursts is drastically different from the MC structure in the Milky Way or the Magellanic Clouds. The dynamical mass in the central regions of ULIRGs is dominated by the mass of molecular gas at densities of MC cores. This is, in fact, predicted by hydrodynamical simulations of gas-rich spiral – spiral mergers and necessary if these mergers are to result in elliptical galaxies. The molecular gas densities in the centers of ULIRGs are similar to the central stellar densities in giant ellipticals, their SFRs high enough to transform the gas into stars within the typical duration of a ULIRG phase ( yr). These apparent drastic differences in MC structure immediately raise the question if the SF process in massive gas-rich galaxy mergers, in particular in those going through a LIRG or ULIRG phase, can be the same as for the normal SF mode of undisturbed galaxies or for the mini-starbursts in BCDGs – as they appear in comparison to those in LIRGs or ULIRGs? A scenario where increased rates of cloud – cloud collisions are at the origin of the enhanced SF is hard to imagine in view of the fact that the core of Arp 220 on a scale of several 10 to 100 pc resembles one ultra-giant MC core of order (cf. FvA 1994).
Observationally, a very tight correlation between global SFRs measured from FIR luminosities and the total mass in MC cores measured in terms of HCNluminosities is found to hold for normal spirals as well as for the most extreme LIRGs and ULIRGs, i.e. over 4 orders of magnitude in terms of both total MC core masses and SFRs (Solomon et al. 1992, Gao & Solomon 2004). At the same time, the ratio between SFR as measured from LFIR and total MC core mass as measured by LHCN is roughly constant for all SFing galaxies from spirals through ULIRGs (Gao & Solomon 2004), indicating that the SF efficiency when referred not to HI but to the amount of dense molecular gas as traced by HCN or CS is constant over all the dynamical range.
For all galaxies (BCDGs … Irrs … spirals … ULIRGs), SF efficiencies quantitatively correspond to the ratio between the integrated mass of MC cores and the total mass of molecular gas. For BCDGs … spirals the total mass of molecular gas exceeds that of the MC cores by a factor , for ULIRGs both quantities are comparable. Hence, SFE M(MC core)/M(MC) or L(FIR) L(HCN, CS)/L(CO).
The widely used Schmidt (1959) law relates the SFR density to the neutral or molecular gas density to a power n with n for spirals, Irrs, and BCDGs, and n for ULIRGs and holds over 5 orders in gas surface density and 6 orders in SFR density.
When expressed in terms of high density gas traced by HCN or CS, the Schmidt law takes the form
with for all galaxies (spirals, . . ., ULIRGs) and all SF regimes, as also shown by Gao & Solomon (2004).
In the course of mergers among gas-rich galaxies, hydrodynamic models (SPH) as well as sticky particle codes predict strongly enhanced collision rates among MCs that push up their SFRs. Models also predict that shock compression of MCs should significantly raise SF efficiencies to values , already for small overpressures in the intercloud medium (Jog & Das 1992, 1996). Strong burst SFRs require not only pre-existing MCs to be efficiently transformed into stars but also the fast transformation of HI into molecular gas. McKee & Ostriker (1977) have shown that shocks are very efficient in promoting the transformation of HI, leaving the ISM behind strong shocks almost fully molecular.
It hence appears that once gas is compressed to MC core densities, it is with almost 100 % efficiency transformed into stars. The process that determines the SF timescale and the SF efficiency seems to be the compression of gas to these high densities. And this process, in turn, is apparently slow and has low efficiency in non-interacting spirals, irregulars and even starbursting dwarfs, while fast and very efficient in massive gas-rich interacting galaxies.
3.2 Molecular Cloud Mass Spectra
In spiral and irregular galaxies and normal SF mode MCs, their cores, and ultimately even the star clusters that form from them, all feature similar mass spectra that are power laws with index .
Largely unexplored at present are the mass spectra of MCs and MC cores in strongly interacting galaxies due to the large distance of those systems. A first attempt in this direction is presented by Wilson et al. (2003) for the Antennae galaxy pair NGC 4038/39 at a distance of 15 Mpc, an ongoing merger of two Sc-type spirals as estimated from the HI-richness of their long tidal tails. NGC 4038/39 is a LIRG with the most vigorous SF going on in the overlap region between the two disks and huge amounts of star cluster formation. Ground- and space-based observations over a large wavelength range as well as extensive dynamical modelling is available for the Antennae galaxies, the youngest system in Toomre & Toomre’s (1972) age sequence of interacting galaxies. Wilson et al. find the mass spectrum of MCs in the Antennae to obey a power-law with m in the range in the accessible mass range from to . The mass range below as well as the mass spectrum of MC cores remain inaccessible to present-day instrumentation. Although this slope is slightly flatter than for MC mass spectra in non-interacting galaxies, it is not clear yet, if the MC mass spectrum in the Antennae is really enhanced in massive MCs due to the high ambient pressure as could be expected from the above-quoted models.
4 Star Cluster Formation
Star cluster formation is an important mode of SF, in particular in starbursts. % of the UV luminosity of starburst galaxies is accounted for by Star Clusters, and the contribution of star clusters to the total UV luminosity seems to increase with increasing UV surface brightness (Meurer et al. 1995).
Star clusters observed with HST in a large number of interacting and merging galaxies and young merger remnants seem to span the full range from low mass clusters () through high and very high mass clusters (), from weakly bound, short-lived clusters similar to the open clusters in nearby galaxies all through strongly bound and long-lived clusters analoguous to Globular Clusters.
It has been predicted by hydrodynamical cluster formation models that the formation of strongly bound and hence long-lived clusters requires very high SF efficiencies % (Brown et al. 1995), and is therefore generally not possible during normal SF in spiral or irregular galaxies, nor in the mini-starbursts in BCDGs.
The very existence of a large number of massive compact star clusters in the relatively old spiral – spiral merger remnant NGC 7252, in which a very strong burst ended more than Myr ago, proves that these clusters must be very strongly bound – like Globular Clusters – as they survived for that span of time in an environment where violent relaxation has been strong enough to transform the two spiral disks into an elliptical-like object with an light profile (Schweizer 2002).
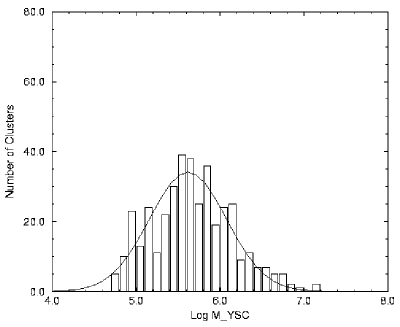
In the Antennae NGC 4038/39 we have analysed the 550 star clusters that have been detected in V and I with HST WFPC1 by Whitmore & Schweizer (1995) with our GALEV models and derived ages from their V-I colors under the assumption that they have around half-solar metallicity – as expected if they form from the ISM of Sc spirals and confirmed by spectroscopy of the brightest of them by Whitmore et al. (1999). We found 480 of them to have ages yr and 70 to be fiducially old Globular Clusters inherited from the progenitor galaxies (FvA 1998). We followed their evolution with our GALEV evolutionary synthesis models and showed that – provided they would all survive – they would develop a color distribution with the same width but somewhat redder, due to their enhanced metallicity, as those of metal-poor GCs and a Gaussian shape Luminosity Function (LF) typical of old GC systems despite the fact that their observed LF is a power law. It is the age spread among the young star clusters, that is comparable to their age, in conjunction with the rapid luminosity evolution during these young ages and with the observational completeness limit that causes this apparent distortion in the LF. In FvA (1999) we derived masses from ages and model M/L-ratios for all the clusters and found the Mass Function (MF) of the young star cluster system to be a Gaussian with and very similar to that of GCs in the Milky Way and M31 with , and , , respectively (cf. Ashman et al. 1995).
The major drawback in our analysis was our assumption of a uniform reddening for all young clusters lack of more detailed information about individual clusters. Zhang & Fall (1999) used reddening-free Q-parameters for their analysis of the same data and found a power-law mass function. The major drawback in their analysis was that they had to exclude an important fraction of clusters for which the Q-parameters did not yield an unambiguous age. Excluding this age group of clusters in our models also leads to a power-law MF. Hence, till today, the MF of young star clusters forming in merger-induced starburst is controversial. A multi-wavelength analysis should allow to independently determine metallicities, ages, extinction values, and masses of all the young star clusters provided accurate photometry in at least 4 reasonably spaced passbands is available, as shown by Anders et al. (2004a), and is currently underway using HST WFPC2, NICMOS and VLT data provided by our ASTROVIRTEL project (PI R. de Grijs).
The question is if and to what percentage the young star clusters copiously formed in galaxy mergers are open clusters or GCs and if they split into these two distinct classes of objects or if there is a continuum extending from losely bound and low-mass open clusters to strongly bound and high-mass GC. Key issues for this question are their mass range, their MF and their compactness. Size determinations for young star clusters require a careful analysis: small clusters are barely resolved even in the closest interacting systems, the galaxy background is bright and varies on small scales, and some clusters do not (yet?) seem to be tidally truncated, i.e. cannot be described by King models. The degree of internal binding, i.e. the ratio between mass and radius, however, is a key parameter for survival or destruction of a cluster in the violently changing environment of the merging and relaxing galaxy.
4.1 Globular Cluster Formation
GC formation requires extremely high SF efficiencies. It happened in the Early Universe and it apparently happens today in the strong starbursts accompanying the mergers of massive gas-rich galaxies. If it also happens in non-interacting massive starburst galaxies or in dwarf galaxy starbursts is an open question.
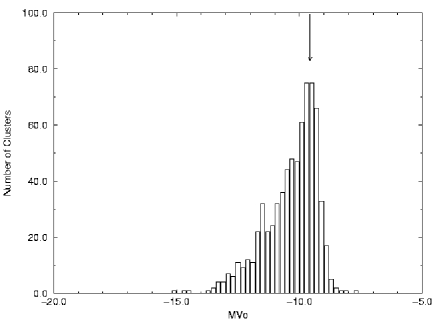
Our investigation of star clusters in the dwarf starburst galaxy NGC 1569, that was known before to host 3 super star clusters, revealed young star clusters with good photometry in many bands in our ASTROVIRTEL data base. Analysis of their Spectral Energy Distributions (SEDs) in comparison with a large grid of GALEV models for star clusters with various metallicities and dust extinctions by means of a dedicated SED Analysis Tool yielded individual clusters ages – all Myr –, metallicities, extinction values, and masses. As seen in Fig. 4, masses of all but 3 of these clusters turn out to be lower and most in fact much lower – of order – than those of GCs in the Milky Way despite their high luminosities that are due to their very young ages (Anders et al. 2004b).
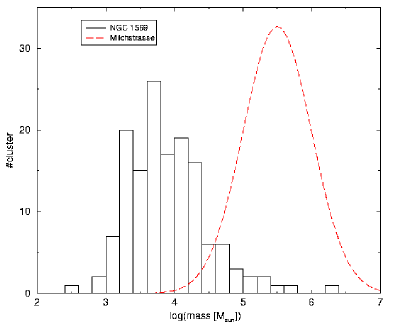
Hence, with maybe 2 or 3 exceptions – depending on a careful determination of their sizes –, the rich bright young cluster population in the dwarf starburst galaxy NGC 1569 does not seem to comprise any young GCs, most of its low-mass clusters will probably not survive the next Gyr. This raises the question why GCs do not form in dwarf galaxy starbursts. Why are SF efficiencies low in dwarf starbursts as already found for BCDGs many years ago? Because of the short dynamical timescales or the shallower potential in dwarf galaxies or because of a lack of ambient pressure in these non-interacting galaxies as compared to massive interacting galaxies? An answer should be provided by careful analyses of the starburst and star cluster properties in dwarf – dwarf galaxy mergers.
4.2 Star Cluster vs. Field Star Formation
An intriguing example of episodes with and without cluster formation is provided by the LMC. It shows a clear gap in terms of star cluster ages (Rich et al. 2001) with no clusters in the age range from 4 – 10 Gyr. This gap, however, is not seen in field star ages and the metallicity apparently has also increased continuously over the cluster age gap. Star cluster formation epochs coincided with epochs of enhanced field star formation, probably associated with close encounters between the LMC and the Milky Way.
5 Conclusions and Open Questions
I have shown that global galaxy-wide SFRs span a huge range, even in relation to galaxy mass, from normal low-level SF in undisturbed disk galaxies to the extremely high SFRs in massive gas-rich interacting galaxies, ULIRGs, and SCUBA galaxies.
I cautioned that SFR estimates from H or O[II] luminosities are only valid for metallicities close to solar and for SFR fluctuations on timescales yr, hence not for dwarf galaxy starbursts, nor for SFing regions on subgalactic scales.
Concerning SF efficiencies, there is a clear dichotomy between normal galaxies and dwarf galaxy starbursts on the one hand and starbursts in massive interacting gas-rich galaxies on the other hand, with SFEs differing by factors 10100 between them. It apparently originates in a similar dichotomy for the integrated mass ratio between molecular gas at low densities as traced by CO and the high density molecular gas of MC cores as traced by HCN or CS with the ratio differing by the same factor 10100. The key process determining the SF efficiency seems to be compression of molecular gas to MC core densities. Once this is accomplished, the high density MC core material is transformed into stars with very high efficiency – in fact with the same efficiency in normal, starburst, and ULIRG galaxies.
The causes of these differences are not clearly identified yet. They could be differences in the dynamical timescales, in the depth of the potential or the dynamics of a merger. Detailed investigations into the starburst and its star and cluster formation in a dwarf – dwarf galaxy merger should tell.
While it will not be possible to resolve the masses of MCs and MC cores down to interesting values before ALMA – not even for the closest interacting galaxies, the comparison of integrated luminosities in lines tracing molecular gas at various densities should already yield interesting clues to the molecular cloud structure in various kinds of starbursts.
Star cluster formation is an important and sometimes dominant mode of SF. It is not clear yet if the mass ratio between SF going into field stars and SF going into star cluster formation – and, in particular, into the formation of compact massive long-lived GCs – scales with the strength of SF or burst, or with the SF efficiency. A comparative investigation of integrated starburst properties and those of the young star cluster populations should help.
A third dichotomy, probably related to the other two, was found concerning GC formation. While GC formation apparently is possible and wide-spread in high SF efficiency situations as in the Early Universe or in massive gas-rich spiral – spiral mergers, it does not seem to be possible, or at least not frequent, in isolated dwarf galaxy starbursts.
The age and metallicity distributions of GC (sub-)populations contain valuable information about the violent (star) formation histories of their parent galaxies and can reasonably be disentangled by means of multi-wavelength SED analyses.
Acknowledgments
I thank the organisers and the DFG (Fr 916/11-1) for partial travel support and gratefully acknowledge very efficient support from the ASTROVIRTEL team (project funded by the European Comm. under FP5 HPRI-CT-1999-00081).
References
References
- [1] Anders, P. & Fritze – v. Alvensleben, U., 2003, A&A 401, 1063
- [2] Anders, P., Bissantz, N., Fritze – v. Alvensleben, U., de Grijs, R., 2004a, MN 347, 196
- [3] Anders, P., de Grijs, R., Fritze – v. Alvensleben, U., Bissantz, N., 2004b, MN 347, 17
- [4] Ashman, K. M., Conti, A., Zepf, S. E., 1995, AJ 110, 1164
- [5] Brown, J. H., Burkert, A., Truran, J. W., 1995, ApJ 440, 666
- [6] Fritze – v. Alvensleben, U., 1994, in Violent Star Formation, ed. G. Tenorio – Tagle, Cambridge Univ. Press, p. 249
- [7] Fritze – v. Alvensleben, U., 1998, A&A 336, 83
- [8] Fritze – v. Alvensleben, U., 1999, A&A 342, L25
- [9] Fritze – v. Alvensleben, U., 2004, A&A 414, 515
- [10] Fritze – v. Alvensleben, U. & Gerhard, O. E., 1994a, A&A 285, 751
- [11] Fritze – v. Alvensleben, U. & Gerhard, O. E., 1994b, A&A 285, 775
- [12] Gao, Y. & Solomon, P. M., 2004, ApJS 152, 63
- [13] Izotov, Y. I., Thuan, T. X., Lipovetsky, V. A., 1994, ApJ 435, 647
- [14] Izotov, Y. I., Thuan, T. X., Lipovetsky, V. A., 1997, ApJS 108, 1
- [15] Izotov, Y. I., Thuan, T. X., 1998, ApJ 500, 188
- [16] Jog, C. J., Das, M., 1992, ApJ 400, 476
- [17] Jog, C. J., Das, M., 1996, ApJ 474, 797
- [18] Kennicutt, R. C., 1998, ARAA 36, 189
- [19] Krüger, H., Fritze – v. Alvensleben, U., Loose, H.-H., 1995, A&A 303, 41
- [20] McKee, C. F., Ostriker, J. P., 1977, ApJ 218, 148
- [21] Meurer, G. R., Heckman, T. M., Leitherer, C., Kinney, A., Robert, C., Garnett, D. R., 1995, AJ 110, 2665
- [22] Rich, R. M., Shara, M. M., Zurek, D., 2001, AJ 122, 842
- [23] Schaerer, D., de Koter, A., 1997, A&A 322, 598
- [24] Schmidt, M., 1959, ApJ 129, 243
- [25] Schweizer, F., 2002, IAU Symp. 207, 630
- [26] Smith, L. J., Norris, R. P. F., Crowther, P. A., 2002, MN 337, 1309
- [27] Solomon, P. M., Downes, D., Radford, S. J. E., 1992, ApJ 387, L55
- [28] Toomre, A. & Toomre, J., 1972, ApJ 178, 623
- [29] Weilbacher, P. & Fritze – v. Alvensleben, U., 2001, A&A 373, L9
- [30] Whitmore, B. C. & Schweizer, F., 1995, AJ 109, 960
- [31] Whitmore, B. C., Zhang, Q., Leitherer, C., Fall, S. M., Schweizer, F., Miller, B. W., 1999, AJ 118, 1551
- [32] Wilson, C. D., Scoville, N., Madden, S. C., Charmandaris, V., 2003, ApJ 599, 1049
- [33] Zhang, Q. & Fall, S. M., 1999, ApJ 527, L81