Identification of neon in FUSE and VLT spectra of extremely hot hydrogen-deficient (pre-) white dwarfs††thanks: Based on observations made with the NASA-CNES-CSA Far Ultraviolet Spectroscopic Explorer. FUSE is operated for NASA by the Johns Hopkins University under NASA contract NAS5-32985. ††thanks: Based on observations at the Paranal Observatory of the European Southern Observatory for programs No. 165.H-0588(A), 167.D-0407(A), and 69.D-0719(A).
One of the strongest absorption lines observed in far-ultraviolet FUSE spectra of many PG1159 stars remained unidentified up to now. We show that this line, located at 973.3Å, stems from Ne vii. We also present new optical high-resolution spectra of PG1159 stars, obtained with the ESO VLT, which cover the Ne vii 3644Å line and a newly identified Ne vii multiplet in the 3850–3910Å region. We compare the observed neon lines with NLTE models and conclude a substantial neon overabundance in a number of objects. Although a detailed analysis is still to be performed in order to compare quantitatively the abundances with evolutionary theory predictions, this corroborates the idea that the PG1159 stars and their immediate progenitors, the [WC]-type nuclei of planetary nebulae, display intershell matter of their precursor AGB stars. Possibly as the consequence of a late He-shell flash, H-deficient and (s-processed) Fe-depleted matter, that is strongly enriched by 3-processed elements (C, O, Ne), is dredged up to the surface. Hence, a detailed study of the element abundance patterns in these peculiar stars gives the unique possibility to probe mixing and nucleosynthesis processes in the precursor AGB stars.
Key Words.:
stars: abundances – stars: atmospheres – stars: evolution – stars: AGB and post-AGB – stars: white dwarfs1 Introduction
The PG1159 stars are hot hydrogen-deficient (pre-) white dwarfs (=75 000–200 000 K, =5.5–8 [cgs]; Werner 2001). They are probably the outcome of a late helium-shell flash, a phenomenon that drives the currently observed fast evolutionary rates of three well-known objects (FG Sge, Sakurai’s object, V605 Aql). Flash-induced envelope mixing produces a H-deficient stellar surface. The photospheric composition then essentially reflects that of the region between the H-and He-burning shells in the precursor AGB star. The He-shell flash transforms the star back to an AGB star and the subsequent, second post-AGB evolution explains the existence of Wolf-Rayet central stars of planetary nebulae and their successors, the PG1159 stars.
The detection of a Ne vii line at 3644Å in three PG1159 stars (RX J2117.1$+$3412, NGC 246, K1$-$16; Werner & Rauch 1994, WR94) and the derived, high abundance of Ne=2% (by mass; i.e. 20 times solar) strengthened the view that these stars display intershell matter strongly enriched by Ne from 3 burning. The next positive result of a search for neon was obtained from EUVE spectra of H1504$+$65, which showed that very strong and broad Ne vii and O vi lines dominate the soft X-ray region (100–130Å; Werner & Wolff 1999). From these data and the Ne vii 3644Å line in a Keck spectrum, a neon abundance of 2–5% was derived. Dozens of lines from Ne vi–Ne viii were later detected in the Chandra spectrum of H1504$+$65, confirming this result (Werner et al. 2004, W04). This recent analysis also took advantage of FUSE (Far Ultraviolet Spectroscopic Explorer) spectra, in which we detected for the very first time in any stellar spectrum another Ne vii line, located at 973Å. It is among the strongest absorption features in that FUSE spectrum.
In this paper we present the results of our systematic search for this newly identified FUV line in FUSE spectra of a number of PG1159 stars. We also present new high-resolution optical spectra obtained with ESO’s VLT (Very Large Telescope), which allow for a much deeper search for the Ne vii 3644Å line, compared to our earlier WR94 investigation. We also announce the first detection of a Ne vii multiplet at 3850–3910Å. It will be shown that the Ne vii 973Å line is much stronger than the optical neon lines, and that it can still be observed in objects with photospheric parameters for which the optical lines are no longer detectable. In contrast to the optical lines, the FUV line is even detectable at a solar abundance level and can thus be used as a unique tool for the neon abundance determination in very hot H-rich central stars.
In Sect. 2 we describe our observations, followed by a presentation of our model atmospheres in Sect. 3. In Sect. 4 we compare observed and computed Ne vii line profiles. We discuss implications of our results on interior processes in the precursor AGB stars in the final Section 5.
| Object | H | He | C | O | ref. | ||
|---|---|---|---|---|---|---|---|
| [kK] | (cgs) | ||||||
| RX J0122.9$-$7521 | 180 | 7.5 | 66 | 21 | 11 | A | |
| RX J2117.1$+$3412 | 170 | 6.0 | 38 | 54 | 6 | B | |
| PG1520+525 | 150 | 7.5 | 43 | 38 | 17 | J | |
| PG1144+005 | 150 | 6.5 | 38 | 58 | 2 | C | |
| NGC 246 | 150 | 5.7 | 62 | 30 | 6 | F | |
| PG1159-035 | 140 | 7.0 | 33 | 48 | 17 | I,J | |
| Abell 21 | 140 | 6.5 | 33 | 48 | 17 | F | |
| K1$-$16 | 140 | 6.4 | 33 | 48 | 17 | G | |
| Longmore 3 | 140 | 6.3 | 38 | 54 | 6 | F | |
| PG1151-029 | 140 | 6.0 | 33 | 48 | 17 | F | |
| Longmore 4 | 120 | 5.5 | 45 | 42 | 11 | D | |
| PG1424+535 | 110 | 7.0 | 49 | 43 | 6 | J | |
| Abell 43 | 110 | 5.7 | 35 | 41 | 21 | 1 | E |
| NGC 7094 | 110 | 5.7 | 35 | 41 | 21 | 1 | E |
| Abell 30 | 110 | 5.5 | 33 | 48 | 17 | H | |
| MCT0130-1937 | 90 | 7.5 | 73 | 22 | 3 | J | |
| PG1707+427 | 85 | 7.5 | 43 | 38 | 17 | J |
References in last column: A: Werner et al. 1996a, B: Werner et al. 1996b, C: Werner & Heber 1991, D: Werner et al. 1992, E: Dreizler et al. 1997, F: Rauch & Werner 1997, G: Kruk & Werner 1998, H: Werner et al. 2003a, I: Werner et al. 1991, J: Dreizler & Heber 1998
| Object | FUSE | VLT/1 | VLT/2 | |
|---|---|---|---|---|
| dataset | texp | texp | texp | |
| name | [min] | [min] | [min] | |
| RX J0122.9$-$7521 | – | – | 10 | - |
| RX J2117.1$+$3412 | P1320501 | 137 | – | - |
| PG1520+525 | P1320101 | 81 | – | - |
| PG1144+005 | P1320201 | 114 | 10 | 60 |
| NGC 246 | – | – | 5 | - |
| PG1159-035 | Q1090101 | 105 | 5 | 60 |
| Abell 21 | – | – | 10 | - |
| K1$-$16 | M1031001-8 | 665 | – | - |
| Longmore 3 | – | – | 5 | - |
| PG1151-029 | – | – | 10 | - |
| Longmore 4 | B0230201 | 434 | 10 | 60 |
| PG1424+535 | P1320301 | 185 | – | - |
| Abell 43 | – | – | 5 | - |
| NGC 7094 | – | – | 5 | - |
| Abell 30 | – | – | 5 | - |
| MCT0130-1937 | – | – | 10 | - |
| PG1707+427 | P1320401 | 243 | – | - |
2 FUSE and VLT observations
Our sample consists of 17 PG1159 stars, which represent about 50% of all known objects in this spectroscopic class. Their basic atmospheric parameters are listed in Table 1. The sample contains two so-called hybrid-PG1159 stars, which display hydrogen Balmer lines in their spectra (Abell 43 and NGC 7094). Traces of nitrogen (typically 1% by mass) were discovered in some PG1159 stars. This is neglected in Table 1, but will be discussed in the last Section.
In Table 2 we list the FUSE and VLT spectra available for our program stars. The FUSE instrument consists of four coaligned telescopes, each with a prime-focus spectrograph. Descriptions of the FUSE instrument, and channel alignment and wavelength calibration issues are given by Moos et al. (2000) and Sahnow et al. (2000). The LWRS spectrograph apertures were used for all observations other than K1$-$16, which was observed in all 3 apertures. As a result, the zero-point of the wavelength scale is uncertain to within about Å. All exposures were photometric, or nearly so, in all channels for the LWRS observations. Exposures in the HIRS and MDRS aperture K1$-$16 observations that had less than 50% peak flux were discarded; the rest were renormalized to match the LWRS data. All data were obtained in time-tag mode except for RX J2117.1$+$3412, which was observed in histogram mode, and all were processed with CALFUSE v2.4. Spectra from individual exposures were coaligned in wavelength on a channel by channel basis using narrow interstellar absorption lines, averaged weighted by exposure time, and then shifted to put the photospheric O vi features at zero velocity.
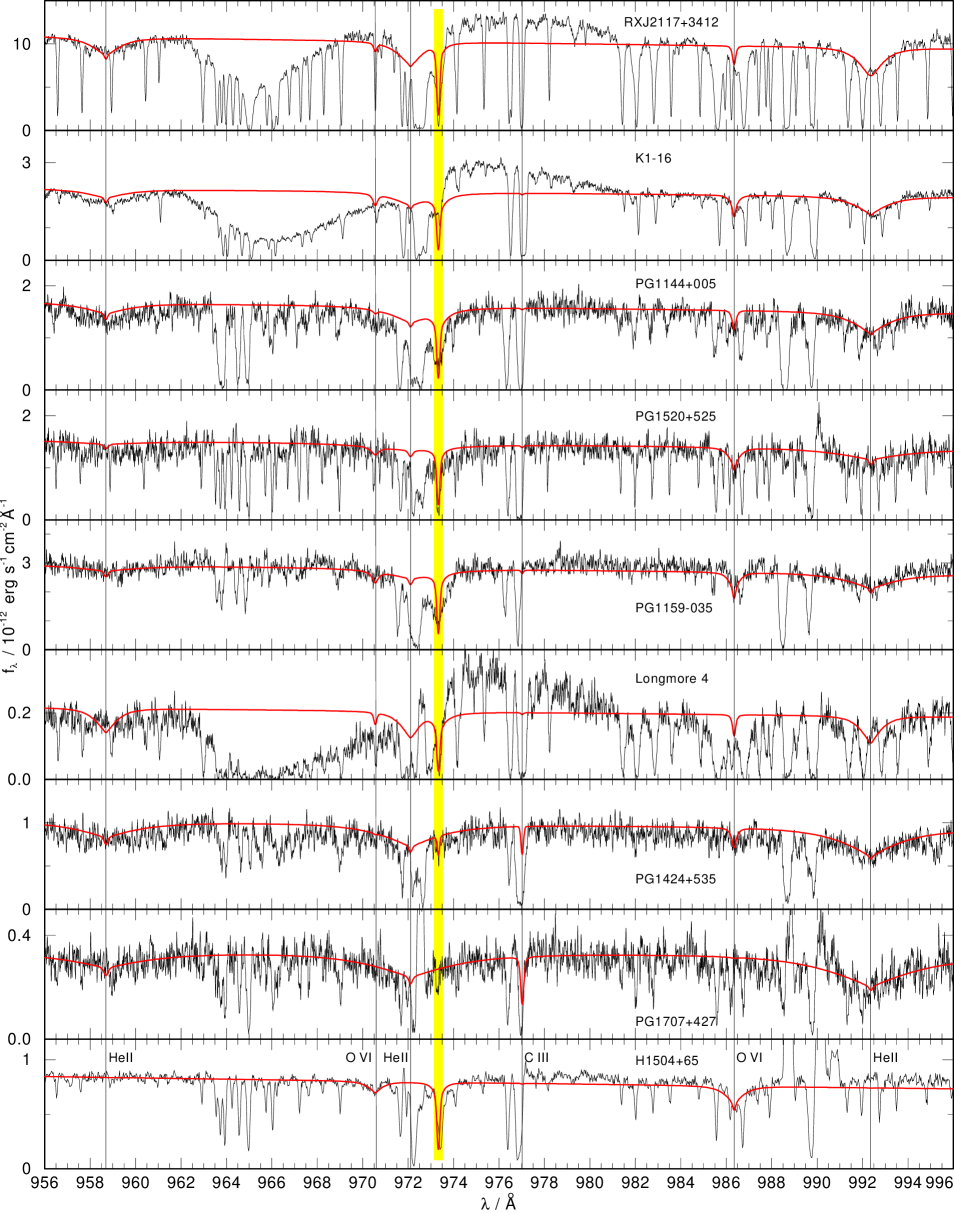

Fig. 1 displays the FUV spectra around the newly identified Ne vii line; an expanded view is shown in Figures 2 and 3. They have been shifted to the rest wavelengths of the photospheric lines, using the O vi resonance line doublet. We have excluded available FUSE spectra of NGC 7094 and Abell 78 from our analysis, because the region around the Ne vii line is badly contaminated by the extremely broad P Cygni-shaped profile of the C iii resonance line as well as by a damped H2 profile. Their analysis requires detailed wind modeling which is beyond the scope of this paper. The FUSE spectrum of another object (HS 2324+397) has been excluded from our analysis because of poor S/N and very strong contamination by interstellar H2 absorption lines.
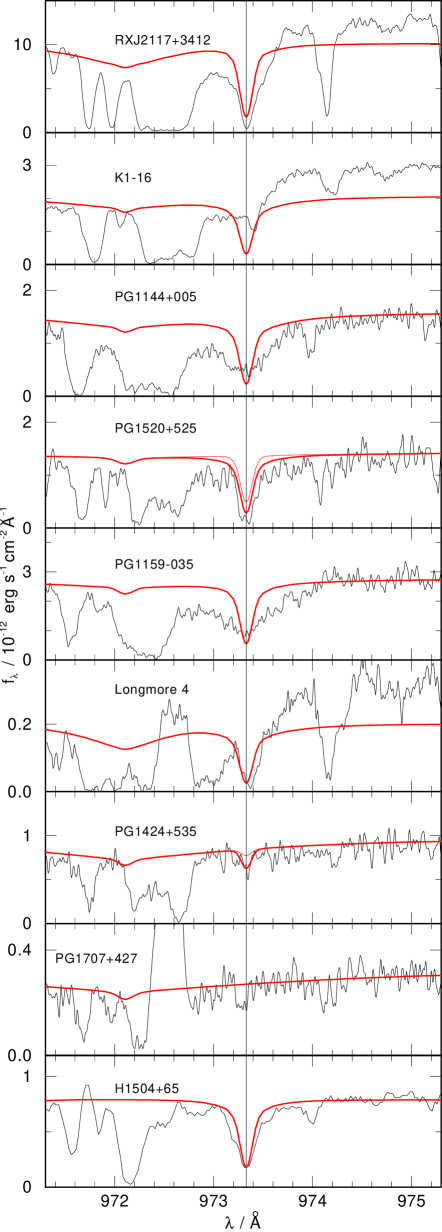
The Ne vii 973Å line is potentially blended with two interstellar H2 lines: the Lyman band P(1)11-0 973.342Å and the Werner band P(4)2-0 973.452Å transitions. The strengths and relative velocities of these features were determined from fits to the numerous other H2 absorption lines in the FUSE bandpass, along with the common low-ionization atomic species (O i, N i, Ar i, C ii, Fe ii, etc.). The SiC2a, LiF1a, and LiF2a spectra were used for the fits, as they had the best signal-to-noise. Fitting was performed with the program Owens.f written by Martin Lemoine; for a discussion of the fitting procedure see Kruk et al. (2002) or Hébrard et al. (2002). Atomic data used in the fits were taken from Morton (2003), and molecular data were taken from Abgrall et al. (1993a, 1993b). The P(4)2-0 transition is rarely significant: the column density of H2 in the J=4 state is typically far less than in J=1, and absorption by H2 from the J=4 level was detected only for four of the nine stars. Because of the complications associated with modeling the broad wind features in several of the stars, the stellar continuum was treated in the ISM models by fitting a fourth-order polynomial over a wide region and including broad He ii profiles when appropriate. The results of the fits are shown in Fig. 2 for the vicinity of the Ne vii line, and for a region spanning a representative sample of H2 lines. This latter region includes the strongest Lyman band transitions and absorption from all J-levels found in the spectra. Fits of comparable quality are obtained throughout the FUSE bandpass, so the modeled H2 absorption in the vicinity of 973.3Å should be reliable. Results for individual lines of sight are discussed in Section 4.1 below.
The optical spectra presented here were taken between July 2000 and August 2002 in the course of the ESO Supernovae Ia Progenitor Survey (SPY), see Tab. 2 (VLT/1 column). SPY is a high-resolution spectroscopic survey for radial velocity variable white dwarfs (Napiwotzki et al. 2001, 2003). Spectra were taken with the high resolution UV-Visual Echelle Spectrograph (UVES) of the UT2 telescope (Kueyen) of the ESO VLT. The SPY instrument setup (Dichroic 1, central wavelengths 3900Å and 5640Å) used UVES in a dichroic mode and nearly complete spectral coverage from 3200Å to 6650Å with only two 80Å wide gaps at 4580Å and 5640Å is achieved. SPY was implemented as a service mode program, which took advantage of those observing conditions, which are not usable by most other programs (moon, bad seeing, clouds). A wide slit () is used to minimize slit losses and a binning is applied to the CCDs to reduce read-out noise. Our wide slit reduces the spectral resolution to (0.2Å at 3600Å) or better, if seeing disks were smaller than the slit width.
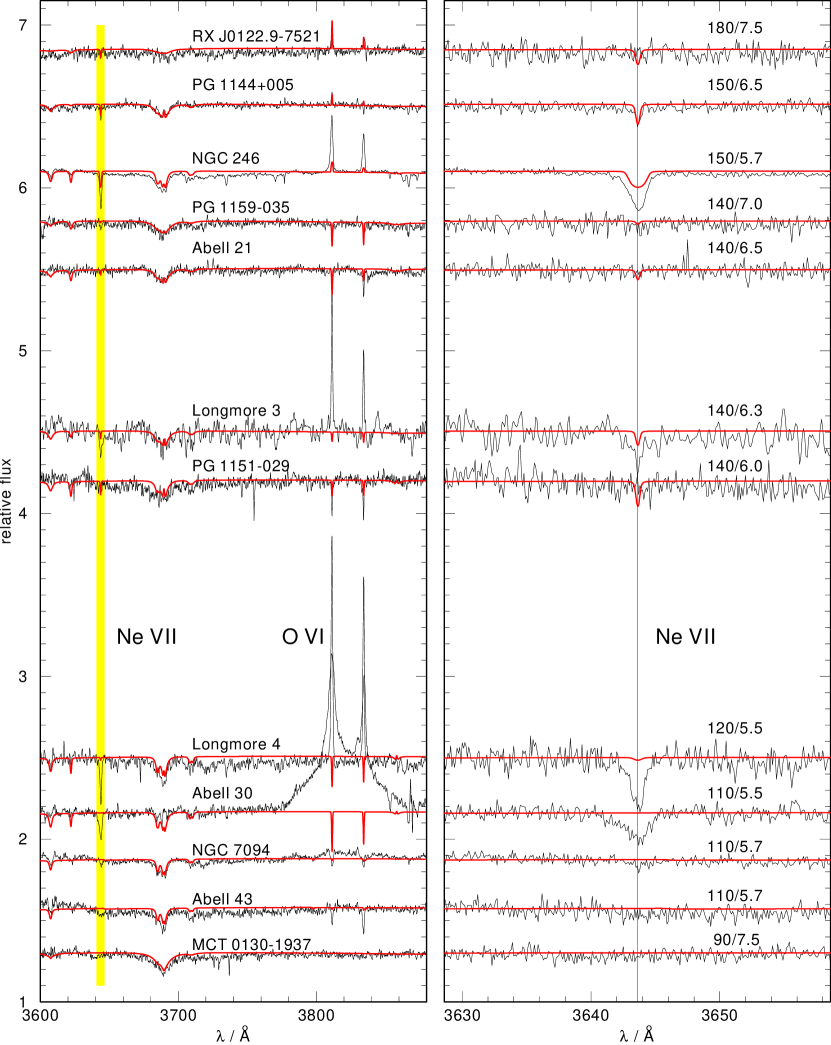
The spectra were reduced with a procedure developed by Karl (in prep.) using the ESO MIDAS software package, partly based on routines from the UVES pipeline reduction software provided by ESO (Ballester et al. 2003). Since the sampling of the spectra is much higher than needed for our analysis, we rebinned the spectra to 0.1Å stepsize; this considerably improved the signal-to-noise ratio with a negligible degradation of the resolution. Figures 4 and 7 display details of the spectra near the Ne vii 3644Å and 3850–3910Å lines, respectively.
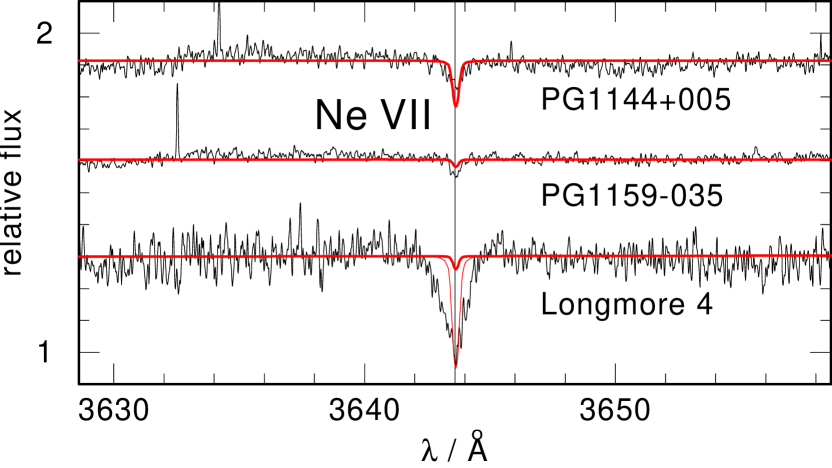
As part of another observation program, VLT/UVES spectra with significantly higher spectral resolution and integration time have been taken of PG1159$-$035, PG1144$+$005, and Longmore 4 between April and July 2002 (see Tab. 2, VLT/2 column). We used the standard DIC1 (346) setup and a slit width of and arrive at a resolving power (0.05Å at 3600Å). The spectra were subject to the standard pipeline reduction provided by ESO. They cover the wavelength regions 3300–3870Å, 4800–5755Å, and 5835–6805Å. Figure 5 displays these spectra near the Ne vii 3644Å line.
3 Model atmosphere calculations
For each program star we calculated a single model atmosphere with parameters obtained from literature (Table 1). It is beyond the scope of this paper to improve these parameters by detailed model grid calculations and line profile fits for the complete wavelength range covered by the FUSE and VLT spectra. This is deferred to an extensive analysis which has only just begun.
Line blanketed NLTE model atmospheres were computed using our PRO2 code (Werner et al. 2003b). The models are in hydrostatic and radiative equilibrium, hence, they cannot reproduce the P Cygni shaped profile of the C iii resonance line observed in three objects. Detailed wind modeling will be necessary in future analyses. The atomic models account for the most abundant elements in PG1159 stars, namely, helium, carbon, oxygen, and neon. Mass fractions were as shown in Table 1, except that the neon abundance was set to 2%. We do not take into account the trace nitrogen discovered in some of our program stars. This does not affect our results obtained here. For more details on atomic models, we refer to W04.
Here we present the detection of the Ne vii 973.3Å absorption line 2p1Po–2p2 1D in several PG1159 stars. The search was initiated by the very first detection of this line in H1504$+$65 (W04). There is some uncertainty in the literature concerning the accurate wavelength position of this line. The first measurement was published by Johnston & Kunze (1971, JK69) who give 973.6Å. Lang (1983) quotes 973.33Å (without reference) and this value is also found in the Chianti database (Young et al. 2003). According to Kramida (NIST, priv. comm.) the best measurement for this line was done by Lindeberg (1972). The measured wavelength is 973.3020.005Å. For our synthetic spectra we have adopted 973.33Å.
| /Å | Transition | reference | E/cm-1 |
| 973.3 | 2p1Po – 2p2 1D | Lindeberg (1972) | 214 952 |
| 1982.0 | |||
| 1992.1 | 3s3S – 3p3Po | Wiese et al. (1966) | 978 320 |
| 1997.3 | |||
| 3643.6 | 3s1S – 3p1Po | JK69 | 998 250 |
| 3853.3 | 1 028 386+x | ||
| 3866.8 | 1 028 519+x | ||
| 3873.2 | 1 028 519+x | ||
| 3894.0 | 3p3Po – 3d3D | this paper | 1 028 775+x |
| 3905.1 | 1 028 775+x | ||
| 3912.3 | 1 028 775+x |
In Table 3 we list the UV/optical Ne vii lines detected in PG1159 stars. Besides the lines discussed here, we include for completeness the Ne vii triplet around 1992 Å which was identified in one object (NGC 246, WR94).
Our model calculations show that the 973Å line of Ne vii is always much stronger than the optical 3634Å line. This is because the excitation energies of the (lower) levels involved are very different (see Table 3). The level excitation energy of the 973Å line corresponds to an excitation temperature of 310 kK, while that of the 3634Å line corresponds to 1400 kK. As a consequence, the population density of the lower level of the FUV line is by many orders of magnitude larger than that of the optical line (at least by four orders, depending on the model parameters and the depth in the atmosphere). Therefore in some objects the FUV line can be prominent while the optical line is not detectable. It is obvious that the Ne vii 973Å line is very strong in many of our program stars. In these cases, the depth of the 973Å line core is similar to that of the O vi resonance line, and both form in the uppermost layers of the atmospheres. The Ne vii 973Å line is quite saturated so that it is not very strongly dependent on the neon abundance. This can be seen in Fig. 3 for the case of PG1525+525. In the respective panel we included a model profile with a Ne abundance reduced to the solar value, i.e. by a factor of 20 down to 0.1%. The equivalent width is reduced by only a factor of about two. In contrast, the optical 3634Å line reacts sensitively on abundance changes. In all of our program stars in which we see this optical line, it would be undetectable if the neon abundance were only solar.
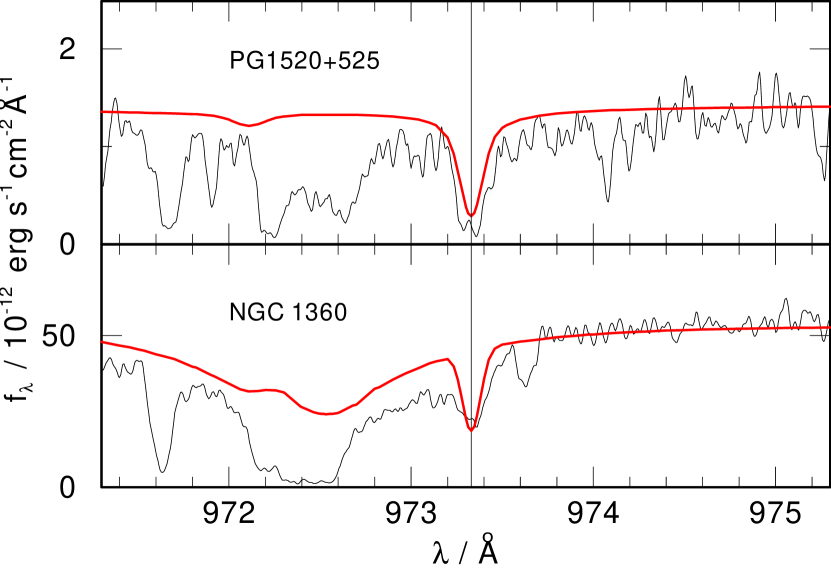
On the other hand, the Ne vii 973Å line opens the possibility to detect neon in very hot stars even at a solar neon abundance level. In Fig. 6 we show the FUSE spectrum of the very hot (=110 kK, =5.6; Hoare et al. 1996) hydrogen-rich central star of NGC 1360 which has (at least roughly) a solar abundance composition. The Ne vii line is clearly visible and it is well matched by a model calculated with solar element abundances.
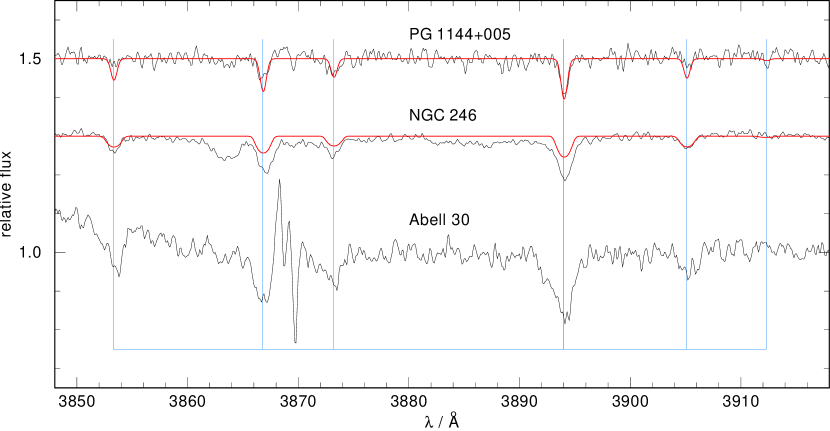
A new Ne vii multiplet, consisting of six lines in the 3853–3912Å range, is identified in our VLT spectra of three PG1159 stars (Fig. 7), which means the first detection of this multiplet in any stellar spectrum. It is the 3p3Po–3d3D transition, whose exact line positions were unknown up to now because of uncertain level energies. We have taken the energy levels from Kelly (1987). If we shift the whole corresponding multiplet by Å then all predicted line positions fall into observed absorption features within Å. This enables us to determine the line positions to an accuracy of about 0.2Å (vertical bars in Fig. 7). This is a nice example how high-resolution stellar spectroscopy can improve our knowledge of atomic data.
As a side note, it is interesting to recall that Heap (1975) mentioned the presence of a line feature at 3867.5Å in her spectrum of NGC 246. Now, after three decades, it is evident that she saw for the first time the 3866.8Å line of that Ne vii multiplet.
4 Comparison of observed and theoretical neon line profiles
Let us discuss the strengths of the Ne vii lines in the FUSE and VLT spectra and compare them to our models. As already mentioned, all the synthetic line profiles were computed with a neon abundance of 2%. We begin with the objects whose FUV spectra are displayed in Fig. 1 (and in more detail in Fig. 3), and then we turn to the objects for which we have only the optical VLT data (Figs. 4, 5 and 7).
As already emphasized, the 973Å line is potentially contaminated by interstellar H2. It is therefore mandatory to carefully examine its possible contribution to the photospheric neon line. We will see that the 973Å line in most objects appears significantly broader than predicted by our models. Possible origins are discussed in Section 4.2.
4.1 Discussion of individual objects
RX J2117.1$+$3412: The 973Å line is located in the broad and shallow emission part of the C iii P Cygni profile. The heavily-saturated interstellar H2 P(1)11-0 line coincides with the predicted Ne vii profile, rendering it difficult to confirm or refute its presence. There is substantial residual absorption, however, that is much broader than predicted by the photospheric model, and which cannot be explained by interstellar absorption.
K1$-$16: The weak narrow absorption seen at 973.4Å is consistent with absorption by IS H2. There is substantial residual absorption, however, that is even broader than that seen in RX J2117.1$+$3412. The 3644Å line was already detected by WR94.
PG1144$+$005: The 973Å line profile is affected by the red wing of the interstellar H i Ly absorption line. The IS H2 absorption is quite weak and offset significantly in wavelength. The neon line is very strong and significantly broader than the computed profile. Increasing within reasonable limits does not improve the fit, see also the discussion of the next object. We also identify the 3644Å line. It is rather weak and well fit by the synthetic profile. The strongest components of the Ne vii 3853–3912Å multiplet are also identified and we obtain a good model fit.
PG1520$+$525: The 973Å line is very strong and the synthetic profile fits very well. The observed line profile is in strong contrast to the previous object. Both stars have the same . The surface gravity of PG1144$+$005 is lower by one dex but, quite unexpectedly, its 973Å line is much broader. The IS H2 contamination is a bit stronger than in PG1144$+$005, but is still a minor contributor to the overall profile.
PG1159$-$035: Here we also see a strong 973Å line, which is significantly broader than what we expect from the synthetic profile. The IS H2 contamination is not significant. This star’s gravity is also lower than that of PG1520$+$525, but the line profile is much broader. The 3644Å line is not detectable in the VLT/1 spectrum of PG1159$-$035 (Fig. 4), but easily identified, although being quite weak, in the higher-resolution VLT/2 spectrum (Fig. 5). Accordingly, the model profile is very weak, too. The Ne vii 3853–3912Å is detectable (not shown).
Longmore 4: As with RX J2117.1$+$3412, the heavily-saturated IS H2 absorption coincides with and obscures the predicted Ne vii absorption. There is, however, very strong unexplained absorption that is blue-shifted from the predicted line center. Among all the VLT spectra, the 3644Å line of Longmore 4 is the strongest (together with NGC 246). However, the computed profile for Longmore 4 is much too weak. We believe that this is partly due to the fact that its temperature is significantly higher than previously determined. The observed strong O vi 3811/3834Å doublet is also in contrast to the weak computed emission and, hence, points into the same direction. Instead of 120 kK, could be as high as that of NGC 246 (150 kK). In the highest resolution spectrum (Fig. 5), the optical Ne vii line appears asymmetric, showing a blue wing that is broader than the red one. We think that this is due to wind effects. So the line equivalent width in this star is stronger than predicted also because of our static model assumption.
PG1424$-$535 and PG1707$+$427 are among the “cool” PG1159 stars and our models predict rather weak 973Å lines, because the ionization balance of neon shifts strongly in favor of lower ionization stages. H2 is weak but clearly detected in PG1707$+$427, and appears sufficient to explain the observed absorption at 973Å. H2 is not convincingly detected in the spectrum of PG1424$-$535; instead what is shown in Fig. 2 is a 3- upper limit to the H2 column density. The resulting profile is consistent with the observed spectrum. The signal-to-noise of the FUSE spectra for both PG1424$-$535 and PG1707$+$427 is relatively low; better data are required to determine conclusively whether or not the predicted weak Ne vii absorption is present.
We have augmented Figs. 1 – 3 with the FUSE spectrum of H1504$+$65, which is the hottest PG1159 star (200kK). It shows strong Ne vii lines, both, in the FUV and the optical (W04).
We now turn to those objects for which only optical data are available (see Fig. 4). We remark in advance, that the O vi 3s–3p doublet at 3811/3834Å may be strongly enhanced in emission strength by a stellar wind, so that we cannot expect good fits of our models to these lines. This is most obvious in the case of Abell 30.
RX J0122.9$-$7521 is the second hottest PG1159 star (=180 kK) after H1504$+$65 (200 kK). The 3644Å line cannot be detected. Also, the predicted profile is very weak and shows that the line can escape detection despite the overabundance of Ne. When compared to H1504$+$65 this seems surprising. But the surface gravity of RX J0122.9$-$7521 is lower, favoring the shift of the neon ionization balance to ionization stages higher than Ne vii.
NGC 246 has the strongest 3644Å line, together with Longmore 4. Its equivalent width is significantly stronger than the computed one. Five out of the six components of the Ne vii 3853–3912Å multiplet are identified and, again, the observed equivalent widths are larger. This suggests that the Ne abundance in both stars may be even higher than 2%. We recall that a similar result was found for H1504$+$65 (see Sect. 1). Note that NGC 246 is rotating, perhaps with up to v sini70km/s (Rauch & Werner 1997), which can partly explain the broad line profile.
Abell 21: The optical lines cannot be detected. The synthetic profiles show that, as in the case of PG1159$-$035, the relatively high surface gravity shifts the ionization balance away from Ne vii to Ne vi.
Longmore 3: The observed 3644Å line is much stronger than the calculated one. In this case we think that either (140 kK) is higher than assumed and/or that (6.3) is lower. Both would increase the calculated line strength. This is corroborated by the appearance of the O vi 3811/3834Å doublet: The calculated lines are in absorption whereas the observed ones are in emission. This also points to higher and/or lower .
PG1151-029: The optical lines cannot be detected. The computed profiles show that they can escape detection in our VLT spectrum.
Abell 30 presents a strong 3644Å line but nothing is seen in the model. As in the case of Longmore 4, is probably underestimated and/or is overestimated. Out of all objects presented here, the Ne vii 3853–3912Å multiplet is most prominent in Abell 30. Again, the lines do not show up in the model, because its parameters are not appropriate.
NGC 7094 and Abell 43 are the two hybrid-PG1159 stars in our sample. They are relatively cool so that only a weak 3644Å line can be expected. Indeed, a very weak line is possibly present in NGC 7094, but we regard this as uncertain. It is not detectable in Abell 43.
MCT0130$-$1937 is the coolest object in our VLT sample (90 kK). Consequently, the optical lines are not detectable.
4.2 Summary of neon line analyses
Table 4 summarizes the results. Ne vii lines were not detected in seven objects: RX J0122.9$-$7521, Abell 21, PG1151-029, PG1424$-$535, Abell 43, MCT0130$-$1937, and PG1707$+$427. In all these cases one can neither exclude nor prove a neon overabundance, because the respective atomic levels are weakly populated due to photospheric parameters. In the other ten objects, neon lines are detected. A comparison with model profiles reveals a strong overabundance in some of these, however, a detailed abundance analysis still needs to be performed for all of them.
In six PG1159 stars we have detected the Ne vii 973Å line. It is remarkable that the observed line profile in five of these stars is much broader than the synthetic profile (see Tab. 4). Can wind effects, neglected in our models, play a role? Probably not, at least not in all cases. While three of these five stars show P Cyg profiles, two don’t: PG1159$-$035 and PG1144$+$005. Another explanation could be line broadening by pulsations. Four out of five of these broad-line PG1159 stars are non-radial pulsators (identified in Tab. 4). PG1159$-$035 is indeed the prototype of the GW Vir pulsators, and periodic UV line profile shifts with an amplitude of the order 5 km/s were detected in HST/STIS spectra (Dreizler & Werner 2004). The Ne vii line in the FUSE spectrum would require a much larger amplitude. This is not necessarily a contradiction, because the weak HST-UV lines (mostly C iv and O vi lines) form in deeper regions of the atmosphere than the strong Ne vii 973Å line, and different depths may experience different pulsation velocities. Hence, pulsation could explain the broad line profiles in PG1159$-$035 and the other broad-line PG1159 stars except for one object, namely PG1144$+$005. Several observation campaigns have failed to detect light variability in this star (see, e.g., Steininger et al. 2003).
It is worth mentioning that the unusual width of the Ne vii 973Å line in PG1159$-$035 and PG1144$+$005 comes along with a similar effect in their O vi resonance doublets. These doublets have optical depths comparable to the neon line and also show broader and shallower cores than the models. In contrast, the only star which has a narrow Ne vii 973Å line (that is compatible with the model), also exhibits an O vi line that is fitted by the model. An interpretation of the oxygen doublet in the other four broad-line PG1159 stars is problematic because it appears as a prominent P Cyg profile.
| Object | variable | 973Å | 3644Å | 3850-3910Å |
|---|---|---|---|---|
| RX J0122.9$-$7521 | - | - | - | |
| RX J2117.1$+$3412 | + | broad | ||
| PG1520+525 | - | + | ||
| PG1144+005 | - | broad | + | + |
| NGC 246 | + | + | + | |
| PG1159-035 | + | broad | + | + |
| Abell 21 | - | - | ||
| K1$-$16 | + | broad | + | |
| Longmore 3 | - | + | - | |
| PG1151-029 | - | - | - | |
| Longmore 4 | + | broad | + | - |
| PG1424+535 | - | - | ||
| Abell 43 | - | - | ||
| NGC 7094 | + | - | ||
| Abell 30 | + | + | ||
| MCT0130-1937 | - | - | - | |
| PG1707+427 | + | - |
5 Discussion and concluding remarks
In order to discuss the implications of our results let us describe shortly our current understanding about the origin of PG1159 stars. We refer the reader to the work of Herwig (2001) for more details.
PG1159 stars are hot post-AGB stars which have suffered a late (or very late) helium-shell flash during their first descent from the AGB. This event transforms a post-AGB star (or a white dwarf) back to an AGB star (“born-again” AGB star) and it then descends from the AGB for a second time. The He-shell flash is the origin of the H-deficiency that characterizes the PG1159 stars (and their immediate progenitors, the [WC]-type central stars).
The surface abundance pattern of PG1159 stars essentially reflects the
composition of the matter that is located between the H- and He-burning shells
(intershell region) of thermally pulsing AGB stars. Intershell matter is
helium-dominated (ash of CNO hydrogen-burning), but also strongly enriched by C
and O from the 3-process in the He-burning shell. The strong C and O
intershell enrichment is the consequence of effective convective overshoot that
dredges up C and O into the convective intershell. Evolutionary models predict a
neon abundance of about 2% by mass in the intershell. This 22Ne is
produced in the He-burning shell from 14N (which itself was produced
previously by CNO-burning) via
14NFONe
.
Our result, that the neon abundance in some objects is strongly
overabundant, is therefore in qualitative agreement with theoretical predictions.
This view is further supported by recent observations which reveal s-process signatures in the surface composition of PG1159 stars. While it is impossible to detect the enrichment of s-process elements in these hot objects (because of the lack of atomic data for high ionization stages), we have instead found a deficiency of iron in all examined PG1159 stars (Miksa et al. 2002, Werner et al. 2003a). Obviously, Fe was transformed to heavier elements in the intershell region of the AGB star by n-captures from the neutron source 13C(,n)16O.
How is the He/C/O/Ne-rich intershell matter mixed to the surface of the star, and what happens to the H-rich envelope matter? This is interesting in order to discuss the observed nitrogen abundance in PG1159 stars.
As a consequence of the He-shell flash a convection zone develops above the
He-burning shell that eventually reaches the H-rich envelope. Hydrogen is
ingested and burned. According to Iben & MacDonald (1995) large amounts of
nitrogen can be produced (5%) by the reaction chain
12C(p,)13NC(p,)14N ,
because ample 12C is available in the intershell from 3 burning.
However, calculations by Herwig (2001), with a more extensive nuclear network,
show that no fresh nitrogen is produced. Instead of 13C reacting with
protons to form 14N, it reacts with 4He to form 16O, so that
protons are burned in the chain
12C(p,)13NC(,n)16O .
Here we have an effective neutron source which activates further n-capture
nucleosynthesis (Herwig et al. 2003).
If no fresh N is produced, and if all N from previous CNO cycling was transformed into 22Ne, then the question remains unanswered, why a considerable fraction of PG1159 stars (six objects) exhibits nitrogen on the 1% level. As a coincidence, these six N-rich stars are within our sample (PG1144+005, PG1159-035, Abell 30, PG1707+427, Abell 43, NGC 7094). The first four of these positively show Ne vii lines, i.e., the neon must have been produced from CNO-cycle generated nitrogen.
The hybrid-PG1159 stars are a special case. We know four such objects which still have considerable amounts of residual surface hydrogen (two are in our sample: Abell 43 and NGC 7094). According to Herwig (2001) this is the result of a He-shell flash experienced by an AGB-star immediately before its departure from the AGB. They also show residual nitrogen, which seems natural in this event. The hybrid-PG1159 stars essentially display an intershell matter abundance pattern like the other PG1159 stars, however, it is diluted by hydrogen-rich envelope matter. So we also would expect a neon-enrichment, but this is difficult to conclude from our spectra.
In summary, the strong neon enrichment found in some PG1159 stars is qualitatively in agreement with evolutionary models for stars which suffered a late He-shell flash. The surface chemistry of PG1159 stars is that of intershell matter in the precursor AGB stars. The neon enrichment and the iron-deficiency caused by s-processing are strongly supporting this scenario.
Acknowledgements.
UV data analysis in Tübingen is supported by the DLR under grant 50 OR 0201. RN acknowledges support by a PPARC advanced fellowship. JWK is supported by the FUSE project, funded by NASA contract NAS5-32985. We thank Falk Herwig (LANL) for helpful discussions on evolutionary aspects, and Dr. Kramida (NIST) and Prof. Kunze (University of Bochum) for their advice on the Ne vii 973Å line identification. This research has made use of the SIMBAD Astronomical Database, operated at CDS, Strasbourg, France. The UVES spectra used in this analysis were obtained as ESO Service Mode runs. The interstellar absorption analysis was done using the profile fitting procedure Owens.f developed by M. Lemoine and the FUSE French Team.References
- (1) Abgrall, H., Roueff, E., Launay, F., Roncin, J.Y., & Subtil, J.L. 1993a, A&AS 101, 273
- (2) Abgrall, H., Roueff, E., Launay, F., Roncin, J.Y., & Subtil, J.L. 1993b, A&AS 101, 323
- (3) Ballester, P., Boitquin, O., Modigliani, A., et al. 2003, UVES Pipeline User’s Manual, ESO, Garching
- (4) Dekker, H., D’Odorico, S., Kaufer, A., Delabre, B., & Kotzlowski, H. 2000, Proc. SPIE, 4008, 534
- (5) Dreizler, S., & Heber, U. 1998, A&A, 334, 618
- (6) Dreizler, S., & Werner, K. 2004, A&A, submitted
- (7) Dreizler, S., Werner, K., & Heber, U. 1997, in Planetary Nebulae, ed. H.J. Habing and H.J.G.L.M. Lamers, IAU Symp. 180, Kluwer, p. 103
- (8) Heap, S.R. 1975, ApJ, 196, 195
- (9) Hébrard, G. Lemoine, M., Vidal-Madjar, A., et al. 2002, ApJS, 140, 103
- (10) Herwig, F. 2001, in Low Mass Wolf-Rayet Stars: Origin and Evolution, ed. R. Waters, A. Zijlstra, T. Blöcker, Ap&SS, 275, 15
- (11) Herwig, F., Lugaro, M., & Werner K. 2003, in Planetary Nebulae, eds. S. Kwok, M. Dopita, R. Sutherland, IAU Symp. 209, ASP, p. 85
- (12) Hoare, M.G., Drake, J.J., Werner, K., & Dreizler, S. 1996, MNRAS, 283, 830
- (13) Iben, I. Jr., & MacDonald, J. 1995, in White Dwarfs, eds. D. Koester and K. Werner, Lecture Notes in Physics 443, Springer, Berlin, p. 48
- (14) Johnston, W.D., & Kunze H.-J. 1971, Phys. Rev. A, 4, 962 (JK69)
- (15) Kelly, R.L. 1987, Journal of Physical and Chemical Reference Data, Vol. 16, Suppl. No. 1
- (16) Kruk, J.W., & Werner, K. 1998, ApJ, 502, 858
- (17) Kruk, J.W., Howk, J.C., André, M. 2002, ApJS, 140, 19
- (18) Lang, J. 1983, J. Phys. B, 16, 3907
- (19) Lindeberg, S. 1972, Uppsala Univ. Inst. Phys., Report UUIP-759, 1
- (20) Miksa, S., Deetjen, J.L., Dreizler, S., Kruk, J., Rauch, T., & Werner, K. 2002, A&A, 389, 953
- (21) Moos, H.W., Cash, W.C., Cowie, L.L., et al. 2000, ApJL, 538, 1
- (22) Morton, D.C., 2003, ApJS 149, 205
- (23) Napiwotzki, R., Christlieb, N., Drechsel, D., et al. 2001, AN, 322, 411
- (24) Napiwotzki, R., Christlieb, N., Drechsel, D., et al. 2003, ESO Messenger, 112, 25
- (25) Rauch, T., & Werner, K. 1997, in The Third Conference on Faint Blue Stars, ed. A.G.D. Philip, J. Liebert, R.A. Saffer, (L. Davis Press, Schenectady, NY), p. 217
- (26) Sahnow, D.J., Moos, H.W., & Ake, T.B. 2000, ApJL, 538, 7
- (27) Steininger, B., Paparo, M., Virághalmy, G., Zsuffa, D., & Breger, M. 2003, in Interplay of Periodic, Cyclic and Stochastic Variability in Selected Areas of the H-R Diagram, ed. C. Sterken, ASP Conf. Ser. 292, 237
- (28) Werner, K. 2001, in Low Mass Wolf-Rayet Stars: Origin and Evolution, eds. T. Blöcker, L.B.F.M. Waters, A.A. Zijlstra, Ap&SS, 275, 27
- (29) Werner, K., & Heber, U. 1991, A&A, 247, 476
- (30) Werner, K., & Rauch, T. 1994, A&A, 284, L5 (WR94)
- (31) Werner, K., & Wolff, B. 1999, A&A, 347, L13
- (32) Werner, K., Heber, U., & Hunger, K. 1991, A&A, 244, 437
- (33) Werner, K., Hamann, W.-R., Heber, U., Napiwotzki, R., Rauch, T., & Wessolowski, U. 1992, A&A, 259, L69
- (34) Werner, K., Wolff, B., Pakull, M., et al. 1996a, in Supersoft X-ray Sources, ed. J. Greiner, Lecture Notes in Physics 472, Springer, Berlin, p. 131
- (35) Werner, K., Dreizler, S., & Heber, U., et al. 1996b, A&A, 307, 860
- (36) Werner, K., Dreizler, S., Koesterke, L., & Kruk, J.W. 2003a, in Planetary Nebulae, eds. S. Kwok, M. Dopita, R. Sutherland, IAU Symp. 209, ASP, p. 239
- (37) Werner, K., Deetjen, J.L., Dreizler, S., Nagel, T., Rauch, T., & Schuh, S.L. 2003b, in Stellar Atmosphere Modeling, eds. I. Hubeny, D. Mihalas, K. Werner, ASP Conf. Ser., 288, 31
- (38) Werner, K., Rauch, T., Barstow, M.A., & Kruk, J.W. 2004, A&A, 421, 1169 (W04)
- (39) Wiese, W.L., Smith, M.W., & Glennon, B.M. 1966, Atomic transition probabilities Vol. 1, NSRDS-NBS4, U.S. Dept. of Commerce
- (40) Young, P.R., Del Zanna, G., Landi, E., Dere, K.P., Mason, H.E., & Landini M. 2003, ApJS, 144, 135