The Baryon Content of the Local Intergalactic Medium
Abstract
In this review, we describe our surveys of low column density (Ly) absorbers ( cm-2), which show that the warm photoionized IGM contains 30% of all baryons at . This fraction is consistent with cosmological hydrodynamical simulations, which also predict that an additional 20–40% of the baryons reside in much hotter 105-7 K gas, the warm-hot IGM (WHIM). The observed line density of Ly absorbers, for cm-2, is dominated by low- systems that exhibit slower redshift evolution than those with cm-2. HST/FUSE surveys of O VI absorbers, together with recent detections of O VII with Chandra and XMM/Newton, suggest that anywhere from 20–70% (with large errors) of the baryons could reside in the WHIM, for an assumed abundance O/H 10% solar. We also review the relationship between the various types of Ly absorbers and galaxies. At the highest column densities, cm-2, the damped Ly (DLA) systems are often identified with gas-rich disks of galaxies over a large range in luminosities (0.03–1 ) and morphologies. Lyman-limit systems ( cm-2) appear to be associated with bound bright ( 0.1–0.3 ) galaxy halos. The Ly absorbers with cm-2 are associated with filaments of large-scale structure in the galaxy distribution, although some may arise in unbound winds from dwarf galaxies. Our discovery that % of low- Ly absorbers reside in galaxy voids suggests that a substantial fraction of baryons may be entirely unrelated to galaxies. In the future, HST can play a crucial role in a precise accounting of the local baryons and the distribution of heavy elements in the IGM. These studies will be especially effective if NASA finds a way to install the Cosmic Origins Spectrograph (COS) on Hubble, allowing an order-of-magnitude improvement in throughput and a comparable increase in our ability to study the IGM.
keywords:
intergalactic medium – quasars: absorption lines – ultraviolet: galaxies: Hubble Space Telescope1 Introduction
In its first year, the Hubble Space Telescope (HST) discovered that a majority of all baryons in the current universe are not in galaxies, but instead remain in the intergalactic medium (IGM). In subsequent years, the UV spectrographs aboard HST and the Far Ultraviolet Spectroscopic Explorer (FUSE) have continued these investigations of the multiphase IGM, using sensitive UV tracers of diffuse gas: the Lyman series of H I (Ly at 1215.67 Å, Ly at 1025.72 Å, etc) and the O VI doublet (1031.926, 1037.617 Å). These HST and FUSE studies have led to a preliminary “baryon census” of the “warm” (photoionized) and “warm-hot” (collisionally ionized) IGM. With spectrographs aboard the Chandra and XMM/Newton X-ray telescopes, astronomers are beginning to search for even more highly ionized gas through resonance absorption lines of O VII, O VIII, N VII, and Ne IX.
Unlike virtually all other astronomical objects, the Ly absorption systems were first discovered at great distances () owing to their cosmological redshifts and the near-UV atmospheric cutoff. Only with the advent of HST have nearby examples been found. The first low- Ly absorbers were seen in the spectrum of 3C 273 at (Bahcall et al. 1991; Morris et al. 1991). While the number of absorbers was significantly less than the line density at high-, the “local Ly forest” contains far more absorbers than expected from extrapolating the ground-based data (Bahcall et al. 1993 and subsequent QSO Absorption-Line Key Project papers by Jannuzi et al. 1998 and Weymann et al. 1998). Although the Ly absorbers at are sufficiently abundant to account for nearly all the baryons (Rauch et al. 1997; Schaye 2001), their substantial numbers at imply that 30% of all baryons remain in these photoionized clouds locally (Penton, Stocke, & Shull 2000a, Penton, Shull, & Stocke 2000b, 2004, hereafter denoted Papers I, II, and IV).
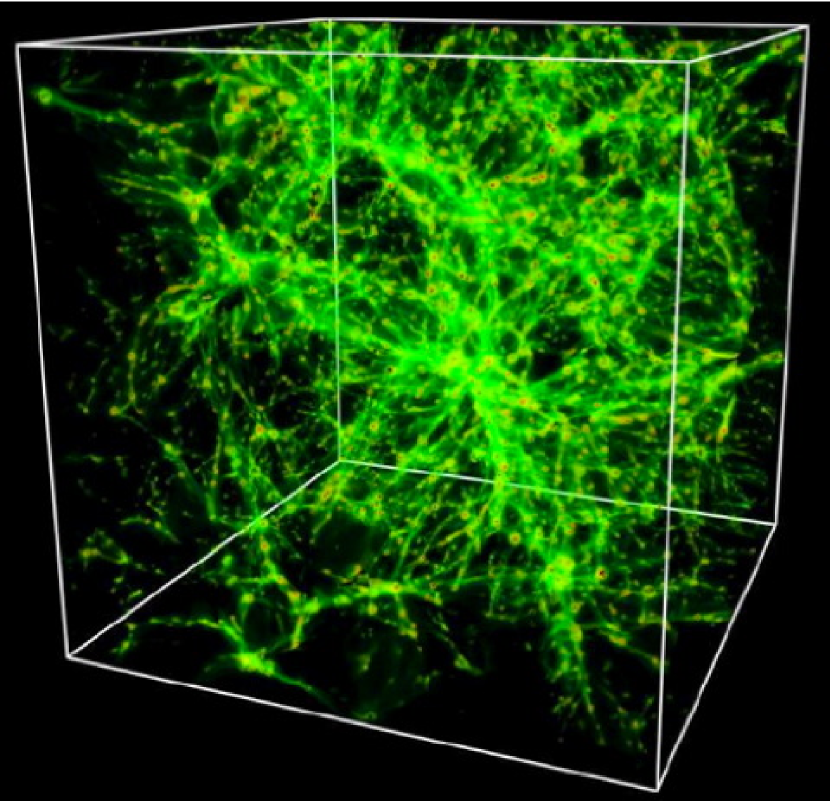
Numerical simulations (Fig. 1) of the evolving IGM (Cen & Ostriker 1999; Davé et al. 1999, 2001) explain not only the general features of the Ly number density evolution, but also many detailed properties, including distributions in column density () and doppler -value (Papers II and IV; Davé & Tripp 2001; Ricotti, Gnedin, & Shull 2000), and their relationship to galaxies (Davé et al. 1999; Impey, Petry, & Flint 1999; Penton, Stocke, & Shull 2002, hereafter denoted Paper III). Any accounting of the present-day distribution of baryons must include an accurate census of these absorbers and the associated mass, inferred from their ionized fractions, column densities, and physical extents.
Moderate-resolution UV spectroscopy of bright quasars, QSOs, blazars, and Seyfert galaxies has provided a substantial database of low- Ly absorbers. At the same time, several ground-based galaxy surveys (Morris et al. 1993; Lanzetta et al. 1995; Chen et al. 1998; Tripp, Lu, & Savage 1998; Rao & Turnshek 1998, 2000; Impey, Petry, & Flint 1999; Nestor et al. 2002; Bowen et al. 2002; Paper III; Bowen & Pettini 2003; Stocke et al. 2005, hereafter denoted Paper V) have probed the relationship between Ly absorbers and galaxies, filaments of galaxies, and voids. Using nearby examples of the Ly phenomenon, these authors sought to identify the galaxy types responsible for the absorption and thus assist in interpreting the wealth of information (number densities, metallicities, ionization states, line widths) of Ly absorption systems at high-. These efforts have been somewhat successful, although the results in most column-density regimes remain controversial (see conference proceedings edited by Mulchaey & Stocke 2002).
In this review, we describe the various HST QSO absorption line surveys that have been undertaken (§ 2), review our present knowledge of the baryon content of the IGM (§ 3), and describe the emerging, but still controversial, evidence for the relationship between the various column densities of Ly absorbers and galaxies (§ 4). The last information has come largely from studying low- absorbers discovered with HST. We conclude (§ 5) with a brief prospectus on low- IGM studies facilitated by the Cosmic Origins Spectrograph (COS), a new instrument that may be installed on HST in the coming years.
2 HST Surveys the Low- Ly Absorbers
The HST with its UV spectrographs (FOS, GHRS, STIS) conducted several important surveys of the IGM, which provided basic data for studying the bulk of local baryons. Owing to its modest spectral resolution (200-300 km s-1), the Faint Object Spectrograph (FOS) used for the initial QSO Absorption-Line Key Project (Bahcall et al. 1993) primarily detected high column density Ly absorbers with equivalent widths mÅ. The Key Project provided examples of the various types of Ly absorbers: damped Ly (DLA) absorbers, Lyman-limit/strong Mg II absorbers, weak high-ionization (C IV) and low-ionization (Mg II) metal-line absorbers, and Ly-only absorbers (Bahcall et al. 1996; Jannuzi et al. 1998). Even though the broad UV wavelength coverage (G130H, G190H, G270H gratings) of the Key Project spectra allowed the discovery of many Ly absorbers at , the detection efficiency of low redshift () absorbers was reduced by lower than expected far-UV sensitivity of the FOS digicon. The FOS Key Project survey firmly established the column density distribution, (), for high- absorbers and , the number density of absorbers per unit redshift. Above limiting Ly equivalent width, mÅ ( cm-2), Weymann et al. (1998) found over a substantial redshift pathlength ( 30). As we discuss below, the Ly line density increases substantially to lower columns, reaching for cm-2 (Paper IV).
The absorber number density (Weymann et al. 1998) shows a dramatic break from rapid evolution () to almost no evolution (). This observation was explained by cosmological hydrodynamical simulations (Davé et al. 1999), in which the rapid evolution in is controlled by the response of photoionized gas to evolving QSO populations in a hierarchical distribution of large-scale structure. At high redshift, the number of Ly absorbers decreased rapidly with time, owing to a nearly constant extragalactic ionizing flux from QSOs in an expanding universe. [The cosmological expansion decreases recombinations, thus decreasing the neutral hydrogen column density.] At , the ionizing flux began a rapid decline with the rapidly decreasing QSO numbers and/or luminosities, thereby decreasing the ionized fraction in the Ly absorbers. As a consequence of reduced photoionization, along with large-scale structure formation, the evolution slowed rapidly. Although the Key Project discovered only one DLA (Jannuzi et al. 1998), Rao & Turnshek (1998) used FOS to increase the number of low- DLAs by targeting strong Mg II absorbers found by ground-based telescopes. Bowen et al. (1996) used archival FOS spectra to search for strong Ly and metal-line absorption from known foreground galaxies. See Bowen, Pettini, & Blades (2002) for a STIS extension of this successful project.
The Goddard High-Resolution Spectrograph (GHRS) was used to co-discover (Morris et al. 1991) the Ly absorbers in the 3C 273 sightline. However, few QSOs were sufficiently bright to observe in moderate-length integrations. Tripp, Lu, & Savage (1998) and Impey, Petry, & Flint (1999) observed a few UV-bright AGN targets with the low-resolution far-UV GHRS grating, obtaining observations only slightly more sensitive than the FOS Key Project spectra. In the mid-1990s, the Colorado group conducted a moderate-resolution ( 20 km s-1) survey of 15 sightlines with the GHRS/G160M first-order grating (Papers I and II), followed by a comparable survey of 15 additional targets with the STIS first-order, medium-resolution grating G140M (Paper IV). In these surveys, the key strategy was to select only the brightest targets (see Fig. 2), while observing only a modest pathlength per target ( 10,000 km s-1 with GHRS and 20,000 km s-1 with STIS). The number density of Ly absorbers rises steeply with decreasing equivalent width. After subtracting intrinsic absorbers (near the redshift of the QSO) we found 187 intervening low- Ly absorbers at significance over a total unobscured pathlength . A careful analysis, accounting for S/N sensitivity bias and overlap with Galactic interstellar lines, gives a line density for cm-2, or one absorber every Mpc. Our more sensitive GHRS/STIS survey provides an important extension of the Key Project to lower- absorbers. As shown in Figure 2, the very best spectra in our survey reach equivalent-width limits of 10-20 mÅ (), corresponding to cm-2, comparable to the best spectra obtained with Keck/HIRES or VLT/UVES.

The cosmic evolution of the Ly forest absorbers shown in Figure 3 represents the historical record of a large fraction of the baryons during the emergence of the modern universe at . The evolution of the high- absorbers exhibits a substantial break in slope to a much slower evolution at 1.5, as expected from the physical effects acting on intergalactic absorbers in an expanding universe. The low- data point at from our survey is lower than that of the Key Project. We suspect this results from our survey’s higher spectral resolution, which affects the counting and -bin assignments of weak absorbers. The break in the evolution of the higher- absorbers is therefore not as dramatic as the Key Project data suggest. A more gradual decline in slope is also more consistent with the simulations in a CDM Universe model (Davé et al. 1999). The physical effects that account for the break in the high-column should create a similar break in the evolution of the lower- absorbers, although this is not yet evident in Figure 3. New STIS spectra obtained by B. Jannuzi and collaborators should determine whether the expected break is present, and whether the numerical simulations have used the correct physics to account for these absorbers.

Recently, several investigators have used STIS in its medium-resolution ( km s-1) echelle modes (E140M and E230M) to obtain long integrations on bright AGN targets. Many of these spectra have been analyzed for interesting individual absorbers, including a growing number of redshifted O VI absorbers : H1821+643 (Tripp et al. 2000, 2001); 3C 273 (Sembach et al. 2001; Tripp et al. 2002); PG 0953+415 (Savage et al. 2002); PKS 2155-304 (Shull et al. 2003); PG 1259+593 (Richter et al. 2004); PG 1116+215 (Sembach et al. 2004); and PG 1211+143 (Tumlinson et al. 2004). These spectra have the potential to be HST’s best resource for low- Ly absorber studies. As of July 2004, 35 bright AGN have been observed in STIS-echelle mode, providing in some cases the most sensitive detection limits for Ly, as well as significant pathlengths at for potential discovery of O VI absorbers. In the absence of the Cosmic Origins Spectrograph, the STIS medium-resolution echelle gratings continue to provide high-quality QSO spectra for IGM studies. However, obtaining the S/N needed to make sound inferences about the IGM absorbers requires increasingly long integration times on fainter targets.
3 Baryon Content of the low- Ly Forest
At high redshift () the number density of Ly absorbers is so large that estimates of their total baryonic masses, after substantial ionization corrections for photoionization equilibrium, suggest that the entire baryon content of the universe (, as measured by the Cosmic Microwave Background anisotropies or cosmic [D/H] ratio) can be accomodated within the warm ( K) photoionized IGM (Rauch et al. 1997; Schaye 2001). This result is consistent with numerical simulations of large-scale structure formation (Cen & Ostriker 1999; Davé et al. 1999, 2001), which also predict that by the baryons are approximately evenly divided among several components as follows:
-
•
Stars and gas in or near galaxies; 30% predicted. Salucci & Persic (1999) and Fukugita (2004) account for only % in this reservoir.
-
•
Very hot ( K) intracluster and intragroup gas; 10% predicted. Fukugita (2004) estimates only % of the baryons in this component, but the gas in groups may not be fully accounted for.
-
•
Warm ( K) photoionized gas; 30–40% predicted in Ly forest absorbers. In our Paper IV, we find % of the baryons in local Ly absorbers.
-
•
Warm-hot intergalactic medium (WHIM) at K; 20–40% predicted. A series of observations with HST and FUSE (Tripp, Savage, & Jenkins 2000; Savage et al. 2002) estimate that 5-10% of the baryons have been detected (at 10% assumed O/H metallicity) through O VI absorption. Recent Chandra observations of O VII absorption (Fang et al. 2002; Nicastro et al. 2004) suggest even larger percentages, although with enormous statistical uncertainties and a few unconfirmed observations.
Thus, we submit that the current-epoch baryon census remains an unsolved problem, with large and uncertain corrections for ionization state (H I, O VI, and O VII) and an overall uncertainty over the appropriate metallicity (for O VI, O VII, O VIII in WHIM). These problems can be addressed by HST and FUSE in the coming years, and by future high-throughput X-ray spectroscopic missions such as Constellation-X or Xeus.
3.1 Photoionized Ly Absorbers
In Paper II, we described a method for estimating the baryon content of the local Ly absorbers, based upon the observed column density distribution. In the context of optically-thin, photoionized clouds, the assumptions of this simplified model are: (1) spherically symmetric absorbers; (2) an isothermal density profile; (3) absorber sizes of kpc, based on QSO pairs experiments conducted at somewhat higher redshifts (Dinshaw et al. 1997, but see also Rosenberg et al. 2003); and (4) a value and slope for the extragalactic ionizing flux (Shull et al. 1999) using space densities and ionizing spectra of local Seyfert galaxies (Telfer et al. 2002). However, numerical simulations show that Ly absorbers are not at all spherical, especially at lower column densities. Cen & Simcoe (1997) used numerical simulations at =2–4 to show that lower column density ( cm-2) absorbers have large physical sizes, consistent with or somewhat larger than kpc (equivalent spherical radius). We have integrated this simplified model over our observed column density distribution, from 12.5 log , the range where the above assumptions are most valid. In Paper II we obtained a baryon fraction %, with specific dependences on measurable parameters as follows:
| (1) |
Here, is the characteristic H I column density in the Ly forest in units of cm-2, is the extragalactic ionizing specific intensity at 1 ryd in units of erg cm-2 s-1 Hz-1 sr-1, is the characteristic absorber radius in units of kpc, and is the mean power-law spectral index () for the metagalactic ionizing radiation, which presumably comes from QSOs (Shull et al. 1999; Telfer et al. 2002).
Schaye (2001) developed a methodology for estimating the baryon content that makes somewhat different assumptions. As with the method of our Paper II, this model assumes photoionization of optically-thin absorbers, but it also assumes gravitationally-bound clouds whose observed column densities are equal to their characteristic column densities over a Jeans length. This estimate has the following specific dependences:
| (2) |
where is the H I photoionization rate in units of s-1, is the IGM temperature in units of K, and is the H I column density distribution. In this model, the absorber baryon content depends on the minimum column density of H I absorbers as or for (see below). The above expression assumes that the Ly absorbers contain the universal ratio of baryons to dark matter, with no bias.
Here we employ both of these methods to estimate the baryon content of the local Ly absorbers, based on our latest column density distribution from Paper IV, which fitted power-law slopes of and on the lower and upper sides, respectively, of a break at cm-2. From our enlarged sample, we are confident that the slope extends down to at least log = 12.5, so that we can reliably integrate this distribution from log = 12.5 to 16.0. We recognize that, at or near our adopted lower limit (which corresponds approximately to an overdensity at the current epoch), some of the assumptions of both methods may break down. Also, at cm-2, absorbers become optically thick in the Lyman continuum and can hide additional gas mass. Therefore, neither method can hope to derive an extremely accurate measurement for the baryon content of the Ly forest, even if the column density distribution and other absorber properties (size, ionizing flux, temperature) are known to some precision.
We quote the resulting baryon densities as percentages of the total baryon density from measurements of the Cosmic Microwave Background anisotropy (, Spergel et al. 2003). A slightly smaller total baryon density has recently been obtained by measurement of D/H in a high- QSO absorber (, Kirkman et al. 2003). The baryon fraction in the IGM is dominated by the lower column density absorbers (22% out of 29% total baryons in Ly absorbers at cm-2), owing to the steep slope of the column density distribution. The Schaye (2001) prescription yields a divergent baryon fraction at low , owing to an inverse dependence of size on column density, which must break down well above the limit employed here. On the other hand, at 1014.5 cm-2, the 100 kpc size assumed in Paper II probably becomes too large for many absorbers at higher column densities (Cen & Simcoe 1997; Tripp et al. 2002). Thus, the most conservative, and we believe most accurate approach, is to use our Paper II method at low columns and the Schaye (2001) method at high columns. This technique yields values of 222% below cm-2, and % above that column density, for a total baryon fraction in the low- photoionized IGM of % (Paper IV). Because the baryon fraction is dominated by the lowest column density absorbers, our result is relatively insensitive to the assumed -values for individual absorbers. Here, we have used km s-1, which is comparable to the median km s-1 found by Davé & Tripp (2001) using medium-resolution echelle spectra.
In order to make further progress in the baryon census of warm IGM gas, it is important to: (1) estimate absorber sizes and shapes (and thus equivalent cloud radii) as a function of column density. In the absence of observations of many QSO pairs, this is best done using numerical simulations (the Cen & Simcoe [1997] analysis, but for simulations at ); (2) estimate the percentage of Ly absorbers that are collisionally ionized rather than photoionized. This will require observations of O VI with FUSE or HST to address the “double-counting” issue; see § 3.2; (3) observe a much longer pathlength for Ly absorbers, since we find that the bias introduced by cosmic variance is still significant for the observed redshift pathlength, (Paper IV); (4) determine more accurate H I column densities from FUSE observations of higher Lyman lines and a curve-of-growth analysis (e.g., Shull et al. 2000; Sembach et al. 2001) for saturated absorbers; and (5) observe a few very bright targets over very long integration times ( orbits) to push the detection limits below cm-2; very weak absorbers can still contribute to the baryon budget.
3.2 The Warm-Hot IGM
The search for the WHIM gas has now begun, using sensitive UV resonance absorption lines: primarily the O VI lithium-like () doublet (1031.926, 1037.617 Å) but also the Li-like doublet of Ne VIII (770.409, 780.324 Å) – see Savage et al. (2004). The O VI lines can be observed with HST/STIS for IGM absorbers with , while the FUSE spectrographs can observe O VI essentially down to . The K-shell X-ray absorption lines of O VII (21.602 Å), O VIII (18.97 Å), N VII (24.782 Å), Ne IX (13.447 Å), and a few other highly ionized species can (barely) be observed with Chandra and XMM/Newton, primarily toward X-ray flaring blazars. As mentioned in § 2, there now exists a substantial number (35 to our knowledge) of STIS medium-resolution echelle spectra of QSOs. However, fewer than half of these targets have sufficient redshift () and continuum signal-to-noise ratio (S/N per resolution element) to facilitate a sensitive search for O VI absorption. Thus far, only a modest pathlength has been searched for O VI absorbers with HST (Tripp, Savage, & Jenkins 2000; Savage et al. 2002). These spectra yield measured baryon fractions of 5–10% (assuming 10% O/H metallicity), consistent with expectations from simulations (Gnedin & Ostriker 1997; Cen et al. 2001; Fang & Bryan 2001). We caution that these estimates involve large uncertainties, including untested assumptions of cloud sizes and shapes, metallicities, ionization equilibrium, and multi-phase structure.
The multiphase nature of IGM absorbers leads directly to the classic census problem of “double counting”. In the IGM context, this means that the photoionized H I and O VI absorbers could count the same baryons twice. Recent surveys down to 50 mÅ equivalent width give H I line densities approximately ten times those of the O VI absorbers: (Paper IV) and (Savage et al. 2002). Many IGM absorbers (Shull et al. 2003) as well as Galactic high velocity clouds (Collins et al. 2004) clearly contain gas at vastly different temperatures, in order to explain the observed range of ionization stages. Deriving the metallicities of such complex systems requires subtle ionization modeling: collisional vs. photoionization, time-dependent ionization, range of temperatures, inhomogeneities in density and velocity.
Theoretical considerations of the shocked IGM (Davé et al. 1999) suggest that collisional ionization dominates the stronger O VI systems, although some weak O VI absorbers have been modeled successfully using photoionization equilibrium (Tripp et al. 2001). The problem with these photoionization models for high ions is that they require a large photoionization parameter () to produce sufficient O VI. At fixed ionizing radiation intensity, , this requires very low hydrogen densities, cm. As a result, photoionization models with high- and low- are physically implausible, since they produce a low neutral fraction,
| (3) |
and unrealistically large absorption pathlengths,
| (4) |
Here, we have scaled the low-redshift parameters to H I photoionization rate , a temperature , and a typical strong H I absorber with . Shull et al. (1999) find that 0.3–0.7 at ; the ionization rate can also be written , where is the specific intensity at 1 ryd and is the mean spectral index of the ionizing radiation. Thus, some of the photoionized baryons in the O VI absorbers may have been accounted for by the H I calculation in the previous section. However, the hotter, collisionally ionized O VI should represent a distinct thermal phase from the H I.
A substantial survey of O VI absorbers may reveal systematics among the O VI absorbers that will allow us to separate the collisionally-ionized absorbers from the photoionized absorbers and thus unravel the double-counting problem. Ongoing STIS echelle spectroscopy by Tripp, Savage, Howk, and others will go a long way towards answering these questions and better quantifying the “O VI forest” statistics. Equally important to this effort is ongoing FUSE spectroscopy of lower-redshift O VI with complementary Ly data from Hubble. To date, we have found 114 Ly absorbers ( mÅ) with acceptable O VI data, and roughly half (57 systems) are detected in O VI at significance (Danforth & Shull 2004). This combined HST/FUSE database can address important questions concerning the extent to which metals are spread away from galaxies into the IGM. While much data exist and more is scheduled to be obtained, these are still early days.
If the study of the O VI absorbers is still in its infancy, the detection of the remainder of the WHIM gas is not yet “out of the womb”. Simulations predict that this hotter WHIM (106-7 K) contains 20–40% of the total local baryons. Nicastro (2003) claims that WHIM gas at K has been detected at along several sightlines, through absorption lines of O VI with FUSE and of C VI, O VII, O VIII, N VII, and Ne IX with Chandra and/or XMM/Newton. However, it is possible that this gas is not intergalactic at all, but instead resides in smaller physical regions in the halo of the Milky Way (Sembach 2002; Shull 2003; Fox et al. 2004; Collins et al. 2004). While two groups have claimed WHIM detections at in the sightlines of PKS 2155-304 (Fang et al. 2002) and H1821+643 with Chandra (Mathur et al. 2003), neither of these results has been confirmed. The PKS 2155-304 detection has been refuted by XMM/Newton observations (Rasmussen et al. 2003; Cagnoni et al. 2004).
Recently, two new WHIM detections were obtained (Nicastro et al. 2004) toward the blazar Mrk 421 at , while it flared in X-rays. The claimed O VII absorbers lie at (where a Ly absorber was identified by Shull, Stocke, & Penton 1996) and (where we see no Ly or O VI absorbers to limits of 30 mÅ and 20 mÅ, respectively). The absorber was detected in three X-ray lines (N VI, N VII, O VII) at significance each, while the absorber was seen in only O VII at significance (but not in O VIII). The O VIII/O VII is consistent with WHIM at temperatures log 5.7–6.5. Over the small observed pathlength, , these detections yield an O VII line density, , of 2–4 times that of O VI, with large uncertainty. The O VII columns ( cm-2) are times those typically seen in O VI. Therefore, the baryon fraction in the O VII-bearing gas could be anywhere from 20–70%, with enormous uncertainties arising from cosmic variance of this one short sightline.
A possible one-line WHIM detection in the Chandra spectrum of 3C 120 (McKernan et al. 2003) yields a similar O VII line density and baryon fraction. Obviously, the statistics of these studies are poor, and the model assumptions substantial. Sadly, the prospects of further observations with Chandra are remote; when Mrk 421 was observed it was the brightest extragalactic source in the sky (the brightest extragalactic soft X-ray sources tend to be blazars). Because the velocity resolution of Chandra’s Low Energy Transmission Grating is only 1000 km s-1, one worries about the proximity (900 km s-1) of the absorber to the blazar redshift (). Thus, the absorber might be outflowing gas along a jet and not intervening WHIM at all. Taking this observational program to the level of FUSE (or even HST) may have to await the Constellation-X grating spectrographs.
4 The Relationship Between Ly Absorbers and Galaxies
While the baryon census and its evolution are ample reasons for studying the local Ly forest in detail, it is also only at low redshift that the locations of Ly absorbers and galaxies can be compared accurately. This allows the relationship between these “clouds” and galaxies to be determined to some degree of certainty. However, the degree to which absorbers correlate with individual galaxies has been controversial. Lanzetta et al. (1995) and Chen et al. (1998, 2001) argue that the Ly absorbers are the very extended halos of individual galaxies, while others (Morris et al. 1993; Stocke et al. 1995; Impey, Petry, & Flint 1999; Davé et al. 1999; Papers III and V) argue that the absorbers are related to galaxies only through their common association with large-scale gaseous filaments, arising from overdensities in the high-redshift universe. Much of the difference between these results primarily reflects the column density range of the Ly absorbers studied in each case; at some level both sides to this argument are correct (see conference papers in Mulchaey & Stocke 2002). In this section, we review the current evidence for the relationship between galaxies and Ly absorbers as a function of H I column density.
4.1 The Damped Ly Absorbers (DLAs)
At the highest column densities ( cm-2) Ly exhibits broad damping wings that allow an accurate determination of H I column density. This has proved valuable for studying the evolution of the chemical abundance of galaxies with cosmic time, since even quite weak metal lines are detectable in these systems with high-quality spectra (e.g., Pettini et al. 1999; Prochaska & Wolfe 2000, 2002). DLAs have also been used to measure the evolution of the amount of neutral gas in galaxies (Boissier et al. 2003). However, clues about the types of galaxies probed by the DLAs are largely circumstantial at high redshift. Thick disks of massive galaxies are suggested by the kinematics (Wolfe & Prochaska 2000), but are hardly demanded by the evidence. Surveys of DLAs with HST (e.g., Rao & Turnshek 2000; Turnshek et al. 2002) and their subsequent imaging with large-aperture ground-based telescopes (Nestor et al. 2002; Rao et al. 2003) have shown convincingly that no single galaxy population dominates the DLAs. Surprisingly, there is a large contribution to DLAs made by dwarf and low surface brightness (LSB) galaxies (see Bowen, Tripp, & Jenkins 2001 for an excellent example) in contrast to the Wolfe & Prochaska (2000) kinematic analysis. Until recently, an apparent contradiction existed between the cross-sectional areas on the sky covered by high column density H I at as measured either by DLAs or by 21 cm emission maps (Rao & Briggs 1993). However, new “blind” 21 cm surveys (Zwaan et al. 2001; Rosenberg & Schneider 2003) show that the 21-cm cross-sectional area now agrees with the DLA measurement at low-.
These new surveys also show that the galaxy populations detected by these two different methods now agree. Rosenberg & Schneider (2003) find that DLA galaxies span a wide range of total H I masses (two-thirds are between ) and luminosities 0.01–1 . Thus, the chemical abundance data from DLAs at high- must be interpreted with these new HST ground-based results in mind; that is, the chemical abundance evolution refers to H I disks and amorphous H I clumps in a wide variety of galaxies. This certainly explains the broad spread in DLA metallicities at any one redshift.
4.2 Lyman Limit Absorbers
In the range cm-2, the Lyman Limit System (LLS) absorbers constitute a substantial number ( 1–3 per unit redshift) of intervening systems in the spectra of high- QSOs. As shown by Steidel (1995, 1998), strong ( Å) Mg II absorbers at are invariably also LLSs, although a few DLAs are also present in such samples. Physically, this can be understood because H I and Mg II have similar ionization potentials, so that once hydrogen becomes optically thin, Mg II ionizes rapidly to Mg III. In an important pre-HST result, Steidel (1995, 1998) found that, of 58 LLSs in his sample, 55 could be identified with nearby ( kpc offsets), bright () galaxies at the same redshift (see also Bergeron & Boissé 1991). These results have been strengthened by obtaining ground-based spectra of the underlying stellar kinematics of the associated galaxies and HST imaging and UV spectra of the C IV absorptions in these systems (Churchill et al. 2000; Steidel et al. 2002). These results suggest that the LLSs are almost exclusively the bound gaseous halos of luminous galaxies, and that these halos share the kinematics of the underlying stellar disk.
Recently, HST observations of the quasar 3C 232 probed the halo of the modest starburst galaxy NGC 3067. The spectra show a complex LLS with three absorption components at small radial velocity differences (, and km s-1) from the nucleus of NGC 3067, in ions ranging from Na I and Ca II detected optically (Stocke et al. 1991) to Mg I, Mg II, Fe II and Mn II in the near-UV (Tumlinson et al. 1999) to Si IV and C IV in the far-UV. Surprisingly, all these species share the same three velocities (Keeney et al. 2005), which are gravitationally bound to NGC 3067; two of the systems, including the strongest at cm-2, are infalling. The 3C 232 sightline has an offset of kpc from the nucleus of NGC 3067; the sightline clearly penetrates extra-planar H I, seen in 21 cm emission with the VLA (Carilli & van Gorkom 1992). The H I column densities, kinematics, metallicity, spin temperature, and inferred size of these clouds are similar to high velocity clouds in the Milky Way. Thus, despite a modest starburst ( yr-1) in this galaxy, even the high ionization gas does not appear to be escaping. In summary, both the detailed HST and ground-based observations of this nearby LLS and the cumulative data from the Steidel LLS sample are consistent with LLSs being the bound, gaseous halos of luminous galaxies.
4.3 Weak Metal-line Systems
Both the HST QSO Absorption Line Key Project and our GHRS/STIS Ly survey of Papers I–IV have found large numbers of intermediate column density ( cm-2) Ly absorbers at low redshift. Available HST or FUSE spectra are not sensitive enough to detect metals (C II/III/IV, Si II/III/IV, O VI) in these absorbers, except in a few cases at cm-2. For example, metallicities have been measured to 1–10% of solar values in strong Ly absorbers in the sightlines toward 3C 273 (Sembach et al. 2001; Tripp et al. 2002), PKS 2155-304 (Shull et al. 1998, 2003), PG 1259+593 (Richter et al. 2004), and PG 1211+143 (Tumlinson et al. 2004). In an ongoing survey, Danforth & Shull (2004) have found that 50% of all Ly absorbers contain both H I and O VI in the range for which high-quality FUSE spectra exist. The “multiphase ratio”, N(H I)/N(O VI), varies substantially, from to greater than 100 (Shull 2003; Danforth & Shull 2004), probably indicating a wide range in shock velocities, and possibly O/H abundances, in these multiphase systems.
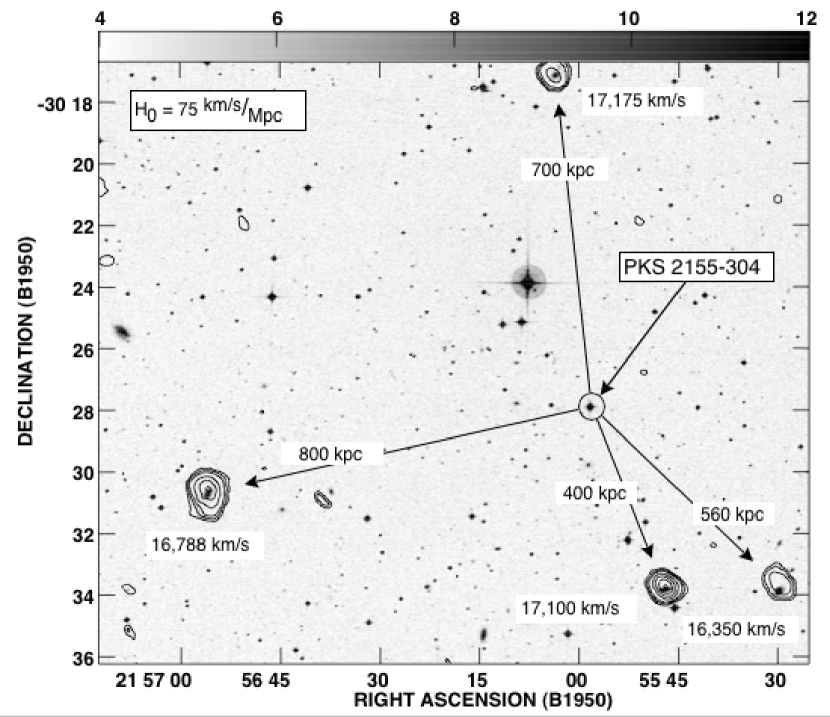
Given these statistics, it is conceivable that a large fraction of Ly absorbers at cm-2 contain metals. The O VI non-detections are either at lower ionization (lower shock velocity) than allows significant columns of O VI, or at slightly lower metallicity than the FUSE sensitivity limits can detect. Since most or all Ly absorbers at in this column density range contain C IV and/or O VI absorption lines at metallicities to (e.g., Schaye et al. 2000), it is not surprising that many low column density, low- absorbers would contain some metals. Thus, some relationship with nearby galaxies is expected. Figure 4 shows the galaxies surrounding the sightline to PKS 2155-304, coincident with a cluster of strong Ly absorbers, in which C IV or Si III have not been detected to a limit of 3% solar metallicity (there are two weak O VI absorbers detected by FUSE).
Lanzetta et al. (1995) and Chen et al. (1998, 2001) obtained deep images and multi-object spectroscopy for a large number of galaxies in the fields of Key Project absorbers. Lanzetta et al. (2002) summarizes the evidence for a 30% success rate in matching redshifts of absorbers and luminous galaxies within kpc of the sightline. They then extrapolate to the conclusion that all FOS-discovered Ly absorbers can be associated with very extended galaxy halos. Chen et al. (1998) found that, with the exception of a weak dependence on galaxy luminosity, there is no nearest-galaxy property that correlates with absorber properties. On the other hand, using Ly absorbers at somewhat lower column densities, Morris et al. (1993), Tripp, Lu, & Savage (1998), Impey, Petry, & Flint (1999) and our Papers III and V found no convincing statistical evidence that these GHRS- and STIS-discovered absorbers are associated with individual galaxies down to luminosities. However, over 3/4 of these weak absorbers are found in galaxy large-scale structure filaments (Paper III), with bright galaxies several hundred kpc away. Stocke (2002) summarizes the evidence in favor of this position. At the extremes of the column density range are obvious examples that both of these positions are correct for some absorbers; at the high- end of this range, LLSs are so close to the nearby bright galaxy that an association of some sort seems inevitable.
On the other hand, an increasing percentage of lower column density absorbers are found in galaxy voids (Papers III and V), more than Mpc from the nearest bright or faint galaxy (McLin et al. 2001). At intermediate , the absorbers adjacent to gas-rich galaxies do not have velocities consistent with rotation curves of the nearby galaxy. This suggests no kinematic link to the nearby galaxy (Côté et al. 2002; Putman et al. 2004), in contrast to the Steidel et al. (2002) kinematic analysis of LLSs and their associated galaxies that often shows a relationship between absorber metal-line velocities and the kinematics of the underlying stellar disk.
Recently, the discovery (Stocke et al. 2004) of a dwarf (, ) post-starburst galaxy kpc from a weak-metal line absorber (Figure 5) with cm-2 suggests a solution compatible with all the data presented above. Not only do the absorber and galaxy redshifts match to within their combined errors, but the absorber metallicity (6% solar) and the mean stellar metallicity of the galaxy (10% solar) approximately match. Further, the absorber has an overabundance of silicon to carbon indicative of recent supernova type II enrichment. The galaxy is a pure disk system whose optical spectrum has both strong Balmer and metal absorption lines, and no evidence for dust or gas (no emission lines and ; van Gorkom et al. 1993). From ratios of Lick absorption-line indices, we estimate that the mean stellar age in this galaxy is Gyrs. Taken together, this information provides a consistent picture in which a massive ( yr-1) starburst Gyrs ago created enough supernovae to blow away the remaining gas from this galaxy into the IGM. Because the dwarf is quite low mass, this wind can easily escape from the galaxy and move to kpc at the required 20–30 km s-1 to create the metal-line absorber that we see between us and 3C 273.
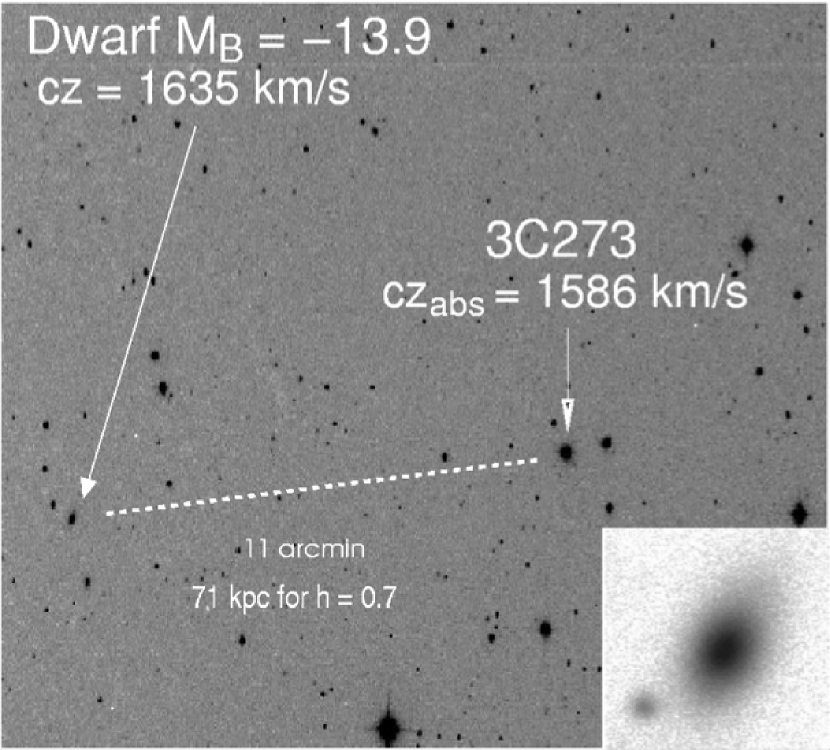
Because this is the nearest weak metal-line system known, many other similar absorbers could arise from starburst winds produced by dwarf galaxies too faint to be detected by the above surveys (at , a galaxy like this dwarf would have ). This explains why Lanzetta et al. (1995) found bright galaxies kpc away that do not have properties that correlate with absorber properties. These absorbers were produced not by the bright galaxy, but by a dwarf or dwarfs that accompany the bright galaxy. This also explains the correlation between absorber locations and large-scale structure in the samples of Paper III and Impey, Petry & Flint (1999). Because dwarf galaxies are so numerous (1–3 Mpc-3), if each dwarf galaxy had at least one massive starburst that ejected most or all of the gas from the galaxy to a distance of kpc, this process would be sufficient to create several hundred weak metal-line absorbers per unit redshift. This number is comparable to the line density of all metal-line absorbers at . While this dwarf galaxy would have been much more luminous () when it was “starbursting”, the present-day absence of gas means that it will no longer form stars and will eventually fade to the approximate luminosity of a Local Group dwarf spheroidal. Thus, the dwarf in Figure 5 is the expected intermediate stage between the “faint blue galaxies” seen at and the present-day dwarf spheroids (Babul & Rees 1992). That such “Cheshire Cat” galaxies might be responsible for a large portion of the Ly forest was suggested by Salpeter (1993) and Charlton (1995).
However attractive this solution appears, based upon this one example, an equally plausible solution consistent with all available data is that large-scale filaments of galaxies are enriched with metals throughout the filament to approximately the same metallicity. In this picture, metal enrichment is not due to any one galaxy. Indeed, in some environments, this almost has to be the case. In the Virgo Cluster, studied through QSO absorption line probes by Impey, Petry & Flint (1999), no nearby dwarf galaxies were found, despite a galaxy redshift survey complete to . In some cases (the km s-1 H I O VI absorber toward 3C 273, Tripp et al. 2002; and the 1666 km s-1 metal-line absorber toward RXJ 1230.8+0115, Rosenberg et al. 2003) weak metal-line absorbers have no nearby ( kpc) galaxies, despite a considerable redshift survey effort. While our galaxy surveying continues in these directions, these two hypotheses may not be easy to discriminate. However, a statistical study of the distances that metal-enriched gas extends away from galaxies may help to select the better model.
4.4 Ly-only Absorbers
Many of the lowest- absorbers could be metal-free, a hypothesis consistent with all available data at high and low redshift. Although HST does not have the sensitivity to address this question directly, there is considerable circumstantial evidence in favor of this hypothesis. While 80% of all low column density Ly absorbers are found in galaxy filaments, the remaining 20% and an increasing percentage of absorbers with decreasing column densities, are found Mpc from the nearest bright galaxy. A deep survey of the few nearest examples of “void absorbers” (McLin et al. 2002) found no faint galaxies ( to , depending on sightline) within several hundred kpc of these absorbers. Thus, there is no plausible nearby source for metals in these absorbers. In Paper IV, we presented a two-point correlation function (TPCF) in absorber velocity separation that showed excess power at km s-1 but only for the higher column density absorbers in our sample ( mÅ). The lower column density absorbers (log ) appear to be randomly distributed in space with no excess power at any (Paper IV). Searches for metals in the highest column density “void absorbers” are capable of setting metallicity limits at (B. Keeney 2004, private communication), but some high- absorbers contain metals at even lower metallicities. Therefore, even deeper HST observations of very bright targets are required to test this interesting hypothesis.
5 The Future
When HST Servicing Mission 4 was still scheduled, the installation of the Cosmic Origins Spectrograph (COS) on HST was eagerly awaited by astronomers who study the local IGM. With 10–20 times the far-UV throughput of STIS at comparable (15 km s-1) resolution, COS would revolutionize low- Ly absorption work by allowing us to obtain high-resolution, high signal-to-noise ratio spectra of 16th – magnitude QSOs in a few orbits. STIS studies of the IGM require ever-increasing numbers of orbits to address new science goals. Below is a sampling of the questions that either STIS or COS can address; those that truly require COS are noted with asterisks (*):
-
1.
Baryons in the WHIM. How many are there? Where are they relative to galaxies? What are the ionization processes that create the observed absorption-line signatures?
-
2.
Galaxy halo sizes, shapes, metallicities and kinematics.∗ A few of the brightest examples can be attempted with STIS, but to provide gaseous halo properties as a function of galaxy type and luminosity is clearly a COS project.
-
3.
Low column density Ly absorbers.∗ How many baryons do these absorbing clouds contain? Do they contain metals and at what metallicity? This is a particularly interesting question for those absorbers in voids, which are the most obvious locations to search for primordial hydrogen clouds, if they exist. Their metals provide an important “fossil record” of very early star formation.
-
4.
Extent of Metal Transport away from Galaxies.∗ How far away from star formation sites do metals spread in the IGM? What types of galaxies are responsible for enriching the IGM in metals? Can details of nucleosynthesis be found in the IGM to understand early star formation history and evolution?
-
5.
Accurate H I Column Densities. FUSE observations of higher Lyman lines can be used to obtain accurate H I column densities by curve-of-growth techniques. These are also essential for accurate metallicities. Therefore, this goal is best carried out while FUSE and HST are both still operational.
-
6.
Physical properties of IGM absorbers. The column density distribution, -value distribution (temperature), detailed relationship to galaxies and other properties are still affected by cosmic variance. Obtaining 10–20 high signal-to-noise STIS medium-resolution echelle spectra or a similar number of high-quality COS spectra of QSOs would be sufficient to address concerns about cosmic variance for Ly absorbers, but not for the rarer O VI absorbers. For O VI, FUSE spectroscopy of already detected Ly absorption lines appears to be a viable route to obtaining a sufficient sample. One could also use HST/STIS data on QSO targets at (to shift O VI or into the HST/STIS band). This project also means observing fainter targets for many more orbits.
-
7.
Size of IGM absorbers in galaxy filaments and voids.∗ QSO pairs available to perform these observations are too faint to observe adequately with STIS.
As nearly everyone has noticed over the past decade, the IGM
has attracted considerable interest from the fields of cosmology,
galaxy formation, and galactic chemical evolution. Even at low
redshift, a substantial fraction (30–60%) of the baryons reside in
the IGM, where they influence the mass infall and chemical history of gas
in galaxies, including the Milky Way.
If this “cosmic web” of multi-phase (photoionized, collisionally
ionized) gas truly represents a significant baryon reservoir
(Shull 2003; Sembach 2003), one of the best scientific legacies
from Hubble (and FUSE) will be an accurate characterization
of its features.
Acknowledgements
Financial support for the local Ly forest work at the University of Colorado comes from grants provided through HST GO programs 6593, 8182, 8125, 8571, 9221, 9506, 9520, and 9778 from the FUSE Project (NASA contract NAS5-32985, grant NAG5-13004), and theoretical grants from NASA/LTSA (NAG5-7262) and NSF (AST02-06042). We thank Ray Weymann for the faint-galaxy redshift survey work and his inspirational leadership in this field. We thank Mark Giroux for ionization modeling and insightful comments. We thank our other collaborators, Brian Keeney, Jessica Rosenberg, Jason Tumlinson, John Hibbard, Charles Danforth, and Jacqueline van Gorkom for valuable contributions and discussions, and F. Nicastro and B. Keeney for permission to quote their results before publication.
References
- (1)
- (2) Babul, A., & Rees, M. J. 1992, MNRAS, 255, 346
- (3) Bahcall, J. N., et al. 1991, ApJ, 377, L5
- (4) Bahcall, J. N., et al. 1993, ApJS, 87, 1
- (5) Bahcall, J. N., et al. 1996, ApJ, 457, 19
- (6) Bechtold, J., et al. 1994, ApJ, 437, L38
- (7) Bergeron, J., & Boissé, P. 1991, A&A, 243, 344
- (8) Boissier, S., Péroux, C., & Pettini, M. 2003, MNRAS, 338, 131
- (9) Bowen, D. V., Blades, J. C., & Pettini, M. 1996, ApJ, 464, 141
- (10) Bowen, D. V., & Pettini, M. 2003, in The IGM/Galaxy Connection, eds. J. L. Rosenberg & M. E. Putman (Kluwer: Dordrecht), 133
- (11) Bowen, D. V., Pettini, M., & Blades, J. C. 2002 ApJ, 580, 169
- (12) Bowen, D. V., Tripp, T. M., & Jenkins, E. B. 2001, AJ, 121, 1456
- (13) Cagnoni, I., Nicastro, F., Maraschi, L., Treves, A., & Tavecchio, 2004, ApJ, 603, 449
- (14) Carilli, C. L., & van Gorkom, J. H. 1992, ApJ, 399, 373
- (15) Cen, R., & Ostriker, J. P. 1999, ApJ, 519, L109
- (16) Cen, R., & Simcoe, R. A. 1997 ApJ, 483, 8
- (17) Cen, R., Tripp, T. M., Ostriker, J. P., & Jenkins, E. B. 2001, ApJ, 559, L5
- (18) Charlton, J. C. 1995, in QSO Absorption Lines, ed. G. Meylan (Berlin: Springer), 405
- (19) Chen, H.-W., et al. 1998, ApJ, 498, 77
- (20) Chen, H.-W., et al. 2001, ApJ, 559, 654
- (21) Churchill, C. W., et al. 2000, ApJ, 543, 577
- (22) Collins, J. A., Shull, J. M., & Giroux, M. L 2004, ApJ, 605, 216
- (23) Côté, S., et al. 2002, in The Dynamics, Structure, & History of Galaxies, ed. G. S. Da Costa & H. Jerjen, (ASP: Provo), Vol. 254, 353
- (24) Danforth, C., & Shull, J. M. 2004, ApJ, in preparation (also BAAS, Vol. 36, 679, Meeting 204, #15.03)
- (25) Davé, R., Hernquist, L., Katz, N., & Weinberg, D. H. 1999, ApJ, 511, 521
- (26) Davé, R., et al. 2001, ApJ, 552, 473
- (27) Davé, R., & Tripp, T. M. 2001, ApJ, 553, 528
- (28) Dinshaw, N., Weymann, R. J., Impey, C. D., Foltz, C. B., Morris, S. L., & Ake, T. 1997, ApJ, 491, 45
- (29) Fang, T.-T., & Bryan, G. L. 2001, ApJ, 561, L31
- (30) Fang, T.-T., Canizares, C., et al. 2002, ApJ, 572, L127
- (31) Fox, A. J., et al. 2004, 602, 738
- (32) Fukugita, M. 2004, in Dark Matter in Galaxies, IAU Symposium 220, Sydney, 21-25 July, 2003, astro-ph/0312517
- (33) Gnedin, N. Y., & Ostriker, J. P. 1997, ApJ, 486, 581
- (34) Impey, C. D., Petry, C. E., & Flint, K. P. 1999, ApJ, 524, 536
- (35) Janknecht, E., Baade, R., Reimers, D. 2002, A&A, 391, 11
- (36) Jannuzi, B. T., et al. 1998, ApJS, 118, 1
- (37) Kim, T.-S., et al. 1997, AJ, 114, 1
- (38) Kim, T.-S., Cristiani, S., & D’Odorico, S. 2001, A&A, 373, 757
- (39) Keeney, B. A., Stocke, J. T., Momjian, E., Carilli, C. L., & Tumlinson, J. 2005, in preparation
- (40) Kirkman, D., Tytler, D., Suzuki, N., O’Meara, J. M., & Lubin, D. 2003, ApJS, 149, 1
- (41) Lanzetta, K. M., et al. 2002, in Extragalactic Gas at Low Redshift, eds. J. Mulchaey & J. Stocke, (Provo: ASP), Vol. 254, 78
- (42) Lanzetta, K. M., Bowen, D. V., Tytler, D., & Webb, J. K. 1995, ApJ, 442, 538
- (43) Lu, L., Wolfe, A., & Turnshek, D. 1991, ApJ, 367, 19
- (44) Mathur, S. Weinberg, D. H., & Chen, X. 2003, in The IGM/Galaxy Connection, eds. J. L. Rosenberg & M. E. Putman (Kluwer: Dordrecht), 103
- (45) McKernan, B., Yaqoob, T., Mushotzky, R., George, I. M., & Turner, T. J. 2003, ApJ, 598, L83
- (46) McLin, K. M., Stocke, J. T., Weymann, R. J., Penton, S. V., & Shull, J. M. 2002, ApJ, 574, L115
- (47) Morris, S. L., Weymann, R. J., Savage, B. D., & Gilliland, R. L. 1991, ApJ, 377, L21
- (48) Morris, S. L., et al. 1993, ApJ, 419, 524
- (49) Mulchaey, J. S., & Stocke, J.T. 2002, in Extragalactic Gas at Low Redshift (Provo: ASP Vol 254)
- (50) Nestor, D. B., Rao, S. M., et al. 2002, in Extragalactic Gas at Low Redshift, ed. J. Mulchaey & J. Stocke (Provo: ASP), Vol. 254, 34
- (51) Nicastro, F. 2003 in The IGM/Galaxy Connection, eds. J. L. Rosenberg & M. E. Putman (Kluwer: Dordrecht), 277
- (52) Nicastro, F., et al. 2004, ApJ, submitted
- (53) Penton, S. V., Stocke, J. T., & Shull, J. M. 2000a, ApJS, 130, 121 (Paper I)
- (54) Penton, S. V., Shull, J. M., & Stocke, J. T. 2000b, ApJ, 544, 150 (Paper II)
- (55) Penton, S. V., Stocke, J. T., & Shull, J. M. 2002, ApJ, 565, 720 (Paper III)
- (56) Penton, S. V., Stocke, J. T., & Shull, J. M. 2004, ApJS, 152, 29 (Paper IV)
- (57) Pettini, M., Ellison, S. L., Steidel, C. C., & Bowen, D. V. 1999, ApJ, 510, 576
- (58) Prochaska, J. X., & Wolfe, A. M. 2000, ApJ, 533, L5
- (59) Prochaska, J. X., & Wolfe, A. M. 2002, ApJ, 566, 68
- (60) Putman, M. E., Rosenberg, J. L, Ryan-Weber, E. V., & Stocke, J. T. 2004, BAAS, 204, 7902
- (61) Rao, S. M., & Briggs, F. 1993, ApJ, 419, 515
- (62) Rao, S. M., & Turnshek, D. A. 1998, ApJ, 500, L11
- (63) Rao, S. M., & Turnshek, D. A. 2000, ApJS, 130, 1
- (64) Rao, S. M., et al. 2003, ApJ, 595, 94
- (65) Rasmussen, A., Kahn, S. M., & Paerels, F. 2003, in The IGM/Galaxy Connection, eds. J. L. Rosenberg & M. E. Putman (Kluwer: Dordrecht), 109
- (66) Rauch, M., et al. 1997, ApJ, 489, 7
- (67) Richter, P., Savage, B. D., Tripp, T. M., & Sembach, K. R. 2004, ApJS, 153, 165
- (68) Ricotti, M., Gnedin, N. Y., & Shull, J. M. 2000, ApJ, 534, 41
- (69) Rosenberg, J. L., & Schneider, S. E. 2003, ApJ, 585, 256
- (70) Rosenberg, J. L., Ganguly, R., Giroux, M. L., & Stocke, J. T. 2003, ApJ, 591, 677
- (71) Salpeter, E. E. 1993, AJ, 106, 1265
- (72) Salucci, P., & Persic, M. 1999, MNRAS, 309, 923
- (73) Savage, B. D., Sembach, K. R, Tripp, T. M, & Richter, P. 2002, ApJ, 564, 631
- (74) Savage, B. D., Lehner, N., Wakker, B. P., & Sembach, K. R, & Tripp, T. M. 2004, ApJ, submitted
- (75) Savaglio, S., et al. 1999, ApJ, 515, L5
- (76) Schaye, J. 2001, ApJ, 559, 507
- (77) Schaye, J., Rauch, M., Sargent, W. L. W., & Kim, T-S. 2000, ApJ, 541, L1
- (78) Sembach, K. R., Howk, J. C., Savage, B. D., Shull, J. M., & Oegerle, W. R. 2001, ApJ, 561, 573
- (79) Sembach, K. R. 2002, in Extragalactic Gas at Low Redshift, ed. J. Mulchaey & J. Stocke (Provo: ASP), Vol 254, 283
- (80) Sembach, K. R., Tripp, T. M., Savage, B. D., & Richter, P. 2004, ApJS, submitted
- (81) Shull, J. M., Stocke, J. T., & Penton, S. 1996, AJ, 111, 72
- (82) Shull, J. M., et al. 1998, AJ, 116, 2094
- (83) Shull, J. M., et al. 1999, AJ, 118, 1450
- (84) Shull, J. M., et al. 2000, ApJ, 538, L13
- (85) Shull, J. M., et al. 2003, ApJ, 594, L107
- (86) Shull, J. M. 2003 in The IGM/Galaxy Connection, eds. J. L. Rosenberg & M. E. Putman (Kluwer: Dordrecht), 1
- (87) Spergel, D. N., et al. 2003, ApJS, 148, 175
- (88) Steidel, C. C. 1995, in QSO Absorption Lines, ed. G. Meylan (Garching: Springer), 139
- (89) Steidel, C. C. 1998, in Galaxy Halos, ed. D. Zaritsky (Provo: ASP), Vol. 136, 167
- (90) Steidel, C. C., et al. 2002, ApJ, 570, 526
- (91) Stocke, J. T. 2002 in Extragalactic Gas at Low Redshift, ed. J. Mulchaey & J. Stocke (Provo: ASP), Vol 254, 98
- (92) Stocke, J. T., Case, J., Donahue, M., Shull, J. M., & Snow, T. P. 1991, ApJ, 374, 72
- (93) Stocke, J. T., Shull, J. M., Penton, S. V., Donahue, M., & Carilli, C. 1995, ApJ, 451, 24
- (94) Stocke, J. T., Keeney, B. A., McLin, K. M., Rosenberg, J. L., Weymann, R. J. & Giroux, M. L. 2004, ApJ, 609, 94
- (95) Stocke, J. T., Penton, S. V., McLin, K. M., Shull, J. M., & Weymann, R. J. 2005, in preparation
- (96) Telfer, R., Zheng, W., Kriss, G. A., & Davidsen, A. F. 2002, ApJ, 565, 773
- (97) Tripp, T. M., Lu, L., & Savage, B. D. 1998, ApJ, 508, 200
- (98) Tripp, T. M., Savage, B. D., & Jenkins, E. B. 2000, ApJ, 534, L1
- (99) Tripp, T. M., et al. 2001, ApJ, 563, 724
- (100) Tripp, T. M., et al. 2002, ApJ, 575, 697
- (101) Tumlinson, J., Giroux, M. L., Shull, J. M., & Stocke, J. T. 1999, AJ, 118, 2148
- (102) Tumlinson, J., Shull, J. M., Giroux, M.L., & Stocke, J. T. 2004, ApJ, submitted
- (103) Turnshek, D. A., Rao, S. M., & Nestor, D. B. 2002, in Extragalactic Gas at Low Redshift, ed. J. Mulchaey & J. Stocke (Provo: ASP), Vol. 254, 42
- (104) van Gorkom, J. H., Bahcall, J. N., Jannuzi, B. T., & Schneider, D. P. 1993, AJ, 106, 2213
- (105) Weymann, R. J., et al. 1998, ApJ, 506, 1
- (106) Wolfe, A. M., & Prochaska, J. X. 2003, ApJ, 545, 603
- (107) Zwaan, M. A., Briggs, F., & Sprayberry, D. 2001, MNRAS, 327, 124