1]Spase Research Institute, Profsoyuznaya str. 84/32, Moscow 117997, Russia 2]Max-Planck-Institut für Astrophysik, Karl- Schwarzshchild str. 1, Garching, Germany 3]INTEGRAL Science Data Center, 1290 Versoix, Switzerland 4]Kazan State University, 420008 Kazan, Kremlevskaya str. 18, Russia 5]Academy of Sciences of Tatarstan, 420000 Kazan, Bauman str. 20, Russia
Variability of X-ray pulsars in a hard energy band observed with INTEGRAL
Abstract
We present the first results of the observations of the X-ray pulsars LMC X-4, 4U0352+309 and EXO1722-363 performed with the INTEGRAL observatory. The LMC X-4 was investigated during the whole superorbital cycle (30 days) and it was found that its period was not stable at this time scale. We detected a variable X-ray flux (18-60 keV) from the pulsar EXO1722-363, which could be connected with the orbital motion in the binary system. A more accurate position and the estimate of the orbital period for this source are reported. We also investigated a hard X-ray spectrum of 4U0352+309 (X Persei) measured with INTEGRAL and report the detection of the cyclotron absorption line at about 29 keV.
keywords:
neutron stars; X-ray pulsars1 Introduction
At the moment more than 60 X-ray pulsars have been found to be members of binary systems. Most of them are concentrated in the Galactic plane and therefore are among the primary targets of the INTEGRAL observatory. We investigated 15 X-ray pulsars — persistent, transient, Be-systems etc., observed in different parts of the INTEGRAL observational programs.
Here we present preliminary results of the analysis of the INTEGRAL data for several sources from this group.
2 Observations and data analysis
The international gamma-ray observatory INTEGRAL was launched by the Russian launcher PROTON from the Baikonur cosmodrome on October 17, 2002 (Eismont et al. 2003). The payload includes four principal instruments to carry out simultaneous observations of sources in the X-ray, gamma-ray and optical energy bands (Winkler et al. 2003). The observational program of the observatory consists of Core and General Programs. The main part of Core Program consist in regular scans of the galactic plane and deep observations of the galactic central radian. General Program is formed from the proposals of scientists. In this work we used the data collected by the detector ISGRI (Lebrun et al. 2003) of the IBIS telescope (Ubertini et al. 2003) and JEM-X telescope (Lund et al. 2003) in frames of both programs as well as during calibration observations.
For imaging and spectral analysis of IBIS/ISGRI data we followed the methods described in Revnivtsev et al (2004). For spectral analysis we used a simple ratio of the flux measured from the source to the fluxes of the Crab nebula in the same energy bands and assumed that the Crab nebula spectrum has the form , where is the number of photons at energy . Our analysis of an extensive set of Crab calibration observations has shown that the source absolute flux can be recovered with an accuracy of 10% and the systematic uncertainty of relative flux measurement in different energy channels is less than 5%. Last value was added to the following spectral analysis as a systematic uncertainty. The analysis of the JEM-X data and the timing analysis of the ISGRI data were performed with the standard package OSA 3.0. 111http://isdc.unige.ch/index.cgi?Soft+soft.
3 LMC X-4
X-ray pulsar LMC X-4 (13.5 s) is a member of a massive binary system with 1.408 day orbital period. In addition, LMC X-4 shows a modulation of X-ray flux with 30.5 day cycle. During approximately 60% of this cycle it is observed in a high intensity state, while during the remaining 40% of the cycle its X-ray flux drops to times lower level (Lang et al. 1981). This periodicity can be attributed to precessing tilted or warped accretion disk, which periodically eclipses X-ray emitting regions.
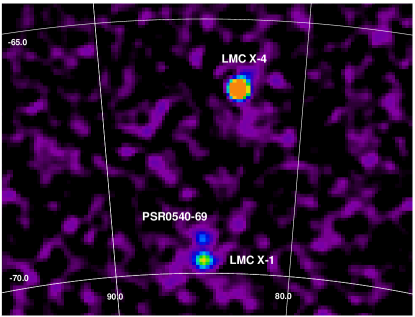
LMC X-4 was observed with INTEGRAL in January 2003 during observations of the Large Magellanic Cloud in the frame of the General Program. More than 1 million seconds of total useful exposure were collected. The X-ray map of the region containing LMC X-4 obtained in the 18-60 keV energy band is shown in Fig.1.
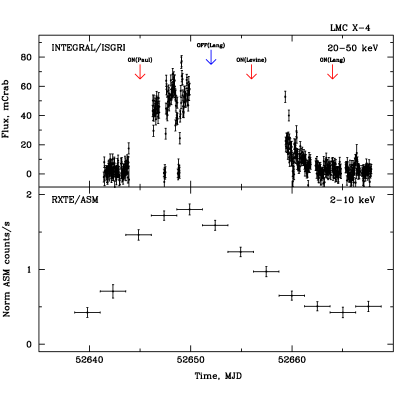
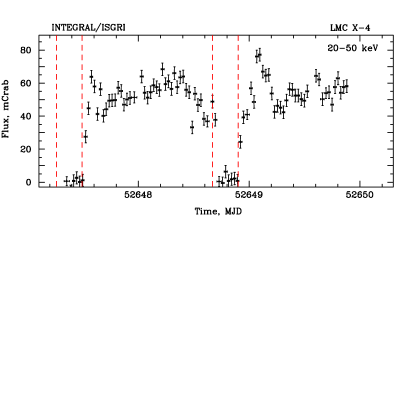
These INTEGRAL observations covered almost whole 30.5 day cycle and allowed us to investigate the source behavior in hard X-rays on different time scales. In the upper panel of Fig.2 the light curve obtained with IBIS/INTEGRAL in the 20-50 keV energy band is presented. The observed turn-on moment does not coincide with those predicted from the previous determinations of the 30.5 day cycle parameters (Lang et al. 1981, Levine et al. 2000, Paul et al. 2002). The average epoch-folded light curve obtained from about 8 years of ASM/RXTE observations is shown in the bottom panel of Fig.2. It is clearly seen that the average turn-on moment does not coincide with the INTEGRAL one. Such discrepancy is the evidence that the period of the 30.5 day cycle is not stable. It seems that this instability of the precessing period is typical for all binary systems where it is observed (see Clarkson et al. 2000). The orbital light curve of LMC X-4 obtained with IBIS/INTEGRAL during two orbital cycles in the high-state is shown in Fig.3. Vertical dashed lines show the moments of X-ray eclipses obtained from the known orbital parameters of the system (Lang et al. 1981). It is interesting to note short increases of the source intensity just after the eclipses, observed in both orbital cycles.
In the standard accretion torque model we can estimate the magnetic dipole moment of LMC X-4 of the order of G cm3, which corresponds to the magnetic field strength on the neutron star surface G. If this is the case, cyclotron spectral feature is expected at energies keV keV (here we take into account gravitational redshift of the neutron star assuming its radius km and mass ). Before INTEGRAL there were several discrepant indications of possible cyclotron line feature in the spectrum of LMC X-4. Different authors (Levine et al. 1991, Mihara 1995, Woo et al. 1996, La Barbera et al. 2001) claimed the detection of a cyclotron absorption line in 19–100 keV energy range.
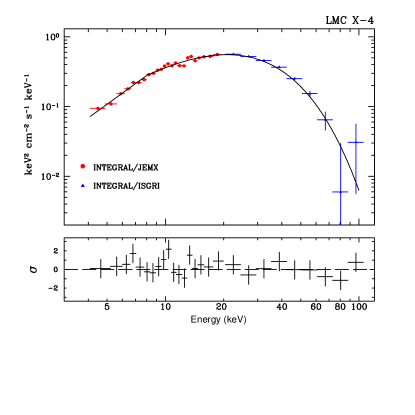
We performed analysis of the LMC X-4 broadband spectrum obtained with JEM-X and IBIS telescopes of the INTEGRAL observatory during 300 kseconds of the source in the high state (Fig.4). This analysis shows that the LMC X-4 average spectrum can be well fitted by a “canonical” pulsar model (White et al. 1983), which consist of a simple powerlaw with the photon index of and a high energy cutoff at keV with keV ( per d.o.f.).
To search for a possible cyclotron resonance absorption line in the source spectrum it was included into the model. A centroid energy of the line was varied from 5 to 100 keV and other parameters were fitted. In this analysis we have not found any indications of the cyclotron resonance absorption in the source spectrum at the level more than . Thus at the moment we cannot confirm any results obtained earlier and make a final conclusion about the magnetic field value in the source. More detailed analysis of the INTEGRAL data is now in progress.
4 EXO1722-363
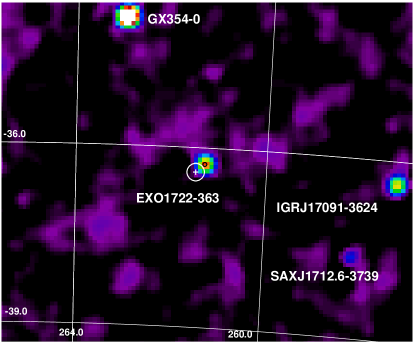
The X-ray pulsar EXO1722-36 was regularly observed by INTEGRAL observatory during the Core Program scans of the Galactic plane and during the ultra deep observations of the Galactic Center. The source was clearly detected with a high statistical significance at the energies up to 60 keV. Angular resolution, available with the INTEGRAL telescopes allowed us to improve the localization of the source (see Lutovinov et al. 2003 for the preliminary results) in comparison with that measured by the EXOSAT observatory (Warwick et al. 1988). The X-ray map of sky around EXO1722-363 is shown in Fig.5. The white cross and the circle represent the EXOSAT position and error circle. The new position measured with IBIS/INTEGRAL, and , is shown with the black circle.
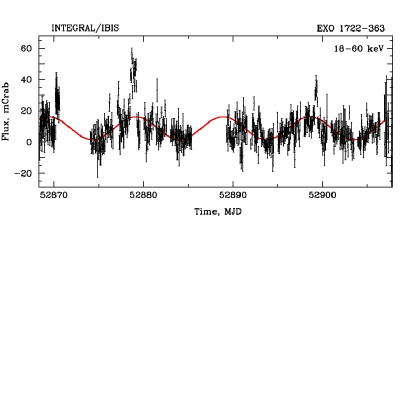
The long term observations of the source during the ultra deep exposure of the Galactic Center revealed variability of the source X-ray flux on time scales of several days. This variability observed with INTEGRAL/IBIS (18–60 keV) was also detected by RXTE in the 3–20 keV energy band (Markwardt, Swank 2003). The RXTE/PCA observations allowed to detect the modulations of EXO1722-363 X-ray flux with a period of days which was interpreted as an orbital period. Our measurements of the orbital period from hard X-ray light curve (Fig.6) gives the value of days, in good agreement with RXTE result.
In order to construct the broadband energy spectrum of the source with highest possible significance we combined the data of the INTEGRAL and RXTE observatories. RXTE observatory performed a number of observations in 1998-2003 covering different orbital phases of the binary. The analysis of the INTEGRAL/IBIS data showed that the shape of the hard X-ray part of the spectrum did not change inspite of the strong flux variability (with possible exception of the eclipse period), therefore in Fig.7 we present the hard X-ray part of the spectrum of EXO 1722-363 averaged over all available data (INTEGRAL/IBIS and RXTE/HEXTE). However, low energy part of the spectrum (3–20 keV) strongly depends on the orbital phase. The value of photoabsorption column strongly varies with the orbital phase and can reach value of the order of cm-2 (see also Tawara et al. 1989). Examples of the source spectrum during different orbital phases are presented in Fig.7. It should be noted that the spectrum of the source detected by the RXTE/PCA is strongly contaminated by a contribution of the Galactic ridge emission. The spectra presented in Fig.7 were corrected for this contribution (using the method similar to that used in Revnivtsev 2003). In this proceedings we will not go into the details of the spectral analysis of the source. A detailed analysis of the source broadband spectral variability will be presented in a separate paper.

5 4U0352+309/X Persei
4U0352+309/X Persei is a low luminosity ( 2 – 4 erg/s) Be/X-ray binary, consisting of the 837 second X-ray pulsar 4U0352+309 and Be star companion optically identified as the star X Persei (HD 24534). Recent BeppoSAX observations showed that the spectrum of the source can be described with a combination of the standard pulsar spectrum model and a powerlaw with both high- and low-energy cut-offs, which dominates above 15 keV (di Salvo et al. 1998). The analysis of the RXTE observations (Coburn et al. 2001) reveals the presence of the cyclotron line at about 29 keV. Be stars are known to have a dense slow disk-like equatorial wind and a low-density fast wind from higher latitudes. The bright state of the star correlates with the presence of the emission lines and is the evidence of the presence of equatorial disk. No clear correlations between the X-ray and the optical properties of the source were found (e.g. Telting et al. 1998).

b]
4U0352+309 was in the field of view of the INTEGRAL/IBIS telescope on August 14, 2003 during the calibration observations of the Crab nebula. The total useful exposure time was about 50 kseconds.The source was detected with an average flux of mCrab in the 20–100 keV energy band. The coherent pulsations with a period of s were detected at the energies up to 100 keV (Fig.8). The pulse profile has a typical shape for this source with one broad peak. Unfortunately, we can only very roughly estimate the source pulse fraction in these energies as % because of a lack of accurate knowledge of the background.
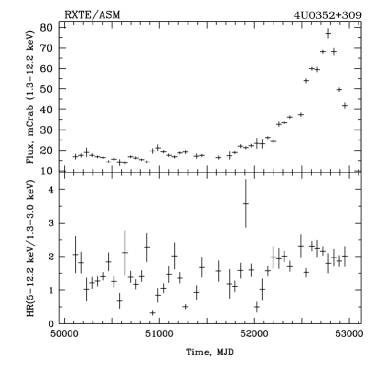
Analysis of the 4U0352+309 light curve obtained with the ASM/RXTE monitor indicates that during last 2 years source intensity in 1.3–12 keV energy band increased by several times and reached its maximum on May 2003 without strong changes in the hardness (Fig.9). Thus observations of 4U0352+309 with INTEGRAL were performed closely to the maximum of the source intensity.
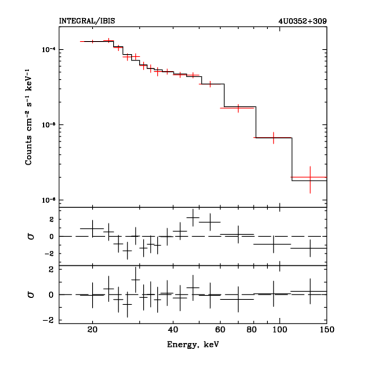
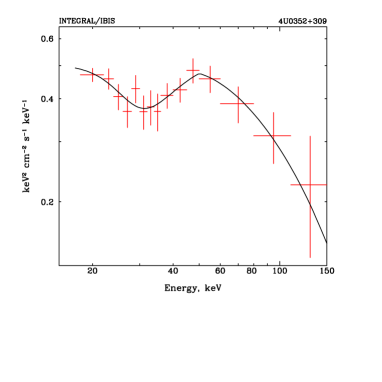
The source spectrum measured with IBIS/INTEGRAL is shown in the upper panel of Fig.10. The dots with error bars represent the pulse-height spectrum (in units of cnts s-1 cm-2 keV-1), and the histogram represents the corresponding model spectrum of the powerlaw with a high energy cutoff which is typical for X-ray pulsars (White et al. 1983). The deviations of the measured spectrum from the model spectra convolved with the instrumental response matrix are shown in the middle panel. It is clearly seen that near 30 keV there is a wide absorption feature, which can be interpreted as a cyclotron resonance absorption line. Addition of this component to the model improves the fit (bottom panel) with a significance of (-test). The best-fit parameters are: photon index , keV, keV, , keV (the cyclotron line width was taken from Coburn et al.(2001) and fixed on 9 keV). The obtained centroid energy of the cyclotron line is in a well agreement with RXTE results (Coburn et al. 2001). The energy spectrum of 4U0352+309 is shown in Fig.11.
We have obtained series of high-resolution optical spectra of X Persei with 1.5-m Russian-Turkish Telescope (RTT150), using its new Coude-echelle high resolution spectrometer. Three high signal-to-noise spectra have been obtained in November 13/14, 2003, January 9/10, 2004 and January 18/19, 2004 in the spectral range 4000-9000 A with a resolution of . Profiles of -line measured in these observations are shown in Fig.12. The registered intensity of line emission was very high and it indicates that the optical star of X Persei binary system was in an active state during the observations.


To search for a possible modulation of the -line intensity on a time scale of the pulsar period a set of 200 short (30 seconds) exposure spectra was obtained on November 13/14, 2003 with the resolution of . We selected for the following analysis 107 spectra with highest S/N ratio. For each spectrum we calculated a ratio of left-to-right peaks intensities of the -line profile. The obtained series cover approximately 8 pulsar periods. All data were binned into 10 pulse phase bins and averaged inside of each of them. The ratio of left-to-right peaks intensities of the -line profile versus a pulse period phase is presented in Fig.13. No significant modulation of the measured value with the pulse period was found.
6 Summary
¿From our preliminary analysis of X-ray pulsars, observed with the INTEGRAL observatory we can conclude:
-
•
no cyclotron line was found in the LMC X-4 spectrum in the 5-100 keV energy band;
-
•
new accurate position was measured for EXO1722-363; possible orbital period day was found;
-
•
unusually bright state of 4U0352+309/X-Persei system was observed; cyclotron resonance absorption feature is detected at keV; no pulsations of emission line flux were detected.
Acknowledgements
Authors thank E.Churazov for the developing of the methods of the analysis of the IBIS data and software. We are thankful to the referee, Andrea Santangelo, for comments which helped to improve the paper. Research has made use of data obtained through the INTEGRAL Science Data Center (ISDC), Versoix, Switzerland, Russian INTEGRAL Science Data Center (RSDC), Moscow, Russia, and High Energy Astrophysics Science Archive Research Center Online Service, provided by the NASA/Goddard Space Flight Center. Work was partially supported by grants of Minpromnauka NSH-2083.2003.2, NSH-1789.2003.2 and 40.022.1.1.1102, RFBR 04-02-17276 and program of Russian Academy of Sciences “Non-stationary phenomena in astronomy”. This work was partially made during visits to the International Space Science Institute (ISSI), Bern which AL, MR, MC, IB, SM, RB, MN thank for the hospitality and financial support. RTT150 Coude-echelle spectrometer has been created under the support of Academy of Science of Tatarstan (AST). IB and NS are grateful to AST for this financial support.
References
- (1) Clarkson, W., Charles, P., Coe, M., Laycock, S. 2003, MNRAS 343, 1213
- (2) Coburn, W., Heindl, W., Gruber, D., et al. 2001, ApJ 552, 738
- (3) di Salvo, T., Burderi, L., Robba, N., & Guainazzi, M., 1998, ApJ 509, 897
- (4) Eismont, N., Ditrikh, A., Janin, G., et al. 2003, A&A, 411, L37
- (5) La Barbera, A., Burderi, L., Di Salvo, T., et al. 2001, ApJ 553, 375
- (6) Lang, F., Levine, A., Bautz, M., et al. 1981, ApJ 246, L21
- (7) Lebrun, F., Leray, J. P., Lavocat, P., et al. 2003, A&A, 411, L141
- (8) Levine, A., Rappaport, S., Zojcheski, G. 2000, ApJ 541, L194
- (9) Lutovinov, A., Revnivtsev, M., Molkov, S. 2003, Astron. Telegram 178, 1
- (10) Markwardt, C., Swank, J. 2003, Astron. Telegram 179, 1
- (11) Mihara, T. 1995, Ph.D. thesis, University of Tokyo
- (12) Paul, B., Kitamoto, S. 2002, JApA 23, 33
- (13) Revnivtsev M. 2003, Astr.Lett. 2003, 29, 644
- (14) Revnivtsev, M., Sunyaev, R., Varshalovich, D., et al. 2004a, Astr. Lett., 30, 382
- (15) Tawara Y., Yamauchi S., Awaki H. 1989, PASJ, 41, 473
- (16) Telting, J., Waters, I., Roche, P., et al. 1998, MNRAS 296, 785
- (17) Ubertini, P., Lebrun, F., Di Cocco, G., et al. 2003 A&A, 411, L131
- (18) Warwick, R., Norton, A., Turner, M., et al. 1988, MNRAS 232, 551
- (19) Winkler, C., Courvoisier, T., Di Cocco, G. et al. 2003, A&A 411, L1
- (20) White, N., Swank, J., Holt, S. 1983, ApJ 270, 771