22institutetext: Space Telescope Science Institute, 3700 San Martin Dr., Baltimore, MD 21210
33institutetext: INAF–Osservatorio Astronomico di Torino, Strada Osservatorio 20, Pino Torinese, I-10025
The nuclear radio–optical properties of intermediate redshift FR II radio galaxies and quasars††thanks: Based on observation obtained at the Space Telescope Science Institute, which is operated by the Association of Universities for Research in Astronomy, Incorporated, under NASA contract NAS 5-26555.
We extend the study of the nuclei of 3CR objects as seen with the HST to higher redshift FR II radio sources (). Our results reflect what has been found for FR II of lower redshift. The position of the nuclei on the plane formed by optical and radio luminosities is related to their optical spectral classification: the nuclei of both high and low excitation galaxies lie on the correlation found for FR I sources, while broad–lined objects have a significant optical excess. The nuclear properties of these sources are better understood when considering the equivalent width of the [OIII] emission line with respect to their optical luminosities. Even in the range of redshift considered here, low excitation galaxies show peculiar nuclear properties, more similar to those observed in FR I. This confirms that not all FR II are unified with quasars. Our findings have important implications for the FR II–quasar unification scheme: by reconsidering the classification of all 3CR radio galaxies with in the light of their nuclear properties, we derive the opening angle of the obscuring torus for different redshift bins. We find that the covering factor of the obscuring structure decreases as redshift increases ( for to for ). We argue that this behavior may be interpreted in the framework of the receding torus model, in which the opening angle of the torus increases as the luminosity of the accretion disk around the central black hole increases.
Key Words.:
Galaxies: active, Galaxies: nuclei, Quasars: general.1 Introduction
In the framework of the radio–loud AGN unification scheme, Fanaroff & Riley I and II (FR I and FR II) radio sources (Fanaroff & Riley fanaroffriley (1974)) are believed to be the parent population of BL Lacs and QSO, respectively (see Urry & Padovani urry (1995) for a review). In this scenario, the differences between the observed emission properties are ascribed to a different orientation of the anisotropic central emission. There are two main reasons for anisotropy: the presence of non–thermal emission from a relativistic jet, which dominates the radiation observed in BL Lacs and Flat Spectrum Radio Quasars, and the presence of an obscuring “torus”, which prevents us to observe directly the central parsecs in objects observed along lines–of–sight perpendicular to the jet axis.
Optical studies of radio galaxies are particularly important not only to investigate their large–scale properties, such as the structure of the host and the environment (see e.g. Zirbel zirbel96 (1996), zirbel97 (1997)), but also to explore the physical conditions of the central regions. The high resolution and sensitivity provided by HST optical images allow us to separate the AGN emission from the stellar host galaxy background even in the case of low power radio galaxies (FR I).
Chiaberge et al. (pap1 (1999)) (hereafter, Paper I) and Chiaberge et al. (pap2 (2002)) (hereafter, Paper II) have studied complete samples of FR I and FR II radio galaxies with using HST images taken as part of the 3CR snapshot surveys (e.g. Martel et al. martel99 (1999); De Koff et al. dekoff96 (1996)). They analyzed the properties of unresolved nuclei which have been found to be present in the great majority of the objects. The optical nuclei of FR I correlate linearly with the radio nuclear emission over four orders of magnitude, both in flux and luminosity. In analogy with the origin of the radio cores, the CCC (central compact core) emission has been interpreted as non–thermal synchrotron radiation from the base of the relativistic jet. Furthermore, the high detection rate (85%) suggests that we have a direct view of the central regions in most objects, and that a geometrically and optically thick obscuring torus is generally not present in FR I objects. Thus, FR I intrinsically lack strong broad emission lines.
FR II with redshift show a more complex behavior, although their properties are clearly related to their optical spectral classification. Objects with broad emission lines (broad–line radio galaxies and quasars) have bright nuclei which show an optical excess with respect to the FR I correlation, probably because of the dominance of thermal emission from the accretion disk in the optical band. Sources in which only narrow lines are present are distinguished into high and low excitation galaxies (HEG and LEG - Laing et al. laing94 (1994)). Approximately 50% of the HEG do not show any nuclear optical component and they are interpreted as obscured sources, as expected in the framework of the unification scheme. On the other hand, the nuclei of HEG, when present, do lie on the correlation (or slightly above it). This behavior is unexpected, and their nature is intriguing. However, by including the nuclear Equivalent Width of the [OIII] emission line as a further parameter in the diagnostic diagrams, we can discriminate between nuclei observed directly and those that are obscured and seen only through scattered emission (Paper II).
LEG seem to behave differently from other radio galaxies with FR II morphology. A significant fraction of them have faint optical nuclei similar to those of FR I and they lie on the radio–optical correlation. Their nuclear physical properties are probably more similar to those of FR I, and this appears to be in contrast with the “standard” zeroth–order unification model. These sources might be associated with those BL Lacs that show radio morphologies and total radio power more typical of FR II sources, thus providing support for a revised unification scenario (Laing et al. laing94 (1994), Jackson & Wall jacksonwall (1999), Hardcastle et al. hard04 (2004)).
The limitation so far has been that the results described above hold for low redshift sources. The aim of this paper is to extend the previous studies to a sample of higher redshift FR II, in the range . This is particularly important for two reasons: i) the radio–loud AGN unification scheme was originally proposed by Barthel et al. (barthel89 (1989)) using a sample of high redshift () 3CR objects; ii) cosmological evolution may play a role in changing the structure of radio galaxies and quasar. Therefore, the conclusions drawn for the low redshift sample may not apply to high redshift objects, and the discrepancies with the unification scheme found in the analysis of nearby samples may be explained in terms of cosmological evolution. Instead, if the same behavior is still observed as redshift increases, the unification scheme needs to be revised.
The paper is organized as follows: in Section 2 we describe our sample of FR II and in Section 3 the HST observations; in Section 4 we present the results of the photometry of the nuclei; in Section 5 we discuss our results and consider their implications for the unification models. In Section 6, we summarize the main results and draw conclusions and future perspectives. and are used hereafter.
2 The sample
| Source | Redshift | (5GHz) | (178MHz) | Spectral | |
|---|---|---|---|---|---|
| name | W | class. | |||
| 3C~16 | HEG | ||||
| 3C~19 | LEG | ||||
| 3C~46 | HEG | ||||
| 3C~47 | QSO | ||||
| 3C~99 | HEGb | ||||
| 3C~147 | QSO | ||||
| 3C~154 | QSOb | ||||
| 3C~172 | HEG | ||||
| 3C~200 | LEG | ||||
| 3C~215 | QSO | ||||
| 3C~225.0B | HEG? | ||||
| 3C~228 | HEG | ||||
| 3C~244.1 | HEG | ||||
| 3C~274.1 | HEG(LEG∗) | ||||
| 3C~275 | LEGa | ||||
| 3C~275.1 | QSO | ||||
| 3C~295 | LEG | ||||
| 3C~306.1 | HEGa | ||||
| 3C~313 | HEGa | ||||
| 3C~327.1 | HEGa | ||||
| 3C~330 | HEG | ||||
| 3C~334 | QSO | ||||
| 3C~341 | HEG | ||||
| 3C~345 | QSOa | ||||
| 3C~411 | HEGa | ||||
| 3C~427.1 | LEG | ||||
| 3C~435A | Unclass | ||||
| 3C~455 | WQ |
∗ 3C~274.1 is classified by Willott as a HEG, but Jackson & Rawlings classify it as a doubtful LEG. See discussion in Sect. 5.1.
The sample considered in this paper comprises all radio galaxies belonging to the 3CR catalog (Spinrad et al. spinrad (1985)) with redshift in the range , morphologically classified as FR II.
We checked the morphological classification, optical identification, and redshift of all sources, by searching the literature for the most recent data. We exclude 3C~119 from our sample since its redshift is (Eracleous & Halpern eracle94 (1994)) instead of , as originally reported in the 3CR catalog. The final list is thus a complete, flux and redshift limited sample of 28 FR II radio sources (Table 1). Note that, to the best of our knowledge, for 3C~306.1 and 3C~275 no information on the radio core is available .
We classify our sources on the basis of their emission line properties, adopting the scheme defined by Jackson and Rawlings (jacksonrawlings (1997)). Weak Quasars (WQ) and quasars (QSO) are objects for which at least one broad line has been observed. These two classes differ only in optical continuum luminosity: W Hz-1 for QSO, while WQ are fainter. Thus, in the following, we refer to them as a single population of broad lined objects (BLO). High and low excitation galaxies (HEG and LEG) are narrow–lined sources, and are distinguished on the basis of their [OII]/[OIII] ratio ( for a LEG) and/or [OIII] equivalent width (less than Å for a LEG).
In Table 1 we report radio and optical data for the complete sample as taken from the literature .
| Source Name | Filter | (s) | GO program ID |
|---|---|---|---|
| 3C~16 | F702W | ||
| 3C~19 | F785LP | ||
| 3C~46 | F702W | ||
| 3C~47 | F702W | ||
| 3c~99 | F702W | ||
| 3C~147 | F702W | ||
| 3C~154 | F702W | ||
| 3C~172 | F702W | ||
| 3C~200 | F702W | ||
| 3C~215 | F702W | ||
| 3C~225.0B | F702W | ||
| 3C~228 | F702W | ||
| 3C~244.1 | F702W | ||
| 3C~274.1 | F785LP | ||
| 3C~275 | F702W | ||
| 3C~275.1 | F675W | ||
| 3C~295 | F702W | ||
| 3C~306.1 | F702W | ||
| 3C~313 | F702W | ||
| 3C~330 | F555W | ||
| 3C~334 | F702W | ||
| 3C~341 | F702W | ||
| 3C~345 | F555W | ||
| 3C~411 | F702W | ||
| 3C~427.1 | F702W | ||
| 3C~435A | F702W | ||
| 3C~455 | F702W |
3 HST observations
Optical HST observations are available in the public archive for all but one (namely 3C~327.1) of the sources of our sample . The HST images were taken using the Wide Field and Planetary Camera 2 (WFPC2). The projected pixel size of the Planetary Camera (PC) and the Wide Field cameras (WF) are arcsec and arcsec, respectively. The three WF cameras cover a “L” shaped field of view of , while the PC covers an area of .
Twenty–two sources were observed with the F702W filter as part of the HST snapshot survey of 3CR radio sources (GO 5476, Lehnert et al. lehnert99 (1999); De Koff et al. dekoff96 (1996)). 3C~295 was observed with the F702W filter as part of a different program (GO5378), while 3C~275.1 and 3C~345 were observed with the F675W and F555W, respectively. Deep observations with the F702W filter are also available for 3C~16 and 3C~435 from GO 6675. Further observations with the F785LP filter (taken as part of program GO 9045) are available for eleven radio galaxies of our sample. However, although the F785LP filter has a wide passband ( Å), and deep observations were obtained ( sec), the target is always located in the WF3 Camera. Therefore, since our goal is to check for the presence of unresolved nuclear components, we favor observations in which the target lies in the PC, which has a smaller projected pixel size, thus providing a better sampling of the PSF. Since 3C~327.1 has not been observed with HST, our final sample is composed by twenty–seven sources. In Table 2, we summarize the details of the HST observations.
The data have been processed through the standard OTFR system (On–The–Fly Reprocessing) pipeline for data processing and calibration (Baggett et al. bagg02 (2002)).
For twelve sources the observations are splitted into multiple exposures in order to remove cosmic ray events. We use the IRAF task CRREJ which combines the images and rejects cosmic rays through an iterative process. For fifteen out of the twenty–three sources observed with the F702W filter multiple exposures are not available. In these cases, we carefully check the central regions of the target to ensure us that the area of interest is not contaminated by cosmic rays. Cosmic rays are present in the nuclear regions of the F702W images of 3C~19, 3C~274.1 and 3C~330. Therefore, for such objects we use observations with different filters (see Table 2). For 3C~275, a cosmic ray affects the central region of the only HST image available, preventing us from any estimate of the nuclear emission.
4 Identification and photometry of Central Compact Cores
The identification of an unresolved nuclear component is not straightforward for sources in the redshift range considered here. Typically, the host galaxies’ diameter does not exceed pixels and a steep radial brightness profile might be confused with a nuclear compact component. Thus, a careful inspection of the galaxy’s profile is needed.
We use the IRAF RADPROF task on a region of 10 pixels from the galaxy center to derive its radial brightness profile. A steepening of the brightness profile occurring in the central pixels, which results in a FWHM comparable to that of an unresolved source ( arcsec) is indicative of the presence of a central compact core.
In twelve out of the twenty–seven sources ( of the sample) the FWHM of the central region is arcsec. In order to measure the flux of the CCC we perform aperture photometry. The highest source of error is the determination of the background: we set the galaxy background level at a distance of four or five pixels from the center of the galaxy, for the objects with and , respectively.
In seven galaxies we measure a FWHM of the central region larger than arcsec. For these objects we estimate an upper limit to the nuclear source by measuring the light excess in the central pixels with respect to the surrounding galaxy background. For sources in the redshift range we lower the central box size down to pixels.
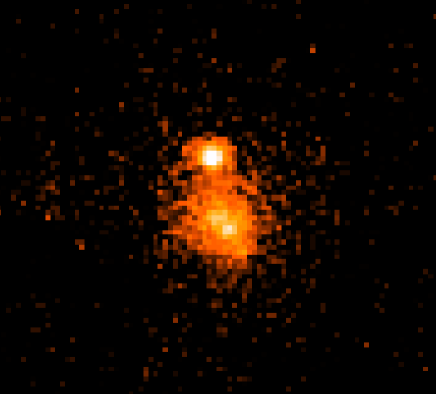
Four objects, namely 3C~16, 3C~46, 3C~99 and 3C~313, show a complex morphology which prevents us to detect any nuclear emission. Note that the optical counterpart of 3C~313 was previously identified on the HST image as a bright (quasar–like) point source (De Koff et al. dekoff96 (1996)). Its radio core is only marginally detected in a VLA observation at 5GHz (Baum et al. baum88 (1988)), but it is clearly seen at 8 GHz (Bogers et al. bogers94 (1994)). The position of the core, as estimated from the radio map, corresponds to a faint galaxy on the HST image, which is located close to the edge of the PC field (Fig. 1). This object, which we consider as the true host galaxy of 3C~313, is located arcsec away from the previous identification in the HST image by De Koff et al. (dekoff96 (1996)). Unfortunately, as reported above, the host galaxy of 3C~313 has a close companion and shows a complex nucleus, with possible dust lanes obscuring the central region.
A further problem in estimating the nuclear continuum is represented by contamination from emission lines, which may be significant especially in the case of BLO and HEG. In Paper II we have considered the contamination from broad H lines in BLO. We showed that, for the range of redshifts in which the line falls in the filter passband, the flux of the emission line represents only 10–20% of the nuclear flux. For the range of redshifts and for the filters considered in this paper, the emission lines that may contribute to the nuclear flux observed in the broad band filter images are mainly represented by the [OIII]5007 and H. For the HEG 3C~244.1 an HST image taken with a narrow band filter (FR680N), centered on the [OIII]5007 line, is available in the public archive. It is well known that a significant fraction of the emission line flux in radio galaxies is produced in extended (kpc–scale) regions of the host (e.g. Baum et al. baum88 (1988)). For 3C~244.1, we estimate that the [OIII] nuclear flux corresponds to of the total [OIII] flux derived from ground based observations (Jackson & Rawlings jacksonrawlings (1997)). We have measured the nuclear [OIII] flux from the narrow band image, and we find that its contribution to the total count–rate observed in the broad band image, results in of the nuclear flux. Although this appears to be a substantial contribution, it does not significantly affect our results. For two more HEG (namely 3C274.1 and 3C~341) the total [OIII] flux is available from the literature, but their nuclei are not detected in our HST images. If we assume that of the total [OIII] flux were produced in the nucleus, this would result in a count-rate higher than our detection threshold of erg cm-2 s-1 Hz-1, as set by the upper limits we estimate for these objects. This implies that most () of the [OIII] flux is produced in extended (kpc–scale) regions of the galaxy, and thus our estimates for the nuclear continuum are suitable for the purpose of the work presented here. However, note that even in case the three CCC of the HEG were entirely line emission, our results are not substantially affected by substituting detections with upper limits, since their representative points in the diagnostic diagrams would point to the regions were we expect the HEG to be located.
The results of our search for CCC is summarized in Table 3 and Table 4.
| Source | (7000 ) | Source | (7000 ) |
| name | name | ||
| 3C~16 | Complex | 3C~275 | CR |
| 3C~19 | 3C~275.1 | ||
| 3C~46 | Complex | 3C~295 | |
| 3C~47 | 3C~306.1 | ||
| 3C~99 | Complex | 3C~313 | Complex |
| 3C~147 | 3C~327.1 | not obs. | |
| 3C~154 | 3C~330 | ||
| 3C~172 | 3C~334 | ||
| 3C~200 | 3C~341 | ||
| 3C~215 | 3C~345 | ||
| 3C~225.0B | 3C~411 | ||
| 3C~228 | 3C~427.1 | ||
| 3C~244.1 | 3C~435A | ||
| 3C~274.1 | 3C~455 |
5 Results and discussion
In order to study the nature of the nuclei we take advantage of the results obtained for the lower redshift samples () in Papers I and II. In Figure 2 we plot our sources in the plane defined by the CCC luminosity vs the radio core luminosity and compare their behavior to that of the nearby 3C galaxies. Note that, due to the small redshift range of our sample, the distributions in either flux or luminosity do not significantly differ.
The position of our sources on the luminosity plot with respect to the FRI correlation is related to their optical spectral classification (Fig. 3). Their behavior is similar to that of low redshift FR II sources, but shifted toward higher luminosities.
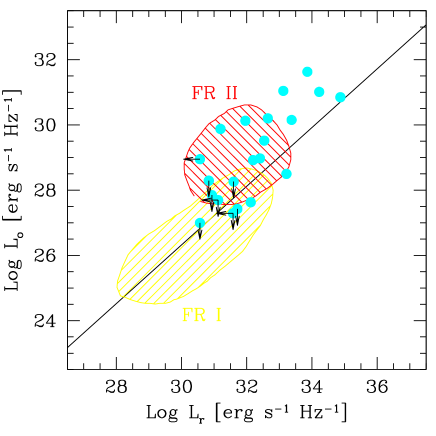
Broad Lined Objects are the brightest, both in the optical and radio band. They typically show an optical excess of 1–2 dex with respect to the FR I correlation. As discussed in Paper II, this optical excess can be explained if the optical emission is dominated by thermal radiation from the accretion disk. However, one source (3C~345) lies on the radio–optical correlation. This is not surprising, since 3C~345 is a Flat Spectrum Radio Quasar and both its radio and optical nuclear emission are dominated by non–thermal synchrotron radiation (Moore & Stockman moorestock (1981)). Note that the apparent correlation between and for BLO is not real and only due to the common dependence on redshift of the two quantities. In fact, we find that no correlation is present when considering fluxes instead of luminosities.
The nuclei of the LEG lie very close to the FR I correlation. Although we only have three sources (one CCC and two upper limits), their behavior is similar to that of low–z LEG.
The HEG show a more complex behavior. Six out of seven lie very close to the FR I regression line (within ). Instead, the location of 3C~244.1 is puzzling. Its representative point lies more than 2 dex out of the correlation. Its optical core is clearly identified in the HST image but only an upper limit to the radio core flux is available. We will discuss in detail the nature of this object in the following section.
As shown in Paper II, the position of HEG nuclei on the radio–optical plane can be misleading. A significant fraction of low redshift HEG lie on the FR I correlation “by chance” and the nature of their optical emission can be assessed only when a further parameter is included, i.e. the equivalent width of the [OIII] emission line. Therefore, before drawing conclusions on the nature of high redshift FR II nuclei, we discuss the properties of our sources as far as their emission lines are concerned.

5.1 Equivalent width of the [OIII] emission line vs. the radio–to–optical flux ratio
In Figure 4 we plot the ratio between the [OIII] emission line flux and the optical continuum (which represents the “nuclear” Equivalent Width of [OIII]) vs the optical–to–radio core ratio. The position of the sources along the Y axis indicates whether the nucleus is observed directly or it is obscured to our line–of–sight and visible only through scattered light. In fact, in the scenario in which the narrow line region is photo–ionized by UV radiation produced in the central accretion disk, the strength of the emission lines (in particular those of high ionization levels) is closely correlated with the intensity of the nuclear source. If we have a clear view of the central regions of the galaxy, a low EW of the [OIII] emission line is expected. Conversely, a high EW ( EW) is measured if the nuclear (ionizing) component is obscured to our line of sight, and only a small fraction of it is seen through scattered light (see Paper II for an extensive discussion).
The location of the representative points along the X axis reflects the distribution observed in the plane formed by the optical vs radio core emission. The shaded region represents the correlation between these two quantities found for FR I radio sources ( dispersion). Objects lying on the right side of this region have an optical excess with respect to the correlation. In the nearby sample, BLO are found in the lower right region of the plane, while the HEG typically show high EW and are interpreted as obscured BLO. Low–z LEG, all of which lie among the FR I in all diagnostic planes, are interpreted as “FRI–like” nuclei and they do not show evidence for substantial obscuration.
Unfortunately, to the best of our knowledge, only eleven sources of our sample have optical spectral information in the literature. Three of them are HEG, one is a LEG and seven are BLO.
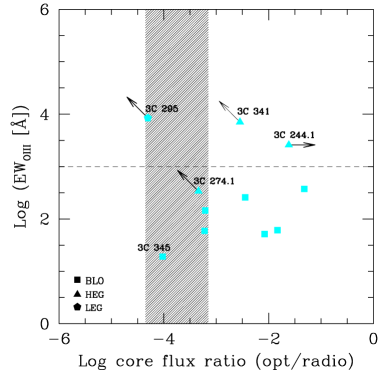
All of the BLO lie in the lower–right region of the plane in Figure 4 and have . This is a signature that we are directly observing the source of ionization. Note that, as already mentioned above, 3C~345 is an outlier because of the dominance of non–thermal emission in the optical band. In the plane of Figure 4, this has two effects: i)it drives the object toward the FR I “synchrotron” correlation and ii)it lowers the equivalent width of [OIII], as the emission lines are diluted by the strong non–thermal continuum.
Two out of the three HEG (namely 3C~341 and 3C~244.1) have a high EW[OIII], thus they are similar to the vast majority of low redshift HEG, which lie in the top (left) part of the diagram. 3C~244.1 not only shows an optical excess, as already pointed out in the previous section, but it also has a high value of EW[OIII]. Although the non–detection for its radio core is puzzling, its behavior appears to be similar to that of 3C~184.1 at (Paper II). Thus we argue that the location of 3C~244.1 in the diagnostic planes can be explained if this object has an unusually high intrinsic optical–to–radio core flux ratio and its “quasar” nucleus is moderately absorbed, so that its optical broad emission lines are not detected. Alternatively, this object may be a “normal” HEG with a scattered nuclear continuum (but still with a rather unusual optical–to–radio core flux ratio). To test these hypothesis, both deeper radio data and better spectral information are needed: to confirm the former hypothesis we should search for faint broad emission lines in direct light, while for the latter we expect broad emission lines (and nuclear continuum) to be strongly scattered and thus polarized.
3C~274.1 lies among the “unobscured” sources, where LEG are usually found. However, the non detection of the optical core only sets a limit to its location on this plane. Its [OIII] luminosity () is typical of LEG and significantly smaller than any other HEG in our sample (). Therefore, we argue that this source is actually a LEG, as already tentatively proposed by Jackson and Rawlings (jacksonrawlings (1997)).
The only LEG with [OIII] information, 3C~295, lies among the obscured sources, well out of the region occupied by low redshift LEG. As already pointed out above, low redshift LEG are usually found within the FR I region, i.e. on the radio-optical correlation and with low EW [OIII].
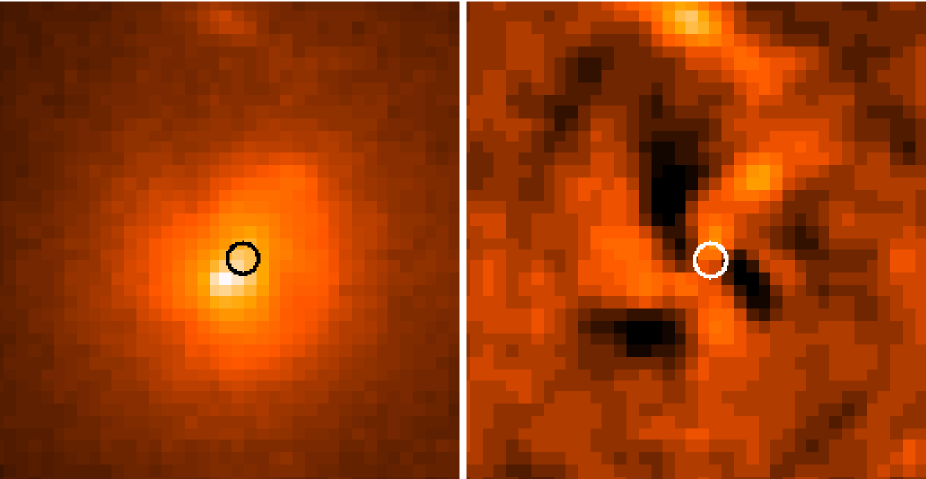
The [OIII] luminosity of 3C~295 () is significantly higher than the average of all of the 3C LEG, and it is similar to that of HEG. This could imply that the source has been misclassified. On the other hand, the optical image (Fig. 5, left panel) reveals that the host galaxy has a complex morphology and presents signs of interaction. In order to test if the lack of nuclear source is due to the presence of dust that covers the nuclear regions, we perform isophotal fitting of the galaxy and we subtract the resulting model from the image. This procedure highlights possible dishomogeneities in the galaxy structure (Fig. 5, right panel). The resulting image confirms that the morphology of the galaxy is complex. There is evidence for absorbing structures, possibly a dust lane, that might lower the emission from the nucleus. Furthermore, the center of the galaxy lies at a distance of arcsec from the peak of its surface brightness profile (the “nucleus” for our estimate of the optical upper limit). We conclude that because of the complexity of the central region of the galaxy, the upper limit measured on the HST image is probably unreliable, and the EW([OIII]) is in turn overestimated. An mag is sufficient to hide the central source. In light of the present data, we cannot discriminate between the two scenarios proposed, i.e. a misclassification of the source (which would be a HEG) or the presence of a moderate amount of absorption produced by large–scale dust lanes that prevents us to detect the optical nucleus.
Summarizing, the behavior of the high redshift BLO is completely in agreement with that of their low redshift counterparts. The lack of complete spectral information for both the LEG and HEG in the high-z sample prevents us from drawing any firm conclusion about these sources. However, we have shown that it is plausible that the scenario proposed for nearby objects still fits the behavior of the distant sample: LEG have FR I-like nuclei and HEG are absorbed QSO.
| CCC detections | Optical Upper Limits | Complex Morphology | TOT | % CCC detections | |
|---|---|---|---|---|---|
| BLO | |||||
| LEG | |||||
| HEG | |||||
| All sources |
.
5.2 Implications for the Unified Models
Let us now compare our findings with the behavior of lower redshift FR II radio sources in the framework of the unification models for quasars and narrow-lined radio galaxies (Barthel et al. barthel89 (1989)).
In the range , 28% of the sources are BLO, 50% are HEG and 18% are LEG (only one object is unclassified). Compared to the low redshift sample of Paper II (65 objects, of which 20% are BLO, 46% are HEG, 25% are LEG and 9% are unclassified) the fraction of BLO increases with redshift while the fraction of LEG decreases. On the other hand, the fraction of HEG appears to be fairly constant. If we translate this result into an estimate for the “opening angle” of the obscuring torus, using (where P is the fraction of objects with broad lines), for a randomly oriented sample of sources we obtain for , while for we have .
However, according to the new picture presented here, in Paper II, and in agreement with the previous findings of Laing et al. (laing94 (1994)), it is plausible that LEG constitute a separate sample, and they are not to be included in the statistics of the unification scheme for FR II and quasars. In this case, we obtain for and or for , considering all the unclassified objects as HEG or LEG, respectively.
Barthel et al. (barthel89 (1989)) found as the dividing angle between QSO and radio galaxies for the sample of 3CR sources with . However, if we re-classify the sources in the light of their nuclear properties and considering the most recent spectral information111http://www-astro.physics.ox.ac.uk/ cjw/3crr/3crr.html, we obtain that in the Barthel sample 44% of the objects are BLO, 53% are HEG and only 2% (corresponding to 1 source) are LEG. This corresponds to a torus opening angle of . Therefore, regardless of the shape of the obscuring structure, this is a clear indication for a decreasing covering factor with increasing redshift.
Willott et al. (willott00 (2000)) have found that the quasar fraction (and thus the torus opening angle) in low frequency selected samples of radio sources increases as luminosity and redshift increase. They proposed that the statistical properties of their samples could be explained by the receding torus model (Lawrence lawrence91 (1991)). In this scenario, the internal radius of the obscuring dusty torus increases as the luminosity of the central AGN increases, since dust sublimates at a fixed temperature (K). As an alternative, they pointed out that the rising of a population of low-z FR I-like “starved quasars” can also account for their findings.
By classifying the objects according to their nuclear properties, and thus considering the LEG as a separate population, we still find that the opening angle increases with redshift. Therefore, having excluded the majority of the FR I-like population, we favor the receding torus model as the most plausible scenario to account statistics of FR II and quasars.
| BLO | |||
|---|---|---|---|
| HEG | |||
| LEG | |||
| Unclass. |
6 Conclusions
We have analyzed the optical emission from the nuclei of 26 FR II radio sources within the redshift range . Our results are consistent with the behavior observed in lower redshift objects. Although in this range of redshifts the identification of CCC is not straightforward, 50% of the sources show an unresolved nuclear component.
The behavior of the sources on the plane formed by the optical core luminosity plotted vs. the radio core luminosity is related to their optical spectral classification. Objects with broad lines show an optical excess with respect to the correlation found for FR I objects. This excess is most plausibly due to thermal emission from the accretion disk.
Only one LEG of our sample show a CCC, which lies on the FR I correlation. The upper limits for the other two LEG are also compatible with the correlation. This is essentially the same behavior as observed in low-z objects.
The two HEG which have a CCC, as well as the five optical upper limits, are consistent with the FR I correlation (within 2). As in the case for low-z objects, the nature of their nuclei is classified by the inclusion of a further parameter, i.e. the luminosity of the [OIII] emission line. The location of the nuclei in the plane formed by the equivalent width of the [OIII] emission line plotted vs. the optical-to-radio core flux ratio indicates whether we are directly observing the nuclear ionizing continuum or the source of ionization is absorbed to our line-of-sight.
BLO are found in the same region as their low-z counterparts, therefore we interpret them as unabsorbed nuclei. The HEG lie in the upper part of the plane, indicating that we are observing only a fraction of their ionizing continuum source. 3C~244.1 has both high EW([OIII]) and optical excess, therefore we propose that this source is a moderately absorbed BLO or, alternatively, a HEG with a scattered nucleus and with a rather unusual optical-to-radio core flux ratio. Future deep spectroscopic observations can test this hypothesis.
In the FR II–QSO unification scenario the number ratio of BLO to narrow-lined objects has been used to statistically estimate the opening angle of the obscuring torus. In the light of our optical studies and considering the most recent spectral information we confirm the evidence that the opening angle increases with redshift. The most plausible explanation is provided by the receding torus model (e.g. Lawrence lawrence91 (1991)).
Acknowledgements.
The authors thank William B. Sparks and Gabriele Giovannini for useful discussions. This research has made use of the NASA/IPAC Extragalactic Database (NED) which is operated by the Jet Propulsion Laboratory, California Institute of Technology, Under contract with the National Aeronautics and Space Administration. This work has been partially supported by the Summer Student Program (SSP) at the Space Telescope Science Institute and by contract n.() at the Institute of Radioastronomy.References
- (1) Baggett S., et al. 2002, in HST WFPC2 Data Handbook, v. 4.0, ed. B. Mobasher, Baltimore, STScI
- (2) Barthel P.D., 1989, ApJ, 336, 606
- (3) Baum S.A., Heckman T.M., Bridle A. et al. 1988, ApJS, 68, 643
- (4) Bogers W.J., Hes R., Barthel P.D., Zensus J.A., 1994, A&AS, 105, 91
- (5) Chiaberge M., Capetti A., Celotti A., 1999, A&A, 349, 77
- (6) Chiaberge M., Capetti A., Celotti A., 2000, A&A, 355, 873
- (7) Chiaberge M., Capetti A., Celotti A., 2002, A&A, 394, 791
- (8) De Koff S., Baum S.A., Sparks W.B. et al. 1996, 107, 621
- (9) Eracleous M. & Halpern J.P., 1994, ApJ, 433, L17
- (10) Fanaroff, B.L., Riley, J.M.,1974, MNRAS, 167, 31
- (11) Hardcastle, M. J. 2004, A&A, 414, 927
- (12) Jackson C.A., Wall, J.V., 1999, MNRAS, 304, 160
- (13) Jackson N. & Rawlings S., 1997, MNRAS, 286, 241
- (14) Jackson N. & Browne I.W.A., 1991, MNRAS, 250, 414
- (15) Laing R.A., Jenkins C.R., Wall J.V., Unger S.W., The First Stromlo Symposium: The Physics of Active Galaxies. ASP Conference Series, Vol. 54, 1994, G.V. Bicknell, M.A. Dopita, and P.J. Quinn, Eds., p.201
- (16) Lawrence A., 1991, MNRAS, 252, 586
- (17) Lehnert M.D., Miley G.K., Sparks W.B. et al. 1999, ApJS, 123, 351
- (18) Martel A.R., Baum S.A., Sparks W.B. et al. 1999, ApJS, 122, 81
- (19) Moore R.L., Stockman H.S., 1981, ApJ, 243, 60
- (20) Spinrad H., Marr J., Aguilar L., Djorgovski S. 1985, PASP, 97, 932
- (21) Tadhunter C.N., Morganti R., di Serego Alighieri S., Fosbury R.A.E., Danziger I.J., 1993, MNRAS, 263, 999
- (22) Urry C.M., Padovani P., 1995, PASP, 107, 803
- (23) Willott C.J., Rawlings S., Blundell K.M., Lacy M., 2000, MNRAS, 316, 449
- (24) Zirbel E.L., 1996, ApJ, 473, 713
- (25) Zirbel E.L., 1997, ApJ, 476, 489