Why are X-ray sources in the M31 Bulge so close to Planetary Nebulae?
Abstract
We compare a deep (37 ks) Chandra ACIS-S image of the M31 bulge to deep [O III] Local Group Survey data of the same region. Through precision image alignment using globular cluster X-ray sources, we are able to improve constraints on possible optical/X-ray associations suggested by previous surveys. Our image registration allows us to rule out several emission-line objects, previously suggested to be the optical counterparts of X-ray sources, as true counterparts. At the same time, we find six X-ray sources peculiarly close to strong [O III] emission-line sources, classified as PNe by previous optical surveys. Our study shows that, while the X-rays are not coming from the same gas as the optical line emission, the chances of these six X-ray sources lying so close to cataloged PNe is only 1%, suggesting that there is some connection between these [O III] emitters (possibly PNe) and the X-ray sources. We discuss the possibility that these nebulae are misidentified supernova remnants, and we rule out the possibility that the X-ray sources are ejected X-ray binaries. There is a possibility that some cases involve a PN and an LMXB that occupy the same undetected star cluster. Beyond this unconfirmed possibility, and the statistically unlikely one that the associations are spatial coincidences, we are unable to explain these [O III]/X-ray associations.
1 Introduction
The high-spatial resolution of the Chandra X-ray Observatory is allowing optical counterparts to be found for a large number of individual extragalactic X-ray sources. Such a capability provides the first opportunity to find new examples of exotic sources for which there are only a handful of Galactic examples. Because of its proximity, low extinction, and high mass, M31 is an excellent place to search for such objects, and associations between X-ray sources and optical line-emitting sources provide interesting places to start.
Early optical emission-line surveys of M31 (e.g. Rubin et al., 1972) and X-ray surveys of M31 (e.g. van Speybroeck et al., 1979) produced a limited number of reliable counterpart candidates due to resolution and sensitivity issues. More recently, many digital surveys have discovered hundreds emission-line sources, including several hundred compact [O III] sources in the M31 bulge, believed to be planetary nebulae (PNe) (Ford & Jacoby, 1978; Ciardullo et al., 1989).
At the same time, X-ray spatial resolution has improved dramatically, with Chandra providing source locations to a few tenths of an arcsec. Because the emission-line sources in the M31 bulge are well separated, even in ground-based images, comparisons of high-resolution X-ray positions with optical emission-line images of the M31 bulge reveal interesting counterparts. Typically these sources of strong X-ray emission and optical line emission are found to be supernova remnants (SNRs) (Kong et al., 2002a; Kong et al., 2003; Williams et al., 2004), like the X-ray bright SNRs in our Galaxy.
Several recent surveys of M31 with Chandra (Kong et al., 2002b; Williams et al., 2003) have revealed possible X-ray counterparts to optical emission-line sources classified as PNe by their appearance as point sources in [O III] images. Such counterparts are difficult to understand because PNe are among the weakest X-ray sources in the Galaxy. None of the Uhuru or HEAO A-1 X-ray sources was ever optically identified as a PN. In fact, only in recent years has it been possible to study Galactic PNe using ROSAT and Chandra. Guerrero et al. (2000) detected a total of 13 PNe with ROSAT; all are faint and have very soft spectra. Chandra observations have provided more detailed information: NGC 6543 and NGC 7293 have peak temperatures (MEKAL model) of 0.5 keV and 1.0 keV, and X-ray luminosities of erg s-1 and 3 erg s-1, respectively (Guerrero et al., 2001). The most luminous planetary we are aware of is NGC 7027 with erg s-1; its temperature is keV (Kastner et al., 2001).
Another possibility is that these PNe are not counterparts at all, but instead are separated by a few arcsec, close enough to be confused with counterparts at the accuracy limit of simple catalog cross-correlation. To check this possibility, it is necessary to have images of the PNe sources to register and compare to the X-ray data. Recently, the Local Group Survey (LGS) team (Massey et al., 2001) has released their deep, wide-field emission-line images of M31. These images contain X-ray emitting globular clusters (GCs) as well as previously-cataloged PNe. These GCs allow precise registration of the [O III] and Chandra images, reducing the X-ray error regions to a few tenths of an arcsecond.
In this paper, we compare a deep Chandra ACIS-S image with the LGS [O III] image of the M31 bulge in order to tightly constrain the association between several of the X-ray sources of the M31 bulge and bright, compact [O III] emitting regions classified as PNe. Section 2 describes the data and analysis techniques used. Section 3 discusses the comparison of the X-ray positions and the optical emission-line sources. Section 4 discusses possible explanations for the associations, and section 5 provides a summary of our conclusions.
2 Data
2.1 Data Processing
We obtained the [O III], [S II], H, and -band images of the M31 bulge from field 5 from the Local Group Survey (LGS111http://www.lowell.edu/massey/lgsurvey). These images have already been properly flat-fielded and the geometric distortions removed so that the coordinates in the images are good to 0.25′′ on the FK5 system, and the images through different filters are registered with one another. We therefore were easily able to subtract the -band continuum from the [O III] image in order to make the [O III] sources stand out. The central 40′′ are saturated in the continuum image, rendering that section of the data useless for our purposes. Fortunately only 2 of the PNe counterpart candidates lie in this region. The [S II] and H images were used only to test the flux ratios as a diagnostic for photo-ionization of the X-ray PNe.
We performed a rough calibration of the LGS [O III] image by matching the [O III] fluxes of 10 planetary nebulae (PNe) with published [O III] fluxes Ciardullo et al. (1989). This calibration provided a conversion factor of 5.5 erg cm-2 ct-1. We also roughly calibrated the H and [S II] images by matching the fluxes of the SNR DDB 1-15 (D’Odorico et al., 1980) to the fluxes measured in the calibrated data set of Williams et al. (1995) (H ; [S II] = 5.5 ). This calibration yielded conversion factors of 1.0 erg cm-2 ct-1 and 1.8 erg cm-2 ct-1 in H and [S II] respectively. Using these [O III], H, and [S II] factors, we converted the LGS count rates to units of .
We also obtained a deep Chandra ACIS-S image centered on the M31 nucleus. This image had an exposure time of 37.7 ks. We created exposure maps for this image using the CIAO script mergeall, and we found and measured positions for the sources in the image using the CIAO task wavdetect. We detected 153 sources, 137 of which were located in regions outside of the saturated portion of the LGS images. The source list reached a flux limit of 2.5 10-7 ct cm-2 s-1 (0.3–10 keV), or 8 assuming an absorbed power-law spectrum with slope 1.7 and cm2, or a (unabsorbed) luminosity limit of 7 in M31, assuming a distance of 780 kpc (Williams, 2003).
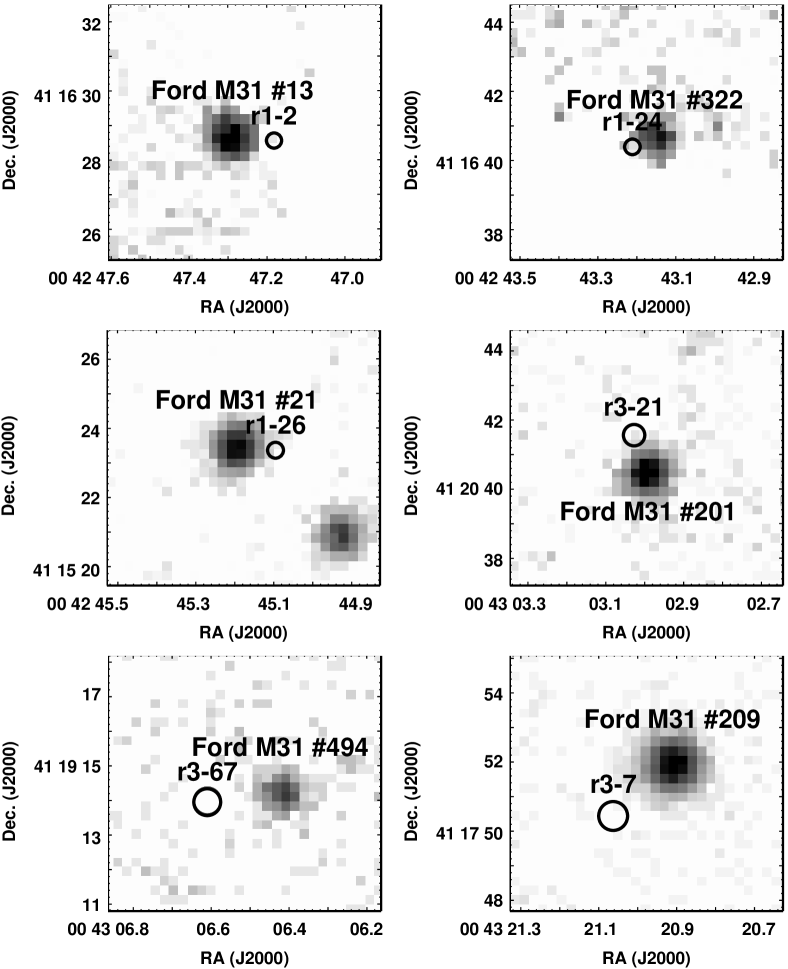
The X-ray image contained all but one of the previously mentioned PNe counterpart candidates (Kong et al., 2002b; Williams et al., 2003), which are all labeled and marked with their X-ray position error circles in Figure 2. The one counterpart candidate not detected (r1-23, Williams et al., 2003) is an X-ray transient candidate (Kong et al., 2002b). This source is in the saturated central region of the LGS data; even if it had been detected in the ACIS-S data, its position relative to the PNe could not have been further constrained by this study.
2.2 Image Alignment
We aligned the coordinate system of the ACIS-S image with the LGS coordinate system by translating and adjusting the plate scale of the ACIS-S coordinate system so that 13 globular cluster sources had the same coordinates as the centroids of the respective globular clusters in the LGS -band image. This transformation, performed using the IRAF222IRAF is distributed by the National Optical Astronomy Observatory, which is operated by the Association of Universities for Research in Astronomy, Inc., under cooperative agreement with the National Science Foundation. task ccmap, had root-mean-square residuals of 0.16′′ in RA and 0.15′′ in DEC. These errors were added in quadrature to the position errors of the sources, determined by wavdetect, to calculate the final position errors for X-ray sources on the LGS [O III] image.
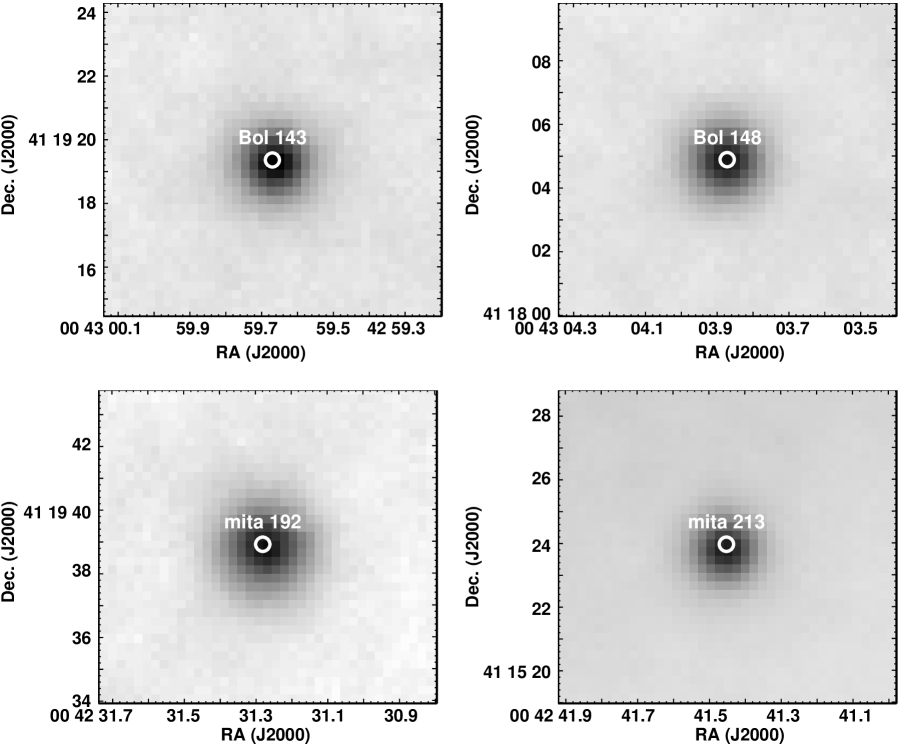
Figure 1 shows the error circles of four of the globular cluster X-ray sources used to align the X-ray and optical images plotted on the [O III] image. The quality of the alignment is within the position errors of the globular cluster sources. The globular cluster X-ray sources in the aligned images are within 1 of the centers of the optical globular clusters. On the other hand, the PN sources, shown in Figure 2, are clearly not within the calculated errors of the X-ray sources. These slight offsets between the X-ray sources and the [O III] nebulae show that the [O III] emission is not coming from the same source as the X-ray emission, but the proximity of the sources in so many cases is intriguing, as it suggests the sources are connected in some way.
2.3 X-ray Spectra
To further investigate the nature of these peculiar X-ray sources, we extracted their X-ray spectra from the ACIS-S observation using the CIAO task psextract. We binned the spectra so that they contained 10 counts per bin, allowing standard statistics. Source r1-2 contained sufficient counts to provide 20 counts per bin.
We then fit the background-subtracted spectra from 0.35–7 keV using the CIAO 3.0/Sherpa package (Freeman et al., 2001). We tried fits using Raymond-Smith (RS), blackbody, and power-law models, including absorption and a correction of the instrumental response for the well-known contamination build-up on the ACIS detectors. The results of the fits are listed in Table 1 and discussed below in §3.2.
3 Results
3.1 X-ray source locations
We visually searched the aligned [O III] image for nearby X-ray sources by placing 2.5′′ radius circles onto the [O III] image centered on the locations of all X-ray sources detected in the ACIS-S images. This search yielded 15 counterpart candidates, 6 of which have been cataloged as PNe. Figure 2 shows these 6 “PNe” sources within 2.5′′ of the X-ray source position. The 1 error circles for the X-ray positions are plotted on the images.
Five of the other 9 nearby [O III] sources are cataloged SNRs (r2-56, r2-57, r3-63, r3-69, and r3-84 (Kong et al., 2002a; Kong et al., 2003; Williams et al., 2004). The [O III] sources near CXOM31 J004229.1+412857 (Kaaret, 2002) and r3-87 (CXOM31 J004226.1+412552, Kong et al., 2002b) are uncatalogued. The [O III] source near CXOM31 J004220.5+412640 (Kaaret, 2002) is a known emission line source (WB92a 26, Walterbos & Braun, 1992) and radio source ([B90] 64, Braun, 1990). The source near r1-16 is a cataloged emission line object of unknown nature (Wirth et al., 1985).
While all of these [O III]/X-ray associations are of interest, the SNRs have been studied in detail in previous publications, and the other sources have yet to be classified. Herein we focus on the 6 X-ray sources within 2.5′′ of “PNe”. Of these objects, r3-67 is also within 2.5′′ of a known radio source ([B90] 122, Braun, 1990). The radio source is more closely aligned with the X-ray source (1.7′′) than the [O III] nebula (3.7′′).
In order to determine the number of random X-ray/optical associations that would be found by searching within 2.5′′ of detected X-ray sources, we shifted the positions of our X-ray sources by 15′′ and repeated the visual search for counterparts. This experiment was performed 4 times in 4 directions of position shifts. The mean number of random association found was 3, with an average number of cataloged PNe associations of 2. We therefore expect that 2 of our associations with PNe are chance superpositions; however, this number still suggests that 4 of the X-ray sources are somehow associated with PNe. According to Poisson statistics, there is only a 1.2% chance that all 6 of these associations are chance superpositions. 333A 2.5′′ search radius was chosen as the root-sum-square of the typical position errors in the Chandra and Ford catalogs. It should be noted that if we run the same test with a 1.5′′ search radius, we find 4 PNe associations and an average of 1 random association. These numbers leave a 1.5% chance that all 4 of the associations within 1.5′′ are chance superpositions, suggesting that the statistics are not strongly dependent on the exact search radius chosen.
For a more sophisticated determination of the likelihood of 6 false PN/X-ray associations, we performed monte carlo tests for chance associations as a function of the separation between the PN and X-ray source. Stepping from maximum separation angles of 1′′ to 3′′ in 0.1′′ increments, we searched for PN/X-ray associations by comparing the X-ray and PN catalogs after rotating them about the M31 nucleus with respect to one another by a random angle (20–340 degrees). Any associations found in the rotated catalogs could not be real; therefore these searches provided the number of expected false associations for each maximum separation angle tested.
We performed the monte carlo test using 2000 random rotation angles for each maximum separation angle. This number of trials provided a robust mean number of false associations, shown in Figure 3. In addition we monitored the percentage of tests that produced 4 or more false associations as well as the percentage that produced 6 or more false associations. These results are also shown in Figure 3.
Our monte carlo tests confirmed what we found with our searches by eye, finding a mean of 2.07 false associations within 2.5′′ separation and 0.73 false associations within 1.5′′ separation. The monte carlo results also support our use of Poisson statistics for estimating the likelihood of false associations, as 1.3% of tests find 6 false associations within 2.5′′ and 0.4% find 4 false associations within 1.5′′. Furthermore, as shown in Figure 3 we find 6 associations at a range of maximum separation angles (2.3′′–2.7′′). Over this range, the probability of finding 6 false associations changes rather steeply (see Figure 3), covering a range of 0.4%–3.25%. This probability range represents our most conservative measurement of the probability that all of these associations are false.
Finally, our precise image alignment provides position errors for the X-ray source locations on the LGS [O III] image of only a few tenths of an arcsec. These small position error circles are shown in Figure 2. All of our X-ray sources are slightly, but significantly, offset from the PNe positions. This offset is intriguing. It suggests that, while the X-ray emission is not likely to be coming from the PNe itself, the X-ray sources are likely somehow associated with the PNe.
3.2 X-ray properties
We analyzed the spectra of all six X-ray sources that lie within 2.5′′ of PNe. The spectral parameters for the absorbed power-law fits, including model type, model parameters with 1 errors, , and absorption-corrected 0.3-7 keV luminosities, are given in Table 1. In one case, r3-7, the best fit absorption fell below the known foreground absorption. We therefore accepted the best fit model with the absorption fixed at the foreground value of 61020 cm-2 (e.g. Kaaret, 2002; Trudolyubov et al., 2002).
In one case, an absorbed RS model provided a fit as good as the fit from an absorbed power-law. Source r3-21 is as well fit by an absorbed RS model with = 93 cm-2 and kT = 42 keV. Even in this case, the absorbed power-law model is as likely as the RS model to be the correct interpretation of the data. Therefore, Table 1 shows the power-law fit, as it does for the other 5 sources.
In the other 5 cases, an absorbed power-law model provided the only fits with . In three of these cases, the absorbed power-law fit was improved by the addition of a blackbody component to the spectrum. We applied an F-test to the values of the spectral fits with the addition of a blackbody component (e.g. Bevington & Robinson, 2003). The values for r1-26, r1-2, and r3-67 were 23.1, 15.6, and 21.1, respectively (the others had ). These values leave 1% probability that a blackbody component should not be included in the fits for r1-26 and r1-2, and 5% probability that the component should not be included in the fit to r3-67. The blackbody components comprise 68%, 24%, and 99% of the modeled unabsorbed luminosities (0.3–7 keV) of r1-26, r1-2, and r3-67, respectively.
The sources all show somewhat similar spectral properties. For example, all have power-law components with slopes consistent with 1.8–2.0, and all but r3-21 are consistent with cm-2. Even the absorption column of r3-21 is within 1.8 of this value.
The X-ray variability of these sources has been investigated in Kong et al. (2002b). Object r1-24, r1-2, and r3-7 were found to have varying intensity in X-rays. The other 3 sources have constant X-ray flux. These properties allow that these sources could be XRBs.
3.3 Optical properties
We estimated the narrow-band fluxes of these sources in the LGS images. These fluxes were measured in 2.5′′ diameter apertures centered on the position of the [O III] nebula as determined by the IRAF task imcentroid. The counts in each nebula in each band were measured using the IRAF task phot and then converted to flux units with the calibration discussed in §2. The resulting fluxes are provided in Table 2.
The [S II]/H ratio of line-emitting regions is a well-known diagnostic of shock heating, where ratios 0.4 are typical of shock heated regions, such as SNRs, and ratios 0.4 are typical of photo-ionized regions, such as H II regions or PNe (Levenson et al., 1995). Ford 322, Ford 21, Ford 13, and Ford 201 have [S II]/H ratios of 0.9, 1.4, 1.1, and 0.7 respectively, suggesting that these nebulae are shock-heated, and not photo-ionized. We are not able to determine the [S II]/H ratio for Ford 494 due to lack of a [S II] or H detection. Only for Ford 209 is the [S II]/H ratio consistent with a PNe hypothesis.
The [O III]/H ratios (see Table 2) were corrected for absorption because of the large difference in wavelength. We estimated the extinction using the relationship of Predehl & Schmitt (1995). We assumed a standard reddening law, and we assumed and . We compared our [O III] fluxes and [O III]/H ratios to the objects in common with Ciardullo et al. (2002). Our [O III] flux estimates for Ford 13 and Ford 21 are in agreement with their measurements, as is our estimate of the [O III]/H ratio for Ford 13.
On the other hand, our [O III]/H ratio estimate for Ford 21 is larger than theirs by a factor of 3. This suggests that our H flux estimate could be significantly low, causing the very high [S II]/H ratio (1.4). This discrepancy underscores the difficulty of measuring faint source fluxes in the high background of the M31 bulge. Ford 21 is the faintest PN we detect in H (1.1 10-15 erg s-1) in an area of very high background (background/source = 112). For comparison, Ford 209, the faintest PN in our sample in H (0.9 10-15 erg s-1), has a background/source flux ratio of 13. The high background of Ford 21 hinders the measurement of precise fluxes. We note that, although our flux ratio estimates are not precise enough to yield reliable source classifications, even if the H flux is truly a factor of 3 stronger than our estimate, the [S II]/H ratio is 0.5, still high for a PN.
[O III]/H ratios are not reliable for indicating shock-heating or photo-ionization, as photo-ionized regions cover a wide range of [O III] emission strengths (Ho et al., 1993; Veilleux & Osterbrock, 1987; McCall et al., 1985); however, it is interesting to note that four of the [O III]/H ratios (Ford 322, Ford 13, Ford 201 and Ford 209) are 5. These values are not out of the ordinary for interstellar shocks containing a variety of shock velocities 100 km s-1 (e.g. Vancura et al., 1992; Fesen et al., 1997; Mavromatakis et al., 2000). The other two nebulae have [O III]/H ratios 10, suggesting photo-ionization, very high shock velocities, or O-rich emission regions. If these sources are SNRs, they could be young with high shock velocities: a characteristic consistent with their small sizes.
While full optical spectra will be required to determine the true nature of these sources, the suggestion of shock heating from the narrow-band flux ratios provides further evidence that 4 or 5 of these 6 objects are not PNe.
4 Discussion
Because there is very little likelihood that these 6 X-ray sources lie so close to classified PNe by chance, we assume for the moment that at least some of these sources are somehow associated with the nearby [O III] nebulae. It should be noted that, even if the positions were coincident, there is no current model for, or example of, PNe that produces strong X-ray emission. There are also no models for X-ray binaries that produce strong [O III] emission. The unique Galactic X-ray source GX1+4 emits in [O III]; however, even this extreme example has [O III]/H (Chakrabarty & Roche, 1997).
If these are true X-ray/[O III] associations, what are they? The spectral indices and absorption indicated for the X-ray sources are typical of X-ray binaries. However, there are no PN formation models that would predict the presence of a nearby XRB. If these [O III] nebulae are SNRs, the XRBs may have been formed in the same supernova event, but we argue below that even this scenario is unlikely.
4.1 Are the [O III] Nebulae SNRs?
Before we address the nature of the X-ray sources, we attempt to understand the nature of the nearby [O III] nebulae. Their [S II]/H ratios and proximity to strong X-ray sources make these nebulae very strange indeed, as they are unresolved, strong [O III] sources in M31 that are likely shock-heated. In addition, any hypothetical X-ray sources coincident with the [O III] nebulae are not detected by Chandra, requiring that they are fainter than 1035 in X-rays (see §2.1).
There is a possibility, as several of the [S II]/H flux ratios suggest, that the [O III] nebulae are SNRs. If these [O III] nebulae are SNRs, they must be young. To be unresolved in the 1′′ seeing of the LGS images, these SNRs would need to be 4 pc across, smaller than the sizes of SN 1006 (7 pc, Willingale et al., 1996; 19 pc, Winkler et al., 2003) and 3C 58, thought to be the remnant of the supernova of 1181 C.E. (5 pc, van den Bergh, 1990). These comparisons limit the ages of the SNRs to 1000 yr.
The low X-ray luminosities (1035 ) do not rule out the possibility that these nebulae are SNRs, despite their implied ages. While the recent X-ray detections of several SNRs in M31 (Kong et al., 2003; Williams et al., 2004) show that some SNRs are located in regions of the ISM with densities 0.1 cm-3, Magnier et al. (1997) found that most SNRs in M31 are weak in X-rays, suggesting that the density of the ISM is lower in the vicinity of many M31 SNRs.
Furthermore, young SNRs of both Type Ia and Type II can be weak in X-rays. For example, SN 1006 and 3C 58 are thought to have been Type Ia (Winkler et al., 2003) and Type II (Panagia & Weiler, 1980) supernovae, respectively. SN 1006 has an X-ray luminosity (1–10 keV) of 5 (Winkler & Laird, 1976; Winkler et al., 2003), and 3C 58 has an X-ray luminosity (0.1–4 keV) of only 1034 (Helfand et al., 1995). Therefore neither of these young SNRs would have been detected by the Chandra surveys.
Finally, if the [O III] nebulae are SNRs, some of them must have old progenitors in order to explain their location in the M31 bulge. Three of these nebulae (Ford 13, 21, 322) lie within a 2 box centered on the nucleus, in the old stellar population of the M31 bulge. Although the M31 bulge is known to contain some molecular clouds (Melchior et al., 2000) and SNRs (Sjouwerman & Dickel, 2001; Kong et al., 2003; Williams et al., 2004), allowing the possibility of some recent star formation, it is not known to harbor a young stellar population (Deharveng et al., 1982; Stephens et al., 2003). If these [O III] nebulae are SNRs, their progenitor stars were likely old.
Because the M31 bulge does not contain a substantial number of young, high-mass stars, if these “PNe” are in fact SNRs, we must consider the possibility that some are SNRs from Type Ia supernovae. Such supernovae likely have old, white dwarf progenitors (e.g. Hoeflich et al., 1998). Type Ia supernovae do not arise from the core-collapse of a massive star; they do not produce stellar-mass, compact objects (i.e. XRBs). Even if these inner three [O III] nebulae are SNRs, the fact that the progenitor supernovae did not likely produce XRBs provides the first hint that these [O III]/X-ray associations cannot be SNR/XRB pairs.
4.2 Are the X-ray Sources Ejected XRBs?
Returning to the six strong Chandra X-ray sources displaced from the [O III] nebulae, we address the question of how these sources could be related to the neighboring nebulae. The X-ray sources certainly cannot be related to the nebulae if the nebulae are PNe, but if the nebulae are SNRs, the X-ray sources might be ejected X-ray binaries. To check this hypothesis, we assume that the supernovae were able to create XRBs, temporarily ignoring the possibility that, if the nebulae are SNRs, some of them had Type Ia progenitors.
The idea that these slightly misaligned sources are ejected binaries is not entirely radical. Such an association has been suggested in the Galaxy for the X-ray binary Cir X-1. While the initial suggestion of an association with the nearby SNR G321.9-0.3 has been ruled out (Mignani et al., 2002), there is a new suggestion that the radio synchrotron nebula which surrounds Cir X-1 is actually its birth SNR (Clarkson et al., 2004).
If these [O III] nebulae are SNRs, the comparisons of their sizes to SN 1006 and 3C 58 (see §4.1) limit the ages of the SNRs to 1000 yr. If these SNRs produced the nearby XRBs, and the XRBs are 2.8–8.7 pc away from the SNRs’ centers, these XRBs must be moving at least 2700–8500 km s-1. Such velocities would be higher than those observed for Galactic neutron stars, which typically range from 100–1000 km s-1 (Cordes & Chernoff, 1998).
Single neutron stars with very high velocities (3000 km s-1) may conceivably exist. Arzoumanian et al. (2002) suggest that 15% of neutron stars have velocities 1000 km s-1 and 10% of neutron stars younger than 20 kyr will lie outside of their birth SNR. In addition, selection effects in Galactic pulsar surveys could lead to an underestimate of the number of high-velocity neutron stars (Cordes & Chernoff, 1998). Although such claims favor the existence of high-velocity neutron stars, there is no evidence for neutron star velocities 3000 km s-1.
Moreover, it is difficult to imagine how a binary system could be born with a velocity of 3000 km s-1. Any pre-supernova binary would have an orbital velocity that is only a small fraction of 3000 km s-1, and the asymmetric kick received by the compact object during the supernova event would be so fierce that it would unbind the binary. We therefore conclude that, whether the [O III] nebulae are SNRs or not, it is unlikely that even one of these six X-ray sources could be a high-velocity X-ray binary ejected from a SNR.
4.3 Do the X-ray/PN Pairs Reside in Star Clusters?
There is an additional non-random way in which a PN and an X-ray source could be so close to one another. The PN and XRB could be in the same star cluster, putting them spatially near one another while being unrelated physically. In such a scenario, the progenitors of the XRB and PN must have been formed at the same time. The neutron star in the XRB would have then formed from its high-mass progenitor before the PN formed from its lower mass progenitor. Applying this possibility to the M31 associations requires that the star clusters themselves have gone undetected.
There are Galactic examples of LMXB/PN associations. We cross-correlated the Galactic PN catalog of Kohoutek (2001) with the Galactic LMXB catalog of Ritter & Kolb (2003). This cross-correlation revealed only two associations with separations less than 250′′ (at typical Galactic distances 250′′ corresponds to 2.5′′ at the distance of M31). Both of these associations involve a PN and an LMXB that lie in the same globular cluster. The PN PK 065-27 1 and the LMXB 4U 2129+12 are 30′′ apart in NGC 7078 (M 15). The PN JaFu 2 and the LMXB 4U 1746-37 are 30′′ apart in NGC 6441. There is a second PN inside the tidal radius of NGC 6441 (7′; Bahcall & Hausman, 1976); PN H 1-36 has a separation from 4U 1746-37 of 310′′. Monte carlo tests, in which we rotated the Galactic catalogs with respect to one another by random angles (0.1–5 degrees), show that in 1000 iterations there is 0.1% probability of 2 chance associations with separation less 100′′ and 5.5% probability of 2 chance associations with separation 250′′.
Apparently, PNe and LMXBs that are close to one another in the Galaxy occupy the same globular cluster. However, globular clusters like NGC 7078 and NGC 6441 are easily detected in ground based images of M31. For example, NGC 6441 would have if located in M31, and would be easily detected like other globular clusters within 1′ of the M31 nucleus with (e.g. ACH 6; Auriere et al., 1992). No such clusters are detected at the locations of any of the [O III]/X-ray associations.
Clearly if these M31 LMXB/PN associations are located in clusters of stars, they are not globular clusters. In recent years, the distinction between globular clusters and open clusters has been blurred. Studies of extragalactic star clusters are revealing that they may form according to a power-law mass function (e.g. the Antennae; Zhang & Fall, 1999). Each cluster then stays bound for a length of time determined by its mass, concentration, and orbital parameters (Fall & Zhang, 2001). The fact that the star clusters in the Galaxy happen to fall neatly into two categories (open and globular) is due to the cluster formation history of the Galaxy. Other galaxies have different cluster formation histories and are likely to contain some star clusters that do not fit into these two categories. Examples of different cluster types in local galaxies include the “blue globular” clusters in the Large Magellanic Cloud (Hodge & Schommer, 1984) and the massive and compact young star clusters in M31 (Williams & Hodge, 2001).
The star clusters hosting the LMXB/PN associations in M31 would need to be the diffuse, faint relics of once-larger clusters. However, the likelihood that such relic clusters would be massive enough to contain both an LMXB and a PN simultaneously, massive enough not to dissociate completely in 109 years, and faint enough to be undetected, seems low.
5 Conclusions
Several recent Chandra surveys of M31 have identified X-ray sources in the M31 bulge spatially coincident with previously cataloged PNe. Using the [O III] data from the Local Group Survey, we have directly compared the X-ray source positions to the locations of the cataloged PNe, finding that the X-ray sources are not precisely coincident with the PNe. The estimated [S II]/H ratios of 4 of these “PNe” are consistent with shock-heating, i.e. SNRs.
The fact that the X-ray emission is displaced from the [O III] emission is consistent with the classification of these nebulae as PNe, which are notoriously feeble X-ray sources. At the same time, the spatial proximity is unlikely to be coincidental: there is only a 0.4%–3.25% probability of these associations occurring by chance. These associations therefore require some explanation. Any explanation that physically links these strong X-ray sources to the [O III] sources does not allow the [O III] sources’ PNe classifications to stand.
Only detailed spectroscopy is likely to determine the true nature of these [O III] sources and the reason for their proximity to bright X-ray emitters. If (as our narrow-band flux estimates suggest) they are X-ray weak, young SNRs like SN 1006 or 3C 58, the existence of the nearby X-ray sources is still unexplained. The nearby X-ray sources cannot be ejected XRBs. As stated above (see §4), such a scenario requires core-collapse supernovae and supernova kick velocities 3000 km s-1 to explain the distances from the nebulae to the X-ray sources. These kick velocities would disrupt any X-ray binary system.
Finally, perhaps an XRB/PN association could be produced within a relic of a star cluster. This explanation requires underlying star cluster relics in M31 massive enough not to dissociate completely in 109 years and faint enough to be undetected in ground-based images. Otherwise, the best explanation for these associations appears to be the statistically unlikely one that all of these [O III]/X-ray pairs are spatial coincidences.
We thank John Raymond for advising in the interpretation of the [O III] fluxes. Support for this work was provided by NASA through grant number GO-9087 from the Space Telescope Science Institute and through grant number GO-3103X from the Chandra X-ray Center. MRG acknowledges support from NASA LTSA grant NAG5-10889.
References
- Arzoumanian et al. (2002) Arzoumanian, Z., Chernoff, D. F., & Cordes, J. M. 2002, ApJ, 568, 289
- Auriere et al. (1992) Auriere, M., Coupinot, G., & Hecquet, J. 1992, A&A, 256, 95
- Bahcall & Hausman (1976) Bahcall, N. A., & Hausman, M. A. 1976, ApJ, 207, L181
- Bevington & Robinson (2003) Bevington, P. R., & Robinson, D. K. 2003, Data reduction and error analysis for the physical sciences (Boston, MA: McGraw-Hill)
- Braun (1990) Braun, R. 1990, ApJS, 72, 755
- Chakrabarty & Roche (1997) Chakrabarty, D., & Roche, P. 1997, ApJ, 489, 254
- Ciardullo et al. (1989) Ciardullo, R., Jacoby, G. H., Ford, H. C., & Neill, J. D. 1989, ApJ, 339, 53
- Clarkson et al. (2004) Clarkson, W. I., Charles, P. A., & Onyett, N. 2004, MNRAS, 348, 458
- Cordes & Chernoff (1998) Cordes, J. M., & Chernoff, D. F. 1998, ApJ, 505, 315
- Deharveng et al. (1982) Deharveng, J. M., Joubert, M., Donas, J., & Monnet, G. 1982, A&A, 106, 16
- D’Odorico et al. (1980) D’Odorico, S., Dopita, M. A., & Benvenuti, P. 1980, A&AS, 40, 67
- Fall & Zhang (2001) Fall, S. M., & Zhang, Q. 2001, ApJ, 561, 751
- Fesen et al. (1997) Fesen, R. A., Winkler, F., Rathore, Y., Downes, R. A., & Wallace, D. 1997, AJ, 113, 767
- Ford & Jacoby (1978) Ford, H. C., & Jacoby, G. H. 1978, ApJ, 219, 437
- Freeman et al. (2001) Freeman, P., Doe, S., & Siemiginowska, A. 2001, in Proc. SPIE Vol. 4477, p. 76-87, Astronomical Data Analysis, Jean-Luc Starck; Fionn D. Murtagh; Eds., 76
- Guerrero et al. (2000) Guerrero, M. A., Chu, Y., & Gruendl, R. A. 2000, ApJS, 129, 295
- Guerrero et al. (2001) Guerrero, M. A., Chu, Y., Gruendl, R. A., Williams, R. M., & Kaler, J. B. 2001, ApJ, 553, L55
- Helfand et al. (1995) Helfand, D. J., Becker, R. H., & White, R. L. 1995, ApJ, 453, 741
- Ho et al. (1993) Ho, L. C., Filippenko, A. V., & Sargent, W. L. W. 1993, ApJ, 417, 63
- Hodge & Schommer (1984) Hodge, P. W., & Schommer, R. A. 1984, PASP, 96, 28
- Hoeflich et al. (1998) Hoeflich, P., Wheeler, J. C., & Thielemann, F. K. 1998, ApJ, 495, 617
- Kaaret (2002) Kaaret, P. 2002, ApJ, 578, 114
- Kastner et al. (2001) Kastner, J. H., Vrtilek, S. D., & Soker, N. 2001, ApJ, 550, L189
- Kohoutek (2001) Kohoutek, L. 2001, A&A, 378, 843
- Kong et al. (2002a) Kong, A. K. H., Garcia, M. R., Primini, F. A., & Murray, S. S. 2002a, ApJ, 580, L125
- Kong et al. (2002b) Kong, A. K. H., Garcia, M. R., Primini, F. A., Murray, S. S., Di Stefano, R., & McClintock, J. E. 2002b, ApJ, 577, 738
- Kong et al. (2003) Kong, A. K. H., Sjouwerman, L. O., Williams, B. F., Garcia, M. R., & Dickel, J. R. 2003, ApJ, 590, L21
- Levenson et al. (1995) Levenson, N. A., Kirshner, R. P., Blair, W. P., & Winkler, P. F. 1995, AJ, 110, 739
- Magnier et al. (1997) Magnier, E. A., Primini, F. A., Prins, S., van Paradijs, J., & Lewin, W. H. G. 1997, ApJ, 490, 649
- Massey et al. (2001) Massey, P., Hodge, P. W., Holmes, S., Jacoby, G., King, N. L., Olsen, K., Saha, A., & Smith, C. 2001, in American Astronomical Society Meeting, Vol. 199, 13005
- Mavromatakis et al. (2000) Mavromatakis, F., Papamastorakis, J., Paleologou, E. V., & Ventura, J. 2000, A&A, 353, 371
- McCall et al. (1985) McCall, M. L., Rybski, P. M., & Shields, G. A. 1985, ApJS, 57, 1
- Melchior et al. (2000) Melchior, A.-L., Viallefond, F., Guélin, M., & Neininger, N. 2000, MNRAS, 312, L29
- Mignani et al. (2002) Mignani, R. P., De Luca, A., Caraveo, P. A., & Mirabel, I. F. 2002, A&A, 386, 487
- Panagia & Weiler (1980) Panagia, N., & Weiler, K. W. 1980, A&A, 82, 389
- Predehl & Schmitt (1995) Predehl, P., & Schmitt, J. H. M. M. 1995, A&A, 293, 889
- Ritter & Kolb (2003) Ritter, H., & Kolb, U. 2003, A&A, 404, 301
- Rubin et al. (1972) Rubin, V. C., Krishna Kumar, C., & Ford, W. K. J. 1972, ApJ, 177, 31
- Sjouwerman & Dickel (2001) Sjouwerman, L. O., & Dickel, J. R. 2001, in Young Supernova Remnants: Eleventh Astrophysics Conference. AIP Conference Proceedings, Vol. 565. College Park, Maryland, 16-18 Oct, 2000. Edited by Stephen S. Holt, and Una Hwang. American Institute of Physics, 433
- Stephens et al. (2003) Stephens, A. W., et al. 2003, AJ, 125, 2473
- Trudolyubov et al. (2002) Trudolyubov, S. P., Borozdin, K. N., Priedhorsky, W. C., Osborne, J. P., Watson, M. G., Mason, K. O., & Cordova, F. A. 2002, ApJ, 581, L27
- van den Bergh (1990) van den Bergh, S. 1990, ApJ, 357, 138
- van Speybroeck et al. (1979) van Speybroeck, L., Epstein, A., Forman, W., Giacconi, R., Jones, C., Liller, W., & Smarr, L. 1979, ApJ, 234, L45
- Vancura et al. (1992) Vancura, O., Blair, W. P., Long, K. S., & Raymond, J. C. 1992, ApJ, 394, 158
- Veilleux & Osterbrock (1987) Veilleux, S., & Osterbrock, D. E. 1987, ApJS, 63, 295
- Walterbos & Braun (1992) Walterbos, R. A. M., & Braun, R. 1992, A&AS, 92, 625
- Williams (2003) Williams, B. F. 2003, AJ, 126, 1312
- Williams et al. (2003) Williams, B. F., Garcia, M. R., Kong, A. K. H., Primini, F. A., King, A. R., Di Stefano, R., & Murray, S. S. 2003, ApJ, accepted (astro-ph/0306421)
- Williams & Hodge (2001) Williams, B. F., & Hodge, P. W. 2001, ApJ, 548, 190
- Williams et al. (1995) Williams, B. F., Schmitt, M. D., & Winkler, P. F. 1995, in American Astronomical Society Meeting, Vol. 27, 883
- Williams et al. (2004) Williams, B. F., Sjouwerman, L. O., Kong, A. K. H., & Garcia, M. R. 2004, ApJ, submitted
- Willingale et al. (1996) Willingale, R., West, R. G., Pye, J. P., & Stewart, G. C. 1996, MNRAS, 278, 749
- Winkler et al. (2003) Winkler, P. F., Gupta, G., & Long, K. S. 2003, ApJ, 585, 324
- Winkler & Laird (1976) Winkler, P. F., & Laird, F. N. 1976, ApJ, 204, L111
- Wirth et al. (1985) Wirth, A., Smarr, L. L., & Bruno, T. L. 1985, ApJ, 290, 140
- Zhang & Fall (1999) Zhang, Q., & Fall, S. M. 1999, ApJ, 527, L81
| OBJ | RA | Dec. | PN | Sep (′′) | Slope | kT (keV)aaFor sources with a significant blackbody component, the blackbody temperature is provided with a 1 error. | bbThe absorption with 1 error in units of cm-2. | ccThe probability (based on ) that the data represent a sample taken from a source spectrum with the model parameters listed. | #cts | ddThe unabsorbed X-ray luminosity (0.3–7 keV) in units of erg s-1, assuming the spectral fit represents the true source spectrum. | |
|---|---|---|---|---|---|---|---|---|---|---|---|
| r1-24 | 00:42:43.211 | +41:16:40.39 | Ford 322 | 0.74 | 2.10.2 | 2.50.7 | 17.29/19 | 0.570 | 227 | 4.4 | |
| r1-26 | 00:42:45.095 | +41:15:23.36 | Ford 21 | 1.11 | 1.790.03 | 0.090.02 | 21 | 5.77/13 | 0.954 | 194 | 6.3 |
| r1-2 | 00:42:47.182 | +41:16:28.56 | Ford 13 | 1.24 | 1.880.02 | 0.840.05 | 1.50.1 | 142.5/127 | 0.164 | 3599 | 63.8 |
| r3-21 | 00:43:03.027 | +41:20:41.56 | Ford 201 | 1.17 | 2.00.5 | 94 | 8.63/6 | 0.195 | 93 | 4.0 | |
| r3-67 | 00:43:06.610 | +41:19:13.98 | Ford 494 | 2.19 | 2.30.6 | 0.050.01 | 53 | 1.70/3 | 0.636 | 73 | 117 |
| r3-7 | 00:43:21.063 | +41:17:50.44 | Ford 209 | 2.31 | 2.00.2 | 0.6 | 13.44/19 | 0.815 | 224 | 4.2 |
| PN | H | [S II] | [O III] | [S II]/HaaA [S II]/H ratio greater than 0.4 is typical for shock heated gas. Lower ratios are typical of photo-ionized gas. | [O III]/Hbb[O III]/H ratios are corrected for absorption assuming (Predehl & Schmitt, 1995), and the standard extinction law. Where our fits measured cm-2, cm-2 was assumed. |
|---|---|---|---|---|---|
| Ford 322 | 3.4 | 3.1 | 3.4 | 0.9 | 1.3 |
| Ford 21 | 1.1 | 1.5 | 11.4 | 1.4 | 13.4 |
| Ford 13 | 5.9 | 6.5 | 9.1 | 1.1 | 1.9 |
| Ford 201 | 0.9 | 0.6 | 3.3 | 0.7 | 4.7 |
| Ford 494 | 0.1 | 0.1 | 1.0 | 10 | |
| Ford 209 | 3.4 | 0.7 | 11.2 | 0.2 | 3.6 |