Gamma Ray Emission from Merger Shocks in the Coma Cluster of Galaxies
Abstract
A numerical simulation model of the injection and cooling of nonthermal particles energized by shocks formed in merging clusters of galaxies is used to fit radio and X-ray data observed from the Coma cluster of galaxies. The results are consistent with a primary merger-shock origin for both the diffuse radio halo emission and the hard X-ray excess measured with Beppo-SAX and RXTE. For equal (1%) efficiency of power injected in nonthermal protons and electrons, we predict that the Coma cluster of galaxies will be significantly detected with the space-based observatory GLAST, and marginally detectable with the ground-based -ray observatories VERITAS and HESS. Significant TeV detections are possible if the nonthermal proton intensity is greater due to a larger efficiency of nonthermal hadron acceleration, or to past merger events. The nonthermal hadronic content in Coma is also revealed by a weak, hard secondary emission component at – 100 GHz. The spectral softening of the radio emission at large radii from the Coma cluster core derives in this scenario from the decreasing shock speed away from cluster center for an on-axis merger event. We discuss differences between merger and delayed turbulence models.
1. Introduction
The discovery of the first radio halo, Coma C, demonstrated the existence of a population of nonthermal electrons within the intracluster medium (ICM) of the Coma cluster of galaxies (see Sarazin [52] and [7] for review; radio intensity maps and spectra of Coma are reported by Thierbach, Klein, & Wielebinski [59], Schlickeiser et al. [57], and [29]). The origin of these energetic electrons could be associated with a merger event [60], for example, between the central NGC 4889 and NGC 4874 galaxy groups. In addition, the radio relic 1253+275 is found on the Coma cluster (A1656) periphery, possibly indicating the presence of a shock resulting from a recent or ongoing merger event. Several tens of galaxy clusters, representing % of the cluster population, are reported to have radio halos, and these clusters preferentially show recent merger activity [10]. Because of their relatively short radiation lifetimes, GHz-emitting nonthermal electrons have to be accelerated on timescales shorter [53, 41] than merger timescales.
Optical measurements of radial velocities of galaxies reveal the cluster dynamics dominated by the gravitational potential well of the dark-matter halo. Although Coma is considered to be the nearest rich relaxed cluster, with a FWHM diffuse X-ray angular extent , optical surveys of the radial velocities of 1174 galaxies in the Coma cluster [17, 6, 21] show that it is in a highly dynamic state as a result of a recent merger event.
Observations with ROSAT [66] and ASCA (Honda et al. [31]; see references in [11]) show multiple X-ray emission peaks from the core of the Coma cluster. The diffuse cluster emission peak associated with the cluster center is coincident with the galaxy NGC 4874. A second diffuse emission peak was found approximately halfway between NGC 4874 and NGC 4889. XMM-Newton observations [1, 11] did not detect this second peak but found X-ray emission peaks coincident with both NGC 4874 and NGC 4889, a relaxed thermal structure within 10′ of the cluster center, multiple point sources, and stripped gas on the cluster periphery. Chandra observations of galaxy clusters with radio halos reveal complex temperature maps indicating recent or ongoing merger events [30]. In the case of Coma, Chandra results indicate that the X-ray emission from the coronae surrounding the dominant galaxies NGC 4874 and NGC 4889 and their galaxy groups arises from denser, X-ray gas clouds with temperatures of a few keV that are in equilibrium with the intracluster gas [63].
BeppoSAX [26] and Rossi X-Ray Timing Explorer (RXTE) [45] observations of the Coma Cluster show hard X-ray (HXR) emission in excess of single-temperature bremsstrahlung, though its detection with BeppoSAX is disputed [49], and the hard tail remains unconfirmed with INTEGRAL. BeppoSAX results [40] also indicate that clusters undergoing recent or ongoing merger events have HXR excesses with – luminosities – , whereas fully relaxed clusters are consistent with no HXR excess.
At -ray energies, the Coma cluster was not detected [43] with the EGRET telescope on the Compton Observatory at MeV. Statistical analysis of the positional association of unresolved gamma-ray emission from rich clusters of galaxies in the local universe shows a weak () positive correlation [55]. In addition, there are claims of an association between unidentified, high galactic latitude () EGRET sources and galaxy clusters (Kawasaki & Totani [32], Colafrancesco [16], though contested by Reimer et al. [43]). The results of searches for TeV emission with the ground-based imaging air Cherenkov telescopes (IACTs) HESS (High Energy Stereoscopic System) and VERITAS (Very Energetic Radiation Imaging Telescope Array System) as they reach their design capabilities are anxiously awaited,111The latitudes of Whipple/VERITAS and HESS are and , respectively, so Coma, at declination , is a better target for VERITAS than HESS. but the sensitivities of IACTs and coded mask telescopes such as INTEGRAL are compromised by the extent of Coma’s diffuse emission [27] which, as in the case of the thermal X-rays, could subtend a large fraction of a square degree. The diffuse extent of the nonthermal emission in clusters of galaxies, as indicated by radio halos and relics, also makes it more difficult to map emission from cluster and accretion shocks with narrow field-of-view pointing telescopes. The TeV -rays from Coma will also be attenuated by the diffuse extragalactic infrared radiation [27].
There have been numerous attempts to model the diffuse radio emission associated with cluster radio halos in the context of a cluster merger model. Miniati et al. [36] treat acceleration of cosmic-ray protons in the context of a cosmological structure-formation simulation. They find that strong shocks form from cool, low density ICM gas accreting onto the cluster periphery. Such shocks are not expected to penetrate into the central region of the cluster environment. Numerical simulations [48, 46, 47] show that shocks forming in merger events between two virialized clusters of galaxies can, however, penetrate into the cluster core.
Gabici & Blasi [28] found that shocks resulting from a major merger event (as defined in Section 2) between two virialized clusters of similar mass produce nonthermal particle spectra that are too soft to account for the observed emission from most radio halos. Minor mergers are more effective for injecting hard electron spectra. Berrington & Dermer (2003) (hereafter BD [5]) show that the typical peak Mach speeds of cluster merger shocks in minor mergers are – 5. Primary electron synchrotron radiation injected by merger shocks can account for the observed radio emission from Coma C, as we show here.
Besides a directly accelerated electron population from a merger shock, nonthermal radio halos detected from Coma and more than clusters of galaxies could also originate from the decay products of proton interactions [18, 61]. Blasi & Colafrancesco [9] performed a detailed study of this model for the Coma cluster and find that if the radio emission is due to secondary electrons, then EGRET should have detected Coma. Moreover, this model is difficult to reconcile with the correlation of cluster radio halos with merger activity [10] or the softening of Coma’s radio spectrum with radius, because clusters of galaxies will confine protons for the age of the universe [64, 4]. The cluster radio halos could also be a consequence of delayed acceleration by second-order Fermi processes associated with magnetic turbulence in the ICM [57]. The most detailed study to date [13] of the plasma physical processes results in a model for the Coma radio spectrum that could fit the data. Some concerns with the merger model, and fits to Coma data in a simplified merger model is given by Blasi [8] (with references to earlier work). We consider these points in our Discussion section.
In Section 2, we adapt our merger-shock model [5] to the Coma cluster environment. Our approach directly ties the substructure in Coma to the radio and HXR excess. Assuming a merger-shock origin for the nonthermal radiation from the Coma cluster, we show in Section 3 that if protons are accelerated with the same efficiency as electrons, Coma is predicted to be detected at GeV energies with the Gamma Ray Large Area Space Telescope (GLAST), and at TeV energies with the IACTs VERITAS and HESS. Hadrons remaining from previous merger shocks [28] could increase the -ray flux, but loss of sensitivity to extended sources could decrease detectability. An estimate of GLAST sensitivity for the Coma cluster in the Appendix shows that even for the most optimistic fluxes of -rays allowed by radio observations, Coma will be detected with only significance.
The results are summarized in Section 4, where we discuss and compare predictions of merger and reacceleration models. We argue that gamma-ray detection of Coma will support a merger-shock origin of the nonthermal radiation from Coma, though second-order turbulent re-acceleration effects could play an associated role in nonthermal emissions from clusters of galaxies. The Appendix gives some analytic results for cluster merger physics that provide a check on the numerical results.
2. The Coma Cluster Environment
Because nonthermal spectral power depends sensitively on the parameters of the cluster environment, we modified the code developed by BD [5] specifically to the properties of Coma (see Table 1). The Coma cluster of galaxies is well-described by an event where a dominant cluster of total mass [17] merges with a smaller cluster of total mass cluster [62, 20]. We assume a gas mass fraction of .
| Redshift | |
|---|---|
| 8.21 keV | |
| 2.0 keV | |
| 0.257 Mpc | |
| 0.15 Mpc | |
| 1.3 Mpc | |
| 0.75 Mpc | |
| 0.705 | |
| gm cm-3 | |
| gm cm-3 |
Let represent the mass ratio between the merging and dominant clusters. Merger events with mass ratio are designated accretion events [51]. The core of the dominant cluster is found to remain intact unless [25]. In our proposed model, the mass ratio of the two clusters is . This places our model well below the threshold when the internal structure of the dominant core is destroyed, and classifies our model as a cluster merger event. In addition, the mass ratio is great enough that the shock resulting from the merger event will penetrate into the core of the cluster [48]. Our semi-analytical dynamics approach compares favorably with N-body simulation results until the centers-of-mass of the clusters pass through each other [5]. At later times, the dynamics of the merging cold dark matter halos and the hydrodynamics of the gas are not accurately treated, and during this phase we expect rapid coalescence of the cold dark matter halo and shock quenching as the gas dynamics enters a Sedov phase.
The calculation of nonthermal electron injection, electron energy losses and the production of the Compton-scattered emission for the various radiation fields, including the cosmic microwave background radiation (CMBR), the stellar radiation, and the X-ray radiation fields, follows the treatment of BD [5] (see also Sarazin [53], Petrosian [41]). For a galaxy luminosity function described by the Schechter luminosity function with parameters , , and [56], the energy density of the stellar radiation field is found to be
| (1) |
where R is the radius of the Coma cluster.
The Coma cluster has a tenuous ICM that emits thermal X-ray bremsstrahlung. To model the emission from the ICM, we assume that the ICM is well approximated by a model222As shown in Appendix A.3, the use of an NFW profile gives relative merger speeds that are similar to that obtained with a -model. with core radius , central electron density , central proton density , power-law slope , and a mean gas temperature [37] (for the total mass modeling, we assume for simplicity that the gas is entirely composed of H). The energy density of the X-ray radiation field is then given by
| (2) |
This energy density corresponds to a total free-free luminosity of emitted within a cluster radius of . The energy density of the CMBR is
| (3) |
Given the evidence for a recent merger event in Coma, as described in Section 1, we argue that merger shocks accelerate nonthermal particles to produce nonthermal radio and X-ray emission. The evolution and properties of the forward and reverse cluster merger shocks are determined by the relative speeds and densities of the merging clusters. We have calculated the relative cluster speeds and shock properties following the method described in BD [5]. The particle number density of the ICM is assumed to be well approximated by a spherically-symmetric model whose parameters are given above. The dark matter halo, whose total mass is normalized to out to a maximum radius as given in Table 1, is assumed to follow a profile similar to the cluster ICM. Beppo-SAX observations [24] support the claim that the dark matter halo of Coma is better fit by the King [33] approximation to the isothermal model, given by
| (4) |
where is the central density, is the ratio of the total matter density to the normal matter density and is the core radius, than the Navarro, Frenk, & White [38] (NFW) density profile.
The efficiency parameters and giving the fraction of power dissipated by the shock in the form of nonthermal electrons and protons, respectively, are set equal to 1%. The injected particle spectrum is described by a power law in momentum space truncated by an exponential cutoff. The cutoff energy is determined by time available for acceleration since the onset of the shock, comparison of the size scale of the system with the particle Larmor radius, and competition of the acceleration time scale with radiative-loss time scales (§2.2 in BD [5]). The total energy liberated from the cluster merger event and deposited into the nonthermal particles is .
3. Model Results
The model that best represents the multiwavelength data of the Coma Cluster is found to be described by the merger of two clusters nearing collision time, , when the centers of mass of the two clusters are almost coincident, as supported by observations [17, 6, 21]. With the masses of the merging clusters given above, and an initial separation of 2.25 Mpc, the observations take place at after the onset of the merger. The observed redshift of the Coma cluster is . For this value of , the redshift of the cluster at the start of the cluster merger event (when the outer radii of the two -model profiles first intersect) for a flat CDM cosmology with and is . Here we use a Hubble constant km s-1 Mpc-1, giving a luminosity distance cm for Coma.
The total energy spectra of primary protons and primary and secondary electrons (including positrons) that fit measurements of the Coma spectrum are shown in Fig. 1. As can be seen, the proton distribution is well described by a power-law spectrum between GeV and eV. At the highest energies, the spectrum is cut off due to the available time required to accelerate protons to the highest energies. The strong radiative losses, principally due to Compton scattering with the CMBR, causes the abrupt cutoff of the primary electron spectrum. Because of the production kinematics and pile-up due to radiative losses, the secondary electron spectrum displays a bump at a few GeV.
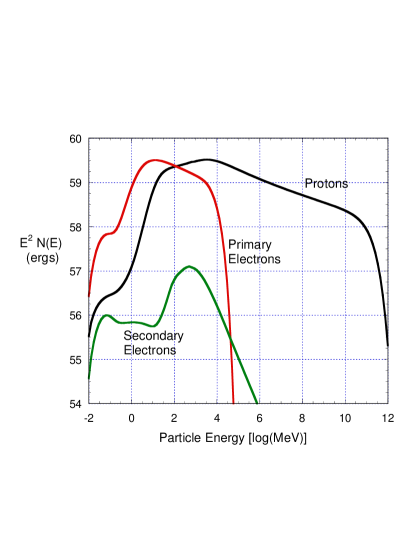
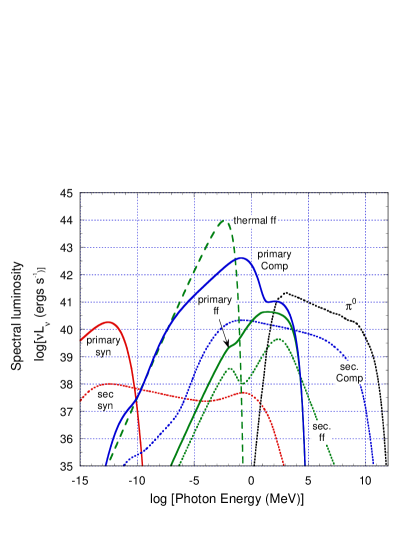
Fig. 2 shows the different spectral components used to fit the multiwavelength Coma spectrum. For the single merger event calculated here, the primary electron radiation generally dominates secondary emissions at radio and X-ray wavelengths, but secondary emissions make a contribution at mm radio wavelengths and at MeV energies for the assumed 1% efficiency fractions and of energy injected in the form of nonthermal particles. The value of is determined by normalizing the primary electron Compton emissions to the keV nonthermal X-ray flux, insofar as only a small fraction of the X-ray flux is produced by bremsstrahlung and Compton emissions from secondary processes. The hardening at GeV in the primary Compton component is stellar radiation photons scattered by the primary electrons. The ratio of the energy densities, and therefore peak fluxes, is , from eqs. (1) and (3). Scattering of the thermal diffuse X-rays to GeV energies is suppressed by the absence of primary electrons at these energies (Fig. 1).
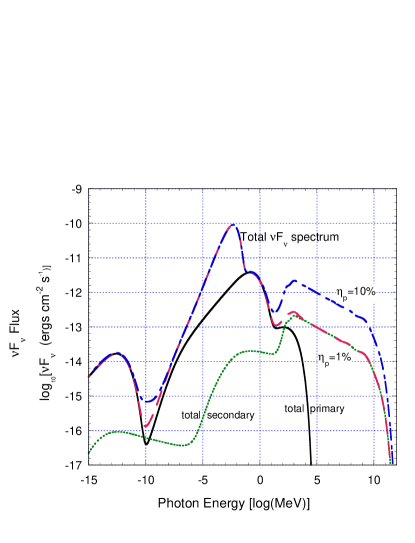
At MeV -ray energies, most of the emission is from secondary -decay rays formed by nuclear processes in collisions of nonthermal protons with the diffuse gas. The flux of the secondary emissions is in proportion to the assumed fraction, 1%, of the power swept-up by the forward and reverse shocks and injected in the form of a nonthermal power-law momentum distributions of hadrons. The total spectral energy distribution used to fit the Coma spectrum is shown in Fig. 3, where we vary the fraction of energy deposited in the form of nonthermal hadrons from % to %.
A comparison of the merger model with the measured [59] radio emission from the radio halo of Coma is shown in Figure 4. The mean magnetic field, obtained by normalizing to the radio emission, is , and is in agreement with analytic estimates (see Appendix). Our model is in accord with a primary electron source for the radio emission—a comparable contribution to the radio flux from secondary nuclear production would require that approach 100% to produce the measured radio emission, and would furthermore require a very different nonthermal proton spectrum. From spectral considerations, observations of Coma imply that %; otherwise a hard hadronic component would be seen in the multi-GHz radio emission. We note that the fluxes from secondary electrons and positrons calculated here may overestimate the actual fluxes from secondary leptons by as much as a factor of because a uniform density profile, appropriate to the central region of the cluster, is used in the calculation of secondary production. This is nevertheless a good approximation because the density in the central region is roughly constant and most of the nonthermal radiation is formed by interactions in this region.

Our model assumes a single merger event. Because galaxy clusters are built up by multiple merger events [28], and GeV – PeV protons and ions do not escape from galaxy clusters during a Hubble time [64, 4], a nonthermal population of protons accelerated in previous merger events is likely. Coma may have seen merger events during its buildup. Previous merger events are less energetic and nonthermal protons experience collisional and catastrophic losses through interactions with the thermal protons in the ICM in the meantime, so the total energy enhancement of hadrons over leptons is probably not more that – 10 from past merger events. The superposition of proton spectra from these past events may also produce non-power law spectra [28]. This would also hold for the varying shock compression ratios in a single merger event, though we find that because most of the nonthermal hadrons are injected when the spectrum is hardest, the proton spectrum is accurately described by a power-law (Fig. 1) with index close to the hardest reached during the merger event. As demonstrated in the Appendix, injection indices reaching are feasible during a minor merger,
The calculated thermal and non-thermal X-ray fluxes are compared in Fig. 5 with the HXR flux measured from the central ( Mpc) region of the Coma cluster. Data points show the HXR flux measured with the Phoswich Detection System on Beppo-SAX [26], the HEXTE (High-Energy X-Ray Timing Experiment) instrument on RXTE [45], and the OSSE upper limits [44]. Despite the difference in spectral range and field-of-view of the Proportional Counter Array on Beppo-SAX and HEXTE on RXTE, both instruments indicate the presence of an HXR excess observed in Coma. The existence of the HXR tail in the Coma cluster has, however, been challenged [49]. Observations with ISGRI on INTEGRAL could help to resolve this controversy, as indicated by the sensitivity curves plotted in Fig. 5. But because the Coma Cluster is extended, the sensitivity is degraded by a factor of 2 – 3 by the use of a coded-mask imager on the INTEGRAL satellite (A. Vikhlinin, private communiation, 2004). Astro E-2 (Suzaku) should resolve this important question in the near future.

Fig. 6 shows the predicted -ray emission from the Coma cluster of galaxies. Sensitivity limits are taken from Weekes et al. [65] for the VERITAS point-source sensitivty (which is comparable to the HESS sensitivity). Because of Coma’s extent, the sensitivities of these IACTs can be worse at 1 TeV [27] than shown. The predicted -ray emission falls below the EGRET sensitivity curve and the measured 2 upper limit of ph( MeV) cm-2 s-1 [43]. Our model predicts that GLAST will significantly detect the non-thermal -rays from Coma to energies of several GeV. Reduction in the sensitivity of GLAST due to the Coma’s extended structure is not significant, as shown in the Appendix. Furthermore, we predict that both VERITAS and HESS could have high confidence () detections if % or there is significant nonthermal protons left over from past merger events. Attenuation of sub-TeV -rays by the extragalactic diffuse infrared and optical radiation fields is not significant, though it is for multi-TeV fluxes [27].

4. Discussion
We have developed a cluster merger model based on observations of merger activity in the central regions of the Coma cluster of galaxies. Our model employs a semi-analytic treatment of cluster dynamics based on an N-body simulation [5] where nonthermal electrons and protons are injected with an intensity and spectrum that depends on the strength of the evolving shocks that are formed by the cluster merger. This represents a significant improvement over previous analytic merger models [e.g., 9, 8, 42] by considering the evolution of the particle distribution and system parameters with time. The model also provides a joint treatment of both electron and hadron populations and detailed spectral fits in comparison with those yet available with numerical hydrodynamic codes, such as given by Miniati et al. [36] and Miniati [35]. Moreover, our model is specifically tied to the observed substructure of Coma. We find that a detailed merger model gives a good fit to the multifrequency spectrum of the Coma cluster, confirming the simpler analytic models.
The measured spectrum of the diffuse radio emission of Coma C is consistent with a model of synchrotron radiation from electrons accelerated at merger shocks. Because of the short radiative lifetimes ( – 200 Myrs, depending on magnetic field) for GHz-emitting electrons, compared to the Gyr merger time scale (see Appendix), the primary synchrotron emission emitted over the lifetime of the injected electrons is very soft, thus accounting for the soft radio spectrum shown in Fig. 4.
The radio emission from Coma C shows an increasingly soft spectral index with radius [57, 29]. We cannot directly compare our results with the projected angular distribution of radio emission resulting from the merger event, because our numerical code does not calculate the spatial dependence of the radiation emitted by particles. A merger model may be expected to produce softer radio emission at large distances from the cluster center, provided that the contribution of electrons and positrons formed in secondary nuclear production from protons and ion interactions is small [36]. This is because the speed of the merger shock varies according to the density contrast between the dominant and smaller merging cluster. Because the core and maximum radii, and , of the minor cluster are less than that of the dominant cluster (Table 1), the speed of the shocked fluid becomes monotonically smaller at larger distances from the collision axis for a planar surface, essentially implying that a bow shock structure is created (see Appendix). This behavior is already apparent in Fig. 2 of [5], where we found that shock strength is weaker at larger distances from cluster center, so that particles are injected with softer spectra in the outer parts of the merger, and even more so if they are away from the merger axis. Hydrodynamic simulations are needed to calculate the injection spectra at the same observing times, but it is clear from our results that softer emission will be injected at larger impact parameters while the merger event is in progress.
In the case of Coma, excess gas located at a projected radial distance of from the cluster center, if interpreted as gas stripped from the merging cluster and left at the insertion point on the cluster periphery (), indicates that the angle between the plane of the sky and the orbital axis of the merger event is [62, 1]. Thus the propagation of the merger shocks are nearly along the line of sight, and the observed nonthermal emission results from the line-of-sight integration of the particle emissivities. The lower density in the periphery of the minor cluster as it merges with the larger cluster produces, in a planar geometry, stronger reverse shock emission with potentially harder injection at spectra large radii. If the two clusters were merging in a direction transverse to the line-of-sight, then we would expect asymmetric emission related to the merger geometry, as found in off-axis cluster-merger events [47].
A bow shock structure, though with a rather low Mach number (), is seen in the merging galaxy cluster A520 [34] that displays a prominent radio halo. Another is found in 1E 0657-56, which also shows a radio halo [30]. This demonstrates that ongoing mergers are effective at accelerating primary electrons, though additional processes, such as turbulence, may contribute to acceleration in the radio halo.
In the picture studied here, the appearance of Coma is a result of an on-axis minor merger event where observations are taken shortly after the passage of the centers of mass of the two merging clusters. This collision epoch is in fact indicated by the optical data, but could raise questions of whether observations at this epoch are the result of fine-tuning. It seems likely that the merger shock is rapidly quenched after the passage and coalescence of the dark matter halos, so that radio emission is most likely seen precisely at the epoch at which we find the Coma cluster. This interpretation would also explain the relative rarity of radio halos in clusters, which would be primarily limited to those which have undergone recent minor mergers.
The symmetrical and unpolarized radio emissions of most cluster halos may be contrary to expectations from a merger event, which might be expected to be highly asymmetric and polarized as for radio relics. But for the minor mergers, which are the only ones with sufficient Mach speeds to make radio halos, a bow-shock “jellyfish” structure could be created that might be confused with a quasi-symmetrical radio halo. Viewing through both sides of the jellyfish could reduce the polarization. Moreover, high resolution mapping of the structure of a radio halo could be unfolded to reveal the extended gaseous and possibly dark matter distributions. This prospect becomes more attractive with the development of high resolution, low frequency radio arrays to map the galaxy cluster radio halo emission.
The difficulty for the cluster merger model is to avoid producing asymmetric radio emissions, especially for those events observed transverse to the collision axis. This problem cannot be alleviated by appealing to MHD turbulence that moves with the Alfvén speed
| (5) |
for mean magnetic fields and cm-3 mean proton densities, which is much slower than the thermal speed. Unless particles are transported without streaming losses, in which case they do not deposit energy, energy is transported to the surrounding regions of the merger shock through MHD processes on timescales much longer than the merging timescale. A delayed re-acceleration model can, in principle, remedy the morphology problem.
To model the radio halo emission from clusters of galaxies, Schlickeiser et al. [57], Brunetti et al. [12] and Brunetti et al. [13] consider reacceleration of electrons via turbulence generated in a post-merger event. This approach may be supported observationally by detection of turbulence in the core of Coma [58]. The total energy found in a population of relativistic nonthermal hadrons is expected to be of the thermal energy pool [28, 5], inasmuch as most clusters are expected to experience several merger events in their formation history and protons with energies are confined within a cluster of galaxies over a Hubble time [64, 4]. This nonthermal pool of streaming protons could introduce turbulence that would accelerate electrons long after the merger events. Delayed reacceleration models are highly sensitive to the energy deposited into the nonthermal protons, however, so that if this energy content is unreasonably large, an episodic injection scenario, such as the merger-shock model considered here, may be favored [41].
The morphology question and the discrepant magnetic field values from Faraday rotation measurements compared to Comptonized CMBR/X-ray emission model values of G [8, 41] can in principle be reconciled with the delayed turbulence reacceleration model [57, 8, 12]. This model has its own difficulties, however. Second-order Fermi processes accelerate—and very slowly in the cluster merger environment—hard particle spectra. A pre-injection spectrum is required, such as pre-existing particles in the ICM. Particle spectra with the appropriate spectral index can explain the radio emission of the Coma cluster in a reacceleration model [13], but have not yet been shown to explain the multiwavelength spectrum, including the radio spectral softening with radius, by the same model. Pre-injection of nonthermal particles from AGN sources [29] would also introduce asymmetries that would have to be “washed out” in the turbuelent reacceleration model. Indications that the appearance of radio halos are correlated with recent cluster merger behavior [10] are, however, apparently consistent with expectations of the turbulence model [14] given assumptions about the energy density of turbulence with cluster mass. More detailed studies correlating peaks in radio halo emission and spectra with merging activity could distinguish between a cluster merger and delayed reacceleration model but, most likely, both merger shocks and turbulent reacceleration make important contributions to nonthermal activity in clusters of galaxies.
Although the halo radio emission from Coma can be explained in the context of the cluster merger model, we do not claim that all radio halos can be accounted for by cluster merger shocks. A striking example that radio halos may have multiple origins is the recent XMM-Newton observation of the galaxy clusters A399 and A401. Both clusters have radio halos, but only the halo found in A399 appears to be associated with a shock front resulting from a cluster merger event [50]. The origin of nonthermal electrons producing the radio halo associated with A401 could have a different acceleration mechanism, for example, arising from accretion shocks [22] or revival of relic non-thermal particles [23].
Of central importance is to establish the strength and spectrum of the hard X-ray power-law component reported with BeppoSAX and RXTE, which normalizes the primary nonthermal electron power. Until these reports are confirmed, which may have to wait for the upcoming launch of Astro E-2, predictions for -ray detection of clusters of galaxies will remain highly uncertain. Moreover, the relative efficiency to accelerate protons and electrons and the unknown fraction of residual nonthermal hadronic energy left from previous mergers add additional uncertainties to predictions for -ray detection. First-order Fermi acceleration is, however, expected to accelerate protons with greater efficiency than electrons because of the larger proton gyro-radii [3], and past merger events can only add nonthermal protons to the total. Thus our -ray predictions are expected to represent a lower range of the hadronic fluxes, provided that nonthermal hard X-ray emission has indeed been detected with BeppoSAX and RXTE. If correct, then we predict that the Coma cluster will be detected with significance with GLAST (see Appendix), and marginally or significantly detected with VERITAS and HESS.
Our results can be compared with a recent theoretical study [42] which concludes that Coma will be detected with GLAST but not with the IACTs . The level of the high-energy radiation fluxes, which is made primarily by decay emission, depends crucially on the spectrum and high-energy cutoff of the nonthermal hadrons [2], which we argue is correctly calculated here. Observations of -ray emission from Coma will reveal the relative efficiency of nonthermal proton and electron acceleration.
High resolution radio maps from low-frequency ( MHz) arrays will be important to determine the nature of the observed radio emission in Coma. In the cluster merger scenario, energetic protons will diffuse farther from their point of origin than lower energy protons, and these have had a much longer time than the merger timescale to diffuse outwards. At sufficiently large radii, there will be a transition from radio emission of primary to secondary origin. Thus the cluster merger model indicates that the spectral index of Coma’s radio halo softens with radius until the radio emission is dominated by lepton secondaries from hadrons, where it would begin to harden. A hardening in the volume-integrated mm-radio spectrum of Coma is likewise expected from a hadronic component.
The TeV -rays from Coma will also be attenuated by the diffuse extragalactic infrared radiation [27]. Our numerical results from cluster merger model indicate that acceleration of hadronic cosmic rays by cluster merger shocks will produce a very high-energy -ray emission component extending to eV. Compton cascading and reprocessing of the cluster halo ultra high-energy (VHE) -rays will, for certain values of the intracluster magnetic fields, produce extended cascade -ray halos. Detection and mapping of such halos would be an important probe to measure ICM magnetic fields.
Appendix A Analytic Cluster Merger Physics
A.1. Radiation Processes
Suppose that the ICM of Coma is characterized as a quasi-spherical hot cloud of gas and plasma entraining magnetic field and nonthermal particles that were injected by shocks formed by merger events during structure formation. Assume an isotropic nonthermal electron pitch-angle distribution. On the size scale of the telescope’s resolution, we also assume that the magnetic field direction is randomly ordered, though with a mean magnetic field intensity that is roughly constant through the cluster.
An electron with Lorentz factor emits photons with frequency Hz. For magnetic fields measured in units of G, and for radio measurements at GHz, electrons with Lorentz factor
| (A1) |
Electrons with Lorentz factor
| (A2) |
Thomson-scatter CMBR photons to X-ray energies ( corresponds to a photon of keV).
Let and denote the radio frequency and dimensionless hard X-ray photon energy where the spectral slopes of the nonthermal radiation are the same. For Coma, we find that a nonthermal photon flux with photon number spectral index () provides a good fit to the BeppoSAX [26] and (RXTE) [45] observations (Fig. 5). The radio index at 30 MHz energies (Fig. 4). The interpretation that the nonthermal radio emission is synchrotron radiation and that Coma displays an associated nonthermal hard X-ray component from Compton-scattered CMBR implies magnetic fields from the condition that the primary Compton and primary synchrotron fluxes should have the same spectral indices for electrons with the same energies, that is, . Hence
| (A3) |
For Coma, therefore, , in good agreement with the value used in the numerical model. The discrepancy between this value and values derived from Faraday rotation measurments could be explained by multiple zones [8, 41], or the attribution of the hard X-ray excess to nonthermal bremsstrahlung [54]. Confirmation of the Beppo-SAX and RXTE results is especially crucial here, because the magnetic field can be larger and the electron intensity correspondingly smaller if there is no nonthermal X-ray tail to explain.
The timescale for Thomson-scattered CMBR and synchrotron cooling can be written as
| (A4) |
The lifetime for electrons that emit synchrotron radio emission with frequency GHz is
| (A5) |
The lifetime for electrons that emit hard X-ray photons with dimensionless energy is
| (A6) |
These timescales are generally shorter than dynamical time scales, as we now show.
A.2. Scaling Relations for Cluster Dynamics
From elementary considerations, the gain in kinetic energy when the minor cluster, treated as a test particle in the mass distribution of the dominant cluster, falls from radius to radius , is ). Thus when , so that
| (A7) |
where is equated with the core radius of the dominant cluster (see Table 1). The characteristic merger time is determined by the acceleration at the outer radius. Because ,
| (A8) |
where and Mpc. The available energy in the collision is
| (A9) |
The long timescale of merger events compared to the timescale for electrons that emit GHz radio emission, eq. (A5), means that these electrons had to have been accelerated recently compared to the duration of the cluster merger event.
The sound speed
| (A10) |
where the mean mass per particle is taken to be . From eq. (A7), this implies shocks with moderate Mach numbers .
A.3. Analytical Cluster Dynamics
We treat cluster dynamics analytically [see also 47], as a check on the validity of the numerical treatment. The merging activity in the Coma cluster of galaxies is again treated in the test-particle approximation for the minor cluster with mass , though now using the -model approximation to the isothermal mass distribution [15] given by
| (A11) |
for the dominant cluster, with , from eq. (4). The mass of cluster 1 interior to radius is
| (A12) |
We approximate for Coma, which is close to its value, , determined from observations. The outer radius is normalized to the total mass of the dominant cluster, giving
| (A13) |
Solving for , corresponding to a ratio of normal mass to CDM mass of 5%, gives 0.82 Mpc. When , for a 10% ratio of normal mass to CDM mass, 1.3 Mpc.
The change in potential energy of the test-particle cluster 2 when falling through the gravitational potential of cluster 1 is
| (A14) |
provided . For the case , eq. (A14) can be solved to give
| (A15) |
where .
Taking , we obtain and km s-1 for and 11, respectively. A sound speed km s-1 of the dominant cluster (Table 1 and eq. [A10]) implies Mach numbers and , compression ratios and 3.2, and injection indices and for and 11, respectively, using the standard formulas for nonrelativistic shock acceleration in the test particle limit. The injection index is in good agreement with the numerical results (see Fig. 1).
We instead consider the dark-matter density profile distribution given by a
| (A16) |
where is the scaling radius and is the characteristic overdensity. For the NFW [38] model, , and the mass of cluster 1 interior to radius becomes
| (A17) |
By normalizing to the total mass at the outer radius , one obtains that kpc for from Table 1, with g cm-3 [using kpc and given by 24]. Deriving the speed following the approach leading to eq. (A15) gives
| (A18) |
In the limit and , one finds that km s-1, implying a Mach number of , intermediate to the values found for the -model profile. Thus, our conclusions should not be much different whether we consider a -model or NFW profile.
A.4. Shock Structure in Merging Clusters of Galaxies
In [5], we derived the Mach numbers and of the forward and reverse shocks, respectively, given by
| (A19) |
and
| (A20) |
Here and are the sound speeds in the dominant and merging clusters, respectively. The value of is calculated by iteratively solving
| (A21) |
using eqs. (A19) and (A20). The terms and are the ICM number densities given by eq. (A11), and and are the mean masses per particle in the dominant and merging clusters, respectively.
A core radius of 0.15 Mpc is used for the minor cluster in the calculations. Becasue the core radius of the minor cluster is smaller than that of the dominant cluster, the relative densities along the shock front decrease away from the collision axis joining the two merging clusters. The shocked fluid speed also monotonically decreases away from the collision axis, as can be seen by numerically solving the above equations. This produces a weaker forward shock and a bow shock structure that will inject softer electron spectra at greater angular distances from the center of the Coma cluster.
The speed of the shocked fluid and the Mach numbers of the forward and reverse shocks calculated from these equations are shown in Fig. 7 as a function of density contrast in a planar geometry. The relative speed of the two clusters is set equal to 6000 km s-1. The gas temperatures of the two clusters are given in Table 1. When is larger, the speed of the shocked fluid is smaller. Consequently a bow-shock structure is formed.

A.5. Detection of Coma with GLAST
Using the expressions derived in Section 4 of BD [5], we estimate the detection significance and number of photons that GLAST will detect from the Coma cluster during years of GLAST observations in the scanning mode, using an exposure factor for Coma of %.
Figs. 2 and 3 show that the -ray flux spectrum from Coma can be expressed as
| (A22) |
where and (in the best case still allowed by the high-frequency radio data, % and ).
The number of photons with energies detected from the Coma cluster with GLAST is
| (A23) |
More photons are detected at lower energies, but this expression is only valid above the bump, which is found at a few hundred MeV in a representation.
The best detection significance is found by assuming that the emission from Coma is point-like, which holds until the point-spread function of GLAST is smaller than the angular extent of Coma. The Coma C radio source has an angular extent of [29], which is comparable to the psf of GeV photons. The detection significance for Coma is found to be
| (A24) |
These two expressions show that Coma will be significantly detected with GLAST if the energy injected in nonthermal hadrons is the energy in nonthermal electrons (or if there is significant energy in nonthermal protons left over from previous merger events). The number of detected photons, which may be as large as a few hundred, would permit spectral analysis to determine if the spectrum is consistent with a photon spectral index at GeV energies. If the nonthermal hadron energy content has been overestimated, however, it remains possible that that GLAST will only weakly detect the Coma cluster of galaxies.
References
- Arnaud et al. [2001] Arnaud, M., et al. 2001, A&A, 365, L67
- Atoyan & Völk [2000] Atoyan, A. M. & Völk, H. J. 2000, ApJ, 535, 45
- Baring et al. [1999] Baring, M. G., Ellison, D. C., Reynolds, S. P., Grenier, I. A., & Goret, P. 1999, ApJ, 513, 311
- Berezinsky et al. [1997] Berezinsky, V. S., Blasi, P., & Ptuskin, V. S. 1997, ApJ, 487, 529
- BD [2003] Berrington, R. C. & Dermer, C. D. 2003, ApJ, 594, 709 (BD03)
- Biviano et al. [1996] Biviano, A., Durret, F., Gerbal, D., Le Fevre, O., Lobo, C., Mazure, A., & Slezak, E. 1996, A&A, 311, 95
- Biviano [1998] Biviano, A. 1998, in Untangling Coma Berenices, eds. A. Mazure, et al., World Scientific, p. 1 (astro-ph/9711251)
- Blasi [2001] Blasi, P. 2001, Astroparticle Physics, 15, 223
- Blasi & Colafrancesco [1999] Blasi, P. & Colafrancesco, S. 1999, Astroparticle Physics, 12, 169
- Buote [2001] Buote, D. A. 2001, ApJ, 553, L15
- Briel et al. [2001] Briel, U. G., et al. 2001, A&A, 365, L60
- Brunetti et al. [2001] Brunetti, G., Setti, G., Feretti, L., & Giovannini, G. 2001, MNRAS, 320, 365
- Brunetti et al. [2004] Brunetti, G., Blasi, P., Cassano, R., & Gabici, S. 2004, MNRAS, 350, 1174
- Cassano & Brunetti [2005] Cassano, R., & Brunetti, G. 2005, MNRAS, 357, 1313
- Cavaliere & Fusco-Femiano [1976] Cavaliere, A., & Fusco-Femiano, R. 1976, A&A, 49, 137
- Colafrancesco [2002] Colafrancesco, S. 2002, A&A, 396, 31
- Colless & Dunn [1996] Colless, M. & Dunn, A. M. 1996, ApJ, 458, 435
- Dennison [1980] Dennison, B. 1980, ApJ, 239, L93
- Dermer & Rephaeli [1988] Dermer, C. D., & Rephaeli, Y. 1988, ApJ, 329, 687
- Donnelly et al. [1999] Donnelly, R. H., Markevitch, M., Forman, W., Jones, C., Churazov, E., & Gilfanov, M. 1999, ApJ, 513, 690
- Edwards et al. [2002] Edwards, S. A., Colless, M., Bridges, T. J., Carter, D., Mobasher, B., & Poggianti, B. M. 2002, ApJ, 567, 178
- Enßlin et al. [1998] Enßlin, T. A., Biermann, P. L., Klein, U., & Kohle, S. 1998, A&A, 332, 395
- Enßlin & Gopal-Krishna [2001] Enßlin, T. A. & Gopal-Krishna 2001, A&A, 366, 26
- Ettori, De Grandi, & Molendi [2002] Ettori, S., De Grandi, S., & Molendi, S. 2002, A&A, 391, 841
- Fujita & Sarazin [2001] Fujita, Y. & Sarazin, C. L. 2001, ApJ, 563, 660
- Fusco-Femiano et al. [2004] Fusco-Femiano, R., Orlandini, M., Brunetti, G., Feretti, L., Giovannini, G., Grandi, P., & Setti, G. 2004, ApJ, 602, L73
- Gabici & Blasi [2004] Gabici, S. & Blasi, P. 2004, Astroparticle Physics, 20, 579
- Gabici & Blasi [2003] Gabici, S. & Blasi, P. 2003, ApJ, 583, 695
- Giovannini et al. [1993] Giovannini, G., Feretti, L., Venturi, T., Kim, K.-T., & Kronberg, P. P. 1993, ApJ, 406, 399
- Govoni et al. [2004] Govoni, F., Markevitch, M., Vikhlinin, A., VanSpeybroeck, L., Feretti, L., & Giovannini, G. 2004, ApJ, 605, 695
- Honda et al. [1996] Honda, H., et al. 1996, ApJ, 473, L71
- Kawasaki & Totani [2002] Kawasaki, W. & Totani, T. 2002, ApJ, 576, 679
- King [1962] King, I. 1962, AJ, 67, 471
- Markevitch et al. [2005] Markevitch, M., Govoni, F., Brunetti, G., & Jerius, D. 2005, ApJ, 627, 733
- Miniati [2003] Miniati, F. 2003, ApJ, 342, 1009
- Miniati et al. [2001] Miniati, F., Jones, T. W., Kang, H., & Ryu, D. 2001, ApJ, 562, 233
- Mohr, Mathiesen, & Evrard [1999] Mohr, J. J., Mathiesen, B., & Evrard, A. E. 1999, ApJ, 517, 627
- Navarro, Frenk, & White [1997] Navarro, J. F., Frenk, C. S., & White, S. D. M. 1997, ApJ, 490, 493
- Neumann et al. [2001] Neumann, D. M., et al. 2001, A&A, 365, L74
- Nevalainen et al. [2004] Nevalainen, J., Oosterbroek, T., Bonamente, M., & Colafrancesco, S. 2004, ApJ, 608, 166
- Petrosian [2001] Petrosian, V. 2001, ApJ, 557, 560
- Reimer et al. [2004] Reimer, A., Reimer, O., Schlickeiser, R., & Iyudin, A. 2004, A&A, 424, 773
- Reimer et al. [2003] Reimer, O., Pohl, M., Sreekumar, P., & Mattox, J. R. 2003, ApJ, 588, 155
- Rephaeli, Ulmer, & Gruber [1994] Rephaeli, Y., Ulmer, M., & Gruber, D. 1994, ApJ, 429, 554
- Rephaeli & Gruber [2002] Rephaeli, Y., & Gruber, D. 2002, ApJ, 579, 587
- Ricker [1998] Ricker, P. M. 1998, ApJ, 496, 670
- Ricker & Sarazin [2001] Ricker, P. M. & Sarazin, C. L. 2001, ApJ, 561, 621
- Roettiger, Burns, & Stone [1999] Roettiger, K., Burns, J. O., & Stone, J. M. 1999, ApJ, 518, 603
- Rossetti & Molendi [2004] Rossetti, M., & Molendi, S. 2004, A&A, 414, L41
- Sakelliou & Ponman [2004] Sakelliou, I., & Ponman, T. J. 2004, MNRAS, 351, 1439
- Salvador-Sole, Solanes, & Manrique [1998] Salvador-Sole, E., Solanes, J. M., & Manrique, A. 1998, ApJ, 499, 542
- Sarazin [1988] Sarazin, C. L. 1988, X-ray Emission from Clusters of Galaxies (Cambridge Univ. Press: New York)
- Sarazin [1999] Sarazin, C. L. 1999, ApJ, 520, 529
- Sarazin & Kempner [2000] Sarazin, C. L., & Kempner, J. C. 2000, ApJ, 533, 73
- Scharf & Mukherjee [2002] Scharf, C. A., & Mukherjee, R. 2002, ApJ, 580, 154
- Schechter [1976] Schechter, P. 1976, ApJ, 203, 297
- Schlickeiser et al. [1987] Schlickeiser, R., Sievers, A., & Thiemann, H. 1987, A&A, 182, 21
- Schuecker et al. [2004] Schuecker, P., Finoguenov, A., Miniati, F., Böhringer, H., & Briel, U. G. 2004, A&A, 426, 387
- Thierbach, Klein, & Wielebinski [2003] Thierbach, M., Klein, U., & Wielebinski, R. 2003, A&A, 397, 53
- Tribble [1993] Tribble, P. C. 1993, MNRAS, 263, 31
- Vestrand [1987] Vestrand, W. T. 1987, Proc. Int. Cosmic Ray Conf. 1987, OG 3.1-5, 97
- Vikhlinin, Forman, & Jones [1997] Vikhlinin, A., Forman, W., & Jones, C. 1997, ApJ, 474, L7
- Vikhlinin et al. [2001] Vikhlinin, A., Markevitch, M., Forman, W., & Jones, C. 2001, ApJ, 555, L87
- Völk et al. [1996] Völk, H. J., Aharonian, F. A., & Breitschwerdt, D. 1996, SpSciRev., 75, 279.
- Weekes et al. [2002] Weekes, T. C. et al. 2002, Astroparticle Physics, 17, 221
- White, Briel, & Henry [1993] White, S. D. M., Briel, U. G., & Henry, J. P. 1993, MNRAS, 261, L8