Abstract
A full understanding of the origin of the hard X-ray background requires a complete and accurate census of the distant galaxies that produce it. Unfortunately, distant X-ray galaxies tend to be very faint at all wavelengths, which hinders efforts to perform this census. This chapter discusses the insights that can be obtained through comparison of the distant population to local X-ray galaxies, whose properties are well characterized. Such comparisons will ultimately aid investigations into the cosmic evolution of supermassive black holes and their environments.
Distant X-ray Galaxies: Insights
from the Local Population
Distant X-ray Galaxies
1 Introduction
The sensitivities of the Chandra and XMM-Newton X-ray Observatories have made it possible, for the first time, to detect and study typical X-ray galaxies at cosmological distances. As a result, we are now able to conduct direct investigations of the sources that produce the hard ( 2 keV) X-ray background (XRB) radiation, whose origin remains one of the fundamental issues in X-ray astronomy. Research over the past decade has indicated that the majority of the hard XRB must arise from distant black hole powered Active Galactic Nuclei (AGN). Thus, we expect that the XRB—once it is fully resolved and the sources contributing to it are identified—will provide insight into the accretion histories of supermassive black holes and a record of their growth over cosmic time (Barger et al. 2001a). Since the masses of supermassive black holes are linked to the properties of the galactic bulges within which they reside (see Ferrarese, this volume), this record could hold important clues about galaxy evolution in general. One of our key near-term goals, therefore, is to obtain an accurate census of the distant X-ray galaxy population. Unfortunately, the general faintness of this population presents an obstacle. This chapter explores what can be learned about distant X-ray galaxies through comparison to the well-characterized local population.
2 Seyfert 2 Galaxies and the X-ray Background
It now appears that different types of sources produce the majority of the XRB in different X-ray energy bands. In the soft ( keV) band, AGN with broad optical emission lines (i.e., Seyfert 1 galaxies and quasars) are the dominant contributors (Schmidt et al. 1998). These sources, however, have steep X-ray spectra and cannot account for the flat slope of the XRB spectrum at higher energies (e.g., Mushotzky et al. 1980; Nandra & Pounds 1994). Narrow line Seyfert 2 galaxies have thus emerged as the most promising candidates for the origin of the hard ( keV) XRB. According to the unified AGN picture (Antonucci 1993), the soft X-ray fluxes of these sources are heavily absorbed by dense circumnuclear gas, presumably the same material that obscures their broad emission-line regions. As a result, their observed X-ray spectra are substantially flatter than those of unobscured AGN (Awaki et al. 1991). XRB models based on AGN unification have demonstrated that the combined emission of absorbed and unabsorbed sources, integrated over all redshifts, can account for the intensity and spectrum of the hard XRB (Setti & Wolter 1989; Madau, Ghisellini, & Fabian 1993, 1994; Comastri et al. 1995). According to these models, the sources responsible for most of the flux in the hard X-ray band are expected to have absorption column densities in the range , which are typical for Seyfert 2 galaxies (e.g., Risaliti, Maiolino, & Salvati 1999).
The AGN based XRB models depend on a number of assumptions and free parameters that, in principle, can be verified or constrained observationally: (1) the universality of the unified AGN model (i.e., all Seyfert 2 galaxies are obscured Seyfert 1 galaxies), (2) the ratio of obscured to unobscured sources, (3) the distribution and luminosity dependence of the absorption column densities in AGN, and (4) the luminosity extent and redshift evolution of the X-ray luminosity function for obscured AGN.
Although there seems to have been little debate in the X-ray community about the universality of the unified AGN model, optical spectropolarimetry surveys, which can reveal broad emission lines in the polarized flux spectra of Seyfert 2 galaxies, have continued to the present, in part to test the unified model. These surveys have demonstrated that at least 50% of such sources are indeed hidden Seyfert 1 galaxies (Moran et al. 2000, 2001; Lumsden et al. 2001; Tran 2001). Given the generally low polarizations of Seyfert 2 galaxies and other factors that make the spectropolarimetry technique difficult (e.g., Kay 1994), it is probably safe to assume that most Seyfert 2 galaxies (at least those that produce the majority of the luminosity associated with this population) are obscured Seyfert 1 galaxies. Improved constraints on some of the input model parameters, e.g., the column density distribution (Risaliti et al. 1999) and the evolution of the AGN X-ray luminosity function (Miyaji, Hasinger, & Schmidt 2000), have permitted refinements of the AGN model for the XRB (Risaliti et al. 1999; Pompilio, La Franca, & Matt 2000; Gilli, Salvati, & Hasinger 2001).
Concerned about the possible effects of selection biases on the observational inputs to the XRB models, my colleagues and I have adopted a different approach to investigating the contribution of Seyfert 2 galaxies to the hard XRB (Moran et al. 2001). Our study is based on the AGN sample of Ulvestad & Wilson (1989, hereafter UW89), which at the time of its definition included all known Seyfert galaxies with recessional velocities km s-1 and declinations . Because of its distance-limited nature, this sample is free of serious selection biases. Nearly all of the 31 Seyfert 2 galaxies in the sample have been observed in the keV band with the ASCA satellite, which provides us with an opportunity to obtain a clear picture of the hard X-ray properties of these sources. However, while all of the galaxies were detected with ASCA, many have proved to be weak X-ray sources. The data cannot be used, therefore, to measure the average spectral parameters or column density distribution for the sample. Instead, we have combined the X-ray data for the sources in a luminosity-weighted fashion to obtain a composite Seyfert 2 spectrum. The result is displayed in Figure 1.
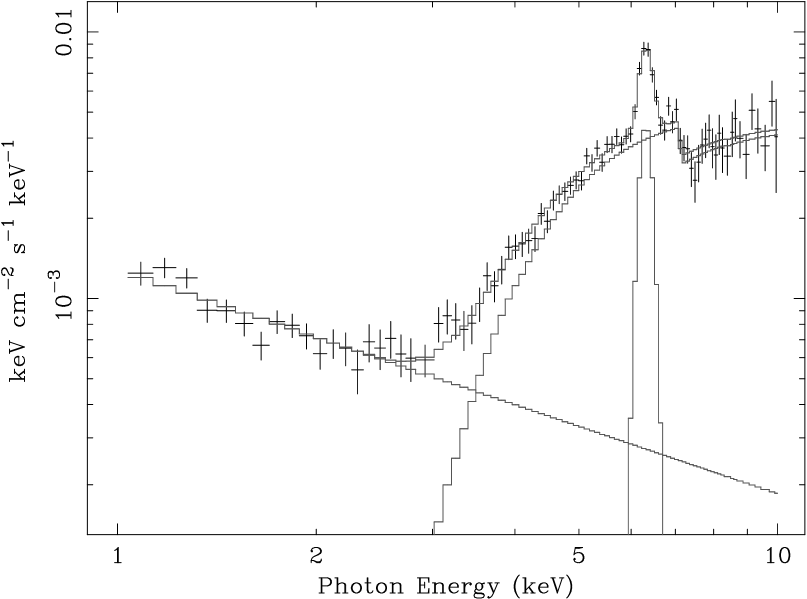
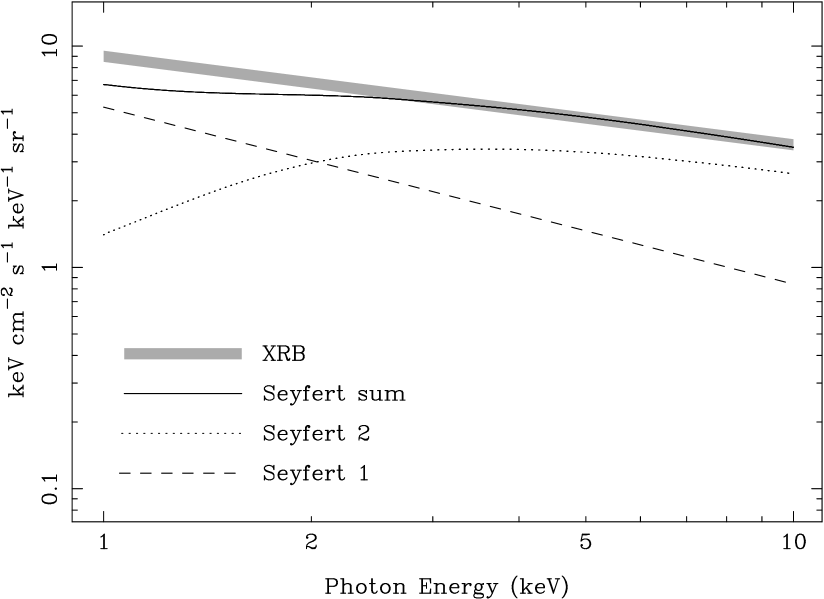
Because the sample from which it is derived is volume-limited, the composite spectrum is effectively a measure of X-ray luminosity density (or volume emissivity) of the local Seyfert 2 population as a function of photon energy. By integrating the luminosity density function over redshift (see Moran et al. 2001), we obtain an estimate of the total X-ray sky brightness (i.e., XRB contribution) associated with Seyfert 2 galaxies. Combining our results with those of the ROSAT Deep Survey (Schmidt et al. 1998), which established that % of the XRB at 1 keV is produced by steep-spectrum type 1 AGN, we find that the combined emission of Seyfert 1 and Seyfert 2 galaxies provides an excellent match to the spectrum and intensity of the XRB in the keV range (see Fig. 2).
Our approach is almost entirely empirical: the only model dependent feature (and, thus, the main uncertainty) concerns the redshift evolution of the AGN X-ray luminosity function (XLF). In our study, we assume the evolution of the Seyfert 2 XLF to be identical to that obtained for type 1 AGN in the soft X-ray band by Miyaji et al. (2000). Updating our calculations with an evolution term derived from Chandra and XMM-Newton data (e.g., Cowie et al. 2003; Steffen et al. 2003; Ueda et al. 2003; Hasinger et al. 2003) might change in detail the XRB estimates we obtain, but the qualitative agreement between our results and AGN models for the XRB would persist: (1) Seyfert 2 galaxies are the only known sources that, as a class, have the X-ray spectral properties needed to explain the shape of the XRB spectrum, and (2) their luminosity density is sufficient to account for the intensity of the hard XRB. In other words, there is very little room for a significant XRB contribution by some new population of X-ray–bright sources.
Locally, the optical spectra of Seyfert 2 galaxies are characterized by strong, narrow emission lines; spectroscopy of the distant sources responsible for most of the hard X-ray flux in deep Chandra images should, therefore, provide a straightforward means of confirming the Seyfert 2 model for the XRB. But a different picture has emerged. Follow-up observations of faint Chandra sources reveal instead a significant population of apparently normal galaxies whose starlight-dominated optical spectra have only weak emission lines, if any (e.g., Mushotzky et al. 2000; Barger et al. 2001a, 2001b, 2002). Many such sources have the X-ray properties of Seyfert 2 galaxies, but they seem to lack the associated optical emission-line signatures. This could be taken as evidence that the optical properties of hard X-ray galaxies have evolved strongly with cosmic time, which would have important implications for the nature of supermassive black holes and their environments at earlier epochs. However, before settling in on this conclusion, it is imperative that we first exhaust all possibility that distant hard X-ray galaxies are, in fact, fundamentally similar to the familiar sources we find locally. Our attempts to do so are described in the next section.
3 Comparing Local Seyfert 2 Galaxies and Distant X-ray Galaxies
3.1 Observational Challenges
Any investigation of the properties of distant X-ray galaxies is naturally done within the context of our understanding of the local population. However, comparisons of nearby and distant sources can be complicated by two important factors. First, samples of local and high-redshift X-ray galaxies are likely to be defined in very different ways. Nearby X-ray galaxy samples can be assembled on the basis of a wide variety of criteria, including (but not limited to) X-ray brightness, strength of their emission in some other region of the spectrum (e.g., the infrared), optical emission-line properties, or distance from the Milky Way. Distant X-ray galaxies are usually identified on the basis of a sole property: detection as an X-ray source. Thus, nearby and distant samples may contain inherently different types of X-ray galaxies and/or similar galaxies drawn from very different portions of the XLF.
As a second complicating factor, the quality of data typically available for nearby and distant X-ray galaxies differs vastly. Because of their proximity, the properties of nearby sources are often well characterized over a range of wavelengths. For example, data for local active galaxies might include detailed broadband X-ray spectra, high signal-to-noise ratio (S/N) optical spectra of their nuclei, and robust detections in the radio, infrared, and ultraviolet bands. In contrast, faint X-ray galaxies at moderate redshifts might be characterized by the detection of a few tens of X-ray photons and low S/N or low resolution integrated optical spectra (or no spectra at all—optical photometry in a few bands may be all that is available); they are often unobserved or undetected at all other wavelengths. Obviously, comparisons of sources with essentially incomparable data must be carried out with great care.
3.2 X-ray–to–Optical Flux Ratios of the Nearby and Distant Populations
Distant, hard X-ray galaxies tend to be faint at all wavelengths, which limits the amount and quality of information we have about their properties. For example, over half of the X-ray sources detected in the 2 Ms Chandra Deep Field-North (CDF-N; Alexander et al. 2003; Barger et al. 2003) have optical counterparts that are fainter than . Clearly, high-quality optical spectra can only be obtained for the small fraction of relatively bright sources included in that survey. However, broadband magnitudes and colors have been measured for nearly all of the CDF-N sources. One of the best observational handles we have on the nature of distant X-ray galaxies, therefore, is their X-ray–to–optical flux ratios, . The ratio broadly discriminates between various classes of celestial X-ray sources (e.g., Stocke et al. 1991); in particular, between luminous AGN and “normal” (i.e., quiescent or non-active) galaxies. Thus, one way to explore the nature of the optically-normal hard X-ray galaxies that are turning up in deep X-ray surveys would be to compare their ratios to those of local X-ray galaxies with similar high-energy properties. The results of such a comparison, carried out by Moran & Cardamone (2004), are summarized here.
To ensure that our flux ratio comparison is valid, we require an appropriate sample of distant X-ray galaxies from a well-characterized deep survey, and an unbiased sample of nearby sources with broadband X-ray and optical data. For the distant X-ray galaxy sample, the 2 Ms CDF-N is an ideal resource. The details of the Chandra observations and parameters of the detected sources are thoroughly documented (Alexander et al. 2003), and deep optical imaging and spectroscopy of the sources have been obtained with the Subaru 8 m and Keck 10 m telescopes (Barger et al. 2002, 2003). From the CDF-N, we select only sources with total exposure times between 1.5 Ms and 2.0 Ms; this range brackets the strong peak in the CDF-N source exposure time distribution centered at 1.7 Ms (Alexander et al. 2003), and because it is narrow, it allows us to establish an effective X-ray flux limit and solid angle for this portion of the deep survey.
Next, since we are chiefly concerned with the origin of the XRB, we select CDF-N sources with keV hard-band detections and flattened X-ray spectra with effective photon indices (as indicated by their “hardness ratios”). These are the sources responsible for the hard XRB, and based on observations of nearby sources, they are expected to be Seyfert 2 galaxies. Finally, we require that the included sources have a measured spectroscopic redshift. About 60 CDF-N sources satisfy all of these criteria. Using published keV fluxes and -band magnitudes, we have computed the observed-frame flux ratios for these sources.

The local Seyfert 2 galaxies for our study are again selected from the distance-limited sample defined by UW89. As mentioned above, broadband X-ray observations of these sources are nearly complete, and because of their proximity, optical photometric data for the galaxies are available in the literature. About two-thirds of the sources have integrated magnitudes from the Third Reference Catalog of Bright Galaxies (RC3; de Vaucouleurs et al. 1991). Their colors are displayed in Figure 3, along with an indication of the typical colors of various types of galaxies. As the figure illustrates, the host galaxies of nearby Seyfert 2 galaxies have the colors of early-type spirals—consistent with the morphological classifications of the UW89 sources, which are predominantly Sa, S0/a, or S0. Interestingly, the distant, “normal” X-ray galaxies detected in deep Chandra images tend to have red colors and early-type optical spectra.
Since the ratio is measured in the observed frame, its value depends to some degree on the redshift of an object. This redshift dependence, combined with differences in the ways samples of nearby and distant sources are assembled, makes a direct comparison of their flux ratio distributions impossible. We return to this point below. The proper approach, therefore, involves a determination of the flux ratios that the nearby sources would have if they were observed under the same conditions as the CDF-N sources, and with the same redshift distribution as the CDF-N sources selected above.

We use Monte Carlo methods to simulate the distribution of the local Seyfert 2 galaxies, randomly selecting a redshift (weighted by the CDF-N redshift distribution) and a UW89 galaxy (unweighted, since to first order the UW89 sample is the local Seyfert 2 luminosity function). We begin by using the ASCA data to calculate the observed-frame keV flux of the selected galaxy, verifying that it would exceed the CDF-N flux limit. Next, we determine the likelihood that a UW89 galaxy of a particular luminosity would be included in the CDF-N. For this test, we have combined the CDF-N flux limit and survey solid angle to estimate the volume searched in the CDF-N as a function of minimum detectable hard X-ray luminosity . The results are plotted in Figure 4, along with the (constant) volume covered by the UW89 sample. Below a keV luminosity of ergs s-1, the volume searched in the CDF-N is less than that of the UW89 sample. Therefore, in this range, the ratio of the CDF-N volume to the UW89 volume defines the probability that a local object of a given luminosity would be detected in the CDF-N. If a galaxy passes all tests, its magnitudes are used to obtain its observed-frame -band flux, from which its ratio is calculated.
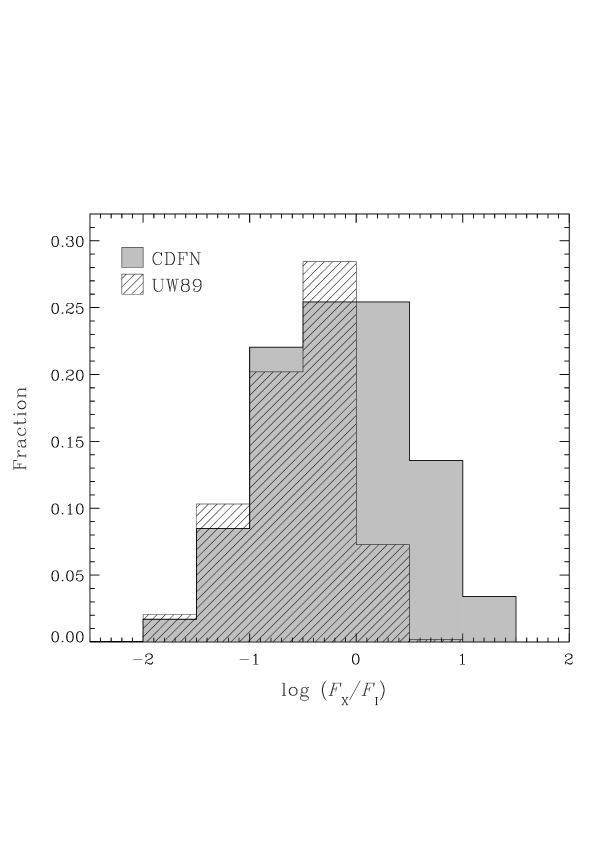
In Figure 5, we compare the distribution of the hard XRB producing CDF-N sources to the simulated flux ratio distribution that the UW89 Seyfert 2 galaxies would have if they were observed in the CDF-N. Below , the two distributions match closely—I would argue that the minor differences present are mainly due to the discreteness of the UW89 sample. However, at the higher values of , only CDF-N sources are present. Is this an indication of some fundamental difference between the nearby and distant populations?

Some clarification is provided by Figure 6, where is plotted as a function of hard X-ray luminosity . The observed correlation between these two quantities suggests that the dispersion in the optical fluxes of the galaxies is not too great. Below ergs s-1, the CDF-N points and the UW89 points from the simulation overlap quite nicely. Note that high values of , where UW89 points are absent, correspond to high values of . Referring once more to Figure 4, the volume searched in the CDF-N for high sources vastly exceeds that covered by the UW89 sample. Thus, the apparent differences in the distributions are likely to be the result of Malmquist effects: the volume associated with the UW89 sample is too small to include rare, high-luminosity sources, which are over-represented in the CDF-N, because of the large volume it surveys for such sources. We conclude, therefore, that the distributions of distant, flat spectrum X-ray galaxies and nearby Seyfert 2 galaxies do not differ appreciably, at least for sources with observed hard X-ray luminosities below a few times ergs s-1. If the Malmquist effects described above are present—and to some extent they must be—this conclusion may be valid over all values of .

This exercise has lead to some interesting insights into the way source redshifts and the flux-limited nature of deep surveys combine to influence the Seyfert 2 distribution. For Seyfert 2 galaxies, the redshift dependence of the X-ray–to–optical flux ratio is quite strong. Plotted in Figure 7 is the integrated optical spectrum of NGC 788, one of the more luminous X-ray sources in the UW89 sample. The broadband X-ray spectrum of NGC 788 is very similar to the composite Seyfert 2 spectrum displayed in Figure 1. As photon energy (or frequency) increases, the X-ray spectrum of NGC 788 rises, and its optical spectrum declines. Thus, the observed-frame ratio of this source must increase with redshift.

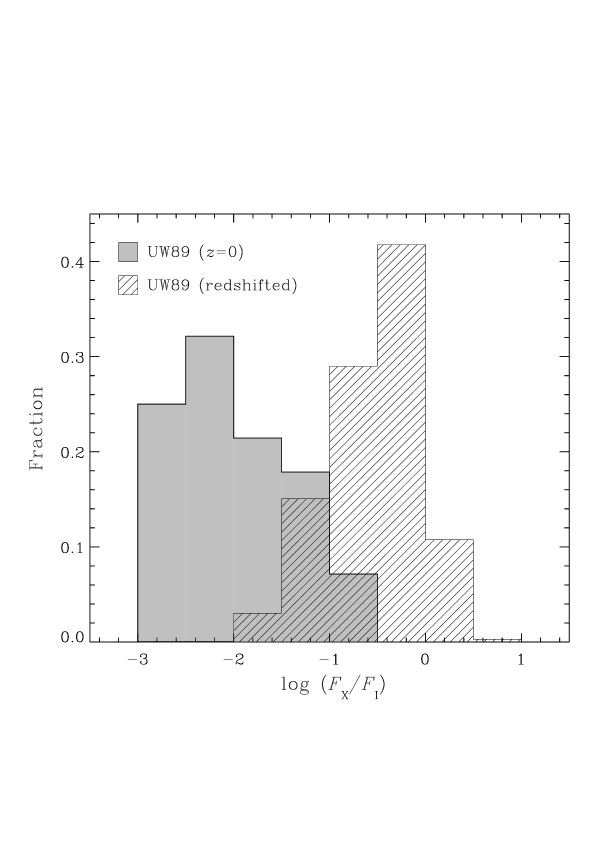
In Figure 8, we plot X-ray and optical fluxes and their ratio versus redshift for four UW89 Seyfert 2 galaxies that span a wide range of intrinsic (i.e., ) values of . At , their observed-frame X-ray–to–optical flux ratios are increased by factors of 15 to 30. Combined with the effects associated with the flux-limited nature of the CDF-N (i.e., the suppression of the faint end of the Seyfert 2 XLF, and the over-representation of sources at the bright end), redshift effects cause a dramatic transformation of the distribution of for Seyfert 2 galaxies, as illustrated in Figure 9.
3.3 Integrated Spectra of Seyfert 2 Galaxies
If a careful comparison of the ratios of nearby Seyfert 2 galaxies and distant hard X-ray galaxies fails to reveal significant differences between the two populations, why do their optical spectra differ? One possibility is that AGN in the past tend to be even more obscured than Seyfert 2 galaxies. If so, they might exhibit none of the optical properties displayed by nearly all local X-ray luminous AGN. As an alternative to the strong AGN evolution implied in this scenario, we propose that the optical results of the deep Chandra surveys may instead be heavily influenced by the limitations of ground-based observing.
In spectroscopic observations of nearby AGN, light is collected through a small aperture centered on the nucleus, which excludes most of the starlight from the host galaxy. The faint sources that produce the hard XRB, in contrast, are typically so distant that when they are observed, the entire galaxy (or a large fraction of it) falls within the spectrograph slit. (At , 10 kpc corresponds to 15.) Combined with the low spectral resolution that has been employed to date ( Å) and the modest signal-to-noise ratios frequently obtained (because the optical counterparts are so faint), the additional galaxy light from stars and H ii regions could lead to the appearance that some distant Chandra sources are associated with normal galaxies rather than with Seyfert 2 galaxies.
To investigate this possibility, we have obtained integrated spectra of 18 nearby Seyfert 2 galaxies that are known to be absorbed X-ray sources (Moran, Filippenko, & Chornock 2002). The sources for this work were again selected from the UW89 sample. Our techniques simulate spectroscopic observations of distant X-ray galaxies with Keck, which allow us to evaluate whether the emission-line signatures of their activity can be overwhelmed (or “hidden”) in the spectra of their integrated light. The results are striking: as Figure 10 shows, the nuclear emission lines of many sources are almost completely washed out in the integrated spectra. As with most of the normal looking Chandra sources, weak emission lines are present in three of the integrated spectra in Figure 10, but the strongest features are the Ca ii, G band, Mg i, and Na i D stellar absorption lines typically observed in the spectra of inactive early-type galaxies. Emission lines are quite strong in the integrated spectrum of the fourth object (Fig. 10), but the line-intensity ratios—similar to the values observed in H ii regions—are drastically different than those observed in the nucleus. At a modest redshift, this object would be classified as a starburst galaxy!

About 60% of the 18 nearby sources we observed would not be classified as AGN on the basis of their integrated spectra. We conclude that it is possible to hide the true nature of a significant fraction of distant type 2 AGN in their integrated optical spectra. Spectral coverage issues may affect the deep survey results as well. The classifications of some of the persistent Seyfert 2 galaxies in our sample would be ambiguous without information about the emission lines near H. Because of their high redshifts, many CDF-N galaxies have spectra that do not cover the H region. Thus, the combined limitations of ground-based observations—not some sort of evolutionary effects—may be largely responsible for the current demographics of the distant hard X-ray galaxy population.
4 Summary and Future Work
Spectroscopic studies of faint X-ray sources in deep Chandra images have apparently uncovered a significant population of distant, optically-normal galaxies. These sources have X-ray properties similar to those of nearby Seyfert 2 galaxies, but they seem to lack the strong optical emission lines that characterize the latter. This suggests that the X-ray galaxy population has perhaps undergone significant optical evolution, which has stimulated efforts to improve our understanding of X-ray–bright, optically-normal galaxies (e.g., Comastri et al. 2002) and searches for examples of them in the local universe (Maiolino et al. 2003).
While the prospect of strong evolution of the X-ray galaxy population is tantalizing, it is important to explore the possibility that the faint, distant sources responsible for most of the hard XRB are, in fact, optically similar to Seyfert 2 galaxies. Ground-based optical spectra of deep survey sources include not only the nuclear emission we wish to relate to their X-ray properties, but the majority of the light from stars and H ii regions in the host galaxies, as well. In some cases, the extranuclear host galaxy light might overwhelm the nuclear emission, giving the appearance that an absorbed AGN is an inactive galaxy.
To test this hypothesis, we have obtained integrated optical spectra of nearby Seyfert 2 galaxies. We find that about 60% of such sources lack clear signs of nuclear activity in the spectra of their integrated light. Moreover, the observed-frame X-ray–to–optical flux ratios of distant hard X-ray galaxies, and those that nearby Seyfert 2 galaxies would have if they were observed in an identical manner, are very similar. Thus, there is insufficient evidence at this time to support a conclusion that distant hard X-ray galaxies differ significantly from nearby Seyfert 2 galaxies.
Of course, the tests presented here are indirect, and they do not rule out all possibility that distant hard X-ray galaxies have evolved. High angular resolution optical spectroscopy, isolating the nuclei of such sources, would help to settle the evolution/starlight dilution debate directly. My colleagues and I are preparing to do just that—we have an approved Hubble Space Telescope program to obtain spectra of four sources with the Space Telescope Imaging Spectrograph (STIS). The targets to be observed have normal looking ground-based optical spectra, but hard X-ray luminosities in excess of ergs s-1, too high to be associated with truly normal galaxies. The redshifts of the sources are in the range, so spectra of their nuclei with the 01 or 02 STIS slits will exclude the vast majority of the emission from the host galaxy. The results of the observations will provide much needed clarification of the properties of distant hard X-ray galaxies and, thus, valuable insight into the nature of the supermassive black holes they contain.
Acknowledgements.
I am grateful to John Salzer for insightful discussions about Malmquist effects in flux-limited surveys, and to Carolin Cardamone for assistance with many of the calculations and figures presented here.References
- [1] Alexander, D. M., et al. 2003, AJ, 126, 539
- [2] Antonucci, R. 1993, ARA&A, 31, 473
- [3] Awaki, H., Koyama, K., Inoue, H., & Halpern, J. P. 1991, PASJ, 43, 195
- [4] Barger, A. J., Cowie, L. L., Bautz, M. W., Brandt, W. N., Garmire, G. P., Hornschemeier, A. E., Ivison, R. J., & Owen, F. N. 2001a, AJ, 122, 2177
- [5] Barger, A. J., Cowie, L. L., Mushotzky, R. F., & Richards, E. A. 2001b, AJ, 121, 662
- [6] Barger, A. J., Cowie, L. L., Brandt, W. N., Capak, P., Garmire, G. P., Hornschemeier, A. E., Steffen, A. T., & Wehner, E. H. 2002, AJ, 124, 1839
- [7] Barger, A. J., et al. 2003, AJ, 126, 632
- [8] Comastri, A., Setti, G., Zamorani, G. & Hasinger, G. 1995, A&A, 296, 1
- [9] Comastri, A., et al. 2002, ApJ, 571, 771
- [10] Cowie, L. L., Barger, A. J., Bautz, M. W., Brandt, W. N., & Garmire, G. P. 2003, ApJ, 584, L57
- [11] Cox, A. N. 2000, Allen’s Astrophysical Quantities. (New York: Springer-Verlag), p577
- [12] de Vaucouleurs, G., de Vaucouleurs, A., Corwin, H. G., Jr., Buta, R. J., Paturel, G., & Fouqué, P. 1991, Third Reference Catalog of Bright Galaxies. (New York: Springer-Verglag)
- [13] Gendreau, K. C., et al. 1995, PASJ, 47, L5
- [14] Gilli, R., Salvati, M., & Hasinger, G. 2001, A&A, 366, 407
- [15] Hasinger, G. 2003, in “The Emergence of Cosmic Structure”, Eds. S. S. Holt, & C. Reynolds. (Melville, New York: AIP Conference Proceedings), 666, p227
- [16] Kay, L. E. 1994, ApJ, 430, 196
- [17] Lumsden, S. L., Heisler, C. A., Bailey, J. A., Hough, J. H., & Young, S. 2001, MNRAS, 327, 459
- [18] Madau, P., Ghisellini, G., & Fabian, A. C. 1993, ApJ, 410, L7
- [19] Madau, P., Ghisellini, G., & Fabian, A. C. 1994, MNRAS, 270, L17
- [20] Maiolino, R., et al. 2003, MNRAS, 344, L59
- [21] Miyaji, T., Hasinger, G., & Schmidt, M. 2000, A&A, 353, 25
- [22] Moran, E. C., Barth, A. J., Kay, L. E., & Filippenko, A. V. 2000, ApJ, 540, L73
- [23] Moran, E. C., & Cardamone, C. N. 2004, ApJ, submitted
- [24] Moran, E. C., Filippenko, A. V., & Chornock, R. 2002, ApJ, 579, L71
- [25] Moran, E. C., Kay, L. E., Davis, M., Filippenko, A. V., & Barth, A. J. 2001, ApJ, 556, L75
- [26] Mushotzky, R. F., Cowie, L. L., Barger, A. J., & Arnaud, K. A. 2000, Nature, 404, 459
- [27] Mushotzky, R. F., Marshall, F. E., Boldt, E. A., Holt, S. S., & Serlemitsos, P. J. 1980, ApJ, 235, 377
- [28] Nandra, K., & Pounds, K. A. 1994, MNRAS, 268, 405
- [29] Pompilio, F., La Franca, F., & Matt, G. 2000, A&A, 353, 440
- [30] Risaliti, G., Maiolino, R., & Salvati, M. 1999, ApJ, 522, 157
- [31] Schmidt, M., et al. 1998, A&A, 329, 495
- [32] Setti, G., & Woltjer, L. 1989, A&A, 224, L21
- [33] Steffen, A. T., Barger, A. J., Cowie, L. L., Mushotzky, R. F., & Yang, Y. 2003, ApJ, 596, L23
- [34] Stocke, J. T., et al. 1991, ApJS, 76, 813
- [35] Tran, H. D. 2001, ApJ, 554, L19
- [36] Ueda, Y., Akiyama, M., Ohta, K., & Miyaji, T. 2003, ApJ, 598, 886
- [37] Ulvestad, J. S., & Wilson, A. S. 1989, ApJ, 343, 659