Intra-day Variation of Sagittarius A∗ at Short Millimeter Wavelengths
Abstract
We have performed the monitoring observations of flux density of Sagittarius A∗ at short millimeter wavelengths (100 and 140 GHz bands) on seven years in the period from 1996 to 2003 using the Nobeyama Millimeter Array (NMA). We found intra-day variation of Sgr A∗ in March 2000 flare. The flux density at the peak of the flares increases 100–200% at 100 GHz and 200–400% at 140 GHz (), respectively. The two-fold increase timescale of the flare is estimated to be about 1.5 hours at 140 GHz. The intra-day variation at mm-wavelengths has similar increase timescale as those in the X-ray and infrared flares but has smaller amplitude. This short timescale variability suggests that the physical size of the emitting region is smaller than 12 AU (). The decay timescale of the flare was at most 24 hours. Such a light curve with rapid increase and slow decay is similar to that often observed in outburst phenomena with ejections.
1 Introduction
Sagittarius A∗ (Sgr A∗) is the compact radio source which is located at the dynamical center of our galaxy and believed to be associated with the supermassive black hole of a mass of about (e.g., Ghez et al. 2003; Schödel et al. 2002, 2003). Because this source is embedded in thick thermal material, it is practically difficult to observe its fine structures by the present VLBI (very long baseline interferometry) (Doeleman et al. 2001; however, see also Bower et al. 2004, the recent detection of the intrinsic size of Sgr A∗ using VLBI technique). Time variability observation is a powerful and alternate tool to probe the structure and the emission mechanism of Sgr A∗. If the time variability is intrinsic in the source, it should be tightly related to the structure and the emission mechanism of the emitting region. If the origin is not intrinsic, the observation should at least provide the information about thermal materials around Sgr A∗.
The time variability of Sgr A∗ at cm-wavelengths has been studied in these two decades (Brown & Lo, 1982; Zhao et al., 2001). The variability at short cm-wavelengths seems to have a periodicity of about 106 days (Zhao et al., 2001). It is, however, an open question what causes the 106-days cycle. On the other hand, the variability at millimeter wavelengths has not been well observed although it believed to be caused by the activity of Sgr A∗ itself. Earlier, Wright & Backer (1993) reported that there were significant flux variations of Sgr A∗ at 86 GHz in several tens of days. The extractable information from such observations has been limited because of sparse observation intervals. Thus we performed the systematic flux monitor of Sgr A∗ at 100 and 140 GHz bands in winter seasons of 1996, 1997, and 1998 using Nobeyama Millimeter Array (NMA) which is a six 10-m dish element interferometer at the Nobeyama Radio Observatory (Miyazaki et al., 1999; Tsuboi et al., 1999). The flux density of Sgr A∗ was measured every several days for two months. In these monitor observations we found a flare of Sgr A∗ and showed that the timescale of the flare is at most a several days (Miyazaki et al., 1999; Tsuboi et al., 1999). The variability amplitudes at mm-wavelengths are larger than those at cm-wavelengths. Similar flares of Sgr A∗ have also been detected at 1 mm wavelength (Zhao et al., 2003). On the other hand, X-ray flares of Sgr A∗ were recently detected by Chandra (Baganoff et al., 2001) and XMM Newton (Porquet et al., 2003; Goldwurm et al., 2003) observations. For example, the flare detected by Porquet et al. (2003) is rising in a few ks and with a peak luminosity 160 times higher than the quiescent state. The short timescale of these flares shows that the emission arises from the region quite close to the Sgr A∗. Recently, infrared flares were also detected (Ghez et al., 2004; Genzel et al., 2003). The flare detected at at H, KS, and L′-bands has a factor of about 2–4 variability on timescale of several tens of minute (Genzel et al., 2003). The infrared flares are similar to the X-ray flares in the duration, rise/decay times and band luminosities (Genzel et al., 2003). The apparent correlations between radio and X-ray flares (Zhao et al., 2004), between infrared and X-ray flares (Eckart et al., 2004), and between radio, infrared, and X-ray flares (Baganoff et al., 2002) were also reported. The relations among X-ray, infrared, and radio flares should be important for probing the emission mechanism of Sgr A∗.
We have conducted intensity monitoring observations toward Sgr A∗ at short mm-wavelengths using NMA. In this paper, we will concentrate on intra-day variation of Sgr A∗. The long time variability will be presented in another paper. In §2, we present the detail of observations and calibrations. In §3, we present the results of monitoring observations and discuss the properties of flares. In this paper, we assume that the Galactic center distance is 8.0 kpc (Reid, 1993).
2 Observations and Calibrations
We have performed intensity monitoring observations toward Sgr A∗ at 100 and 140 GHz band (=3 and 2 mm) using the NMA since 1996 (also see Tsuboi et al. 1999; Miyazaki et al. 2003). The observations were carried out over winter to spring. Each epoch consists of a set of sequent observations of 2–3 days. The epochs of the observations in 2000 were separated by about 5 days. The observational dates in March 2000 are summarized in Table 1. The observing time for each day was 2–3 hr. The maximum observable time of Sgr A∗ with NMA is 4 hr.
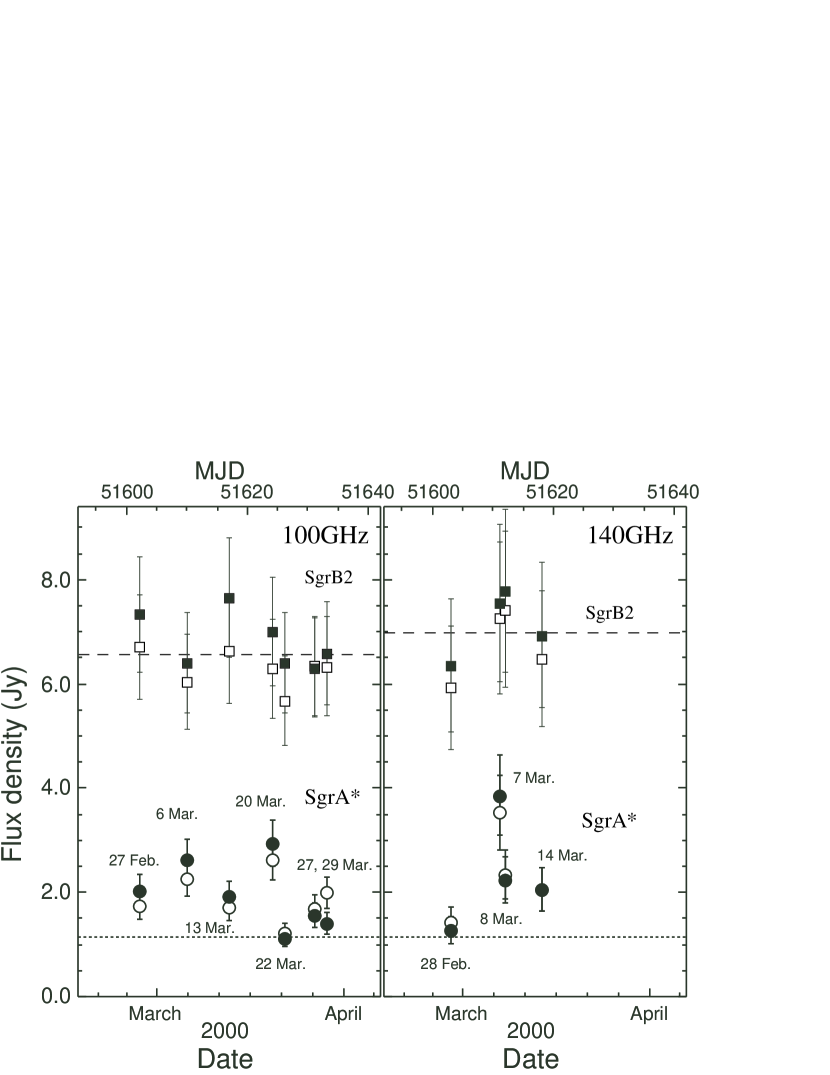
Sgr A∗ was simultaneously observed in two frequencies, either at 90 and 102 GHz or 134 and 146 GHz using both lower and upper side bands each with a bandwidth of 1 GHz (Okumura et al., 2000). We observed NRAO 530 and 1830-210 every 20 minutes as phase calibrators. The flux densities of these calibrators are determined from Uranus or Neptune which were used as the primary flux calibrators. The absolute uncertainties of the flux scaling, which are mainly caused by phase instability and signal-to-noise of phase calibrators, are about 15% and 20% at 100 and 140 GHz bands, respectively. The flux densities of NRAO 530 and 1830-210 at March 2000 were 2.4 Jy and 2.5 Jy for 100 GHz band, and 1.8 Jy and 1.9 Jy for 140 GHz band, respectively. To correct instrumental and atmospheric effects, the time-dependent phase and amplitude gains were determined from the phase calibrators using the standard NMA data reduction package UVPROC2 (Tsutsumi, Morita, & Umeyama, 1997). The elevation dependence of atmosphere absorption is calibrated by system temperature. To check the validity of flux calibration, Sgr B2(M) [R.A., Decl. (B1950.0)] was also included in the same track as the synthesis observations of Sgr A∗ and its flux density was determined using the same flux scale as in the case of Sgr A∗. The flux densities of Sgr B2(M) is not variable because this is a compact H II region. Figure 1 shows the peak flux density of Sgr B2(M) in March 2000 (squares). The measured mean flux densities (horizontal dashed line) are 6.6 Jy at 100 GHz band and 7.0 Jy at 140GHz band, respectively. The scatter of the flux densities shows the absolute uncertainties.
Almost all observations including the detections of flares of Sgr A∗ were performed by the array configuration with intermediate baselines of the NMA. The projected baselines range 7-55 k at 100 GHz band and 10-77 k at 140 GHz band. The visibilities with projected baselines over 25 kilo-wavelengths () are used in order to suppress the contamination from the extended components surrounding Sgr A∗. We CLEANed the maps with the restricted visibilities using the AIPS package. Typical synthesized beam sizes (HPBW) were about and at 100 and 140 GHz bands, respectively. The observed flux density is reduced by the phase error due to atmospheric phase fluctuation of timescales less than the scan interval of the phase calibrators. From the flux densities of the calibrator measured on the maps, the fractions of the decorrelation are 10–20% for 100 GHz band and 20–40% for 140 GHz band. In order to correct the decorrelation, the observed flux densities of Sgr A∗ were divided by the correction factors, 0.8–0.9 for 100 GHz band and 0.6–0.8 for 140 GHz band, respectively. We averaged two measured flux densities of Sgr A∗ which were individually calibrated by the two phase calibrators. After this calibration process, the residual contribution from the extended components in the flux measurements is smaller than 0.2 Jy and 0.1 Jy at 100 and 140 GHz band, respectively.
3 Results
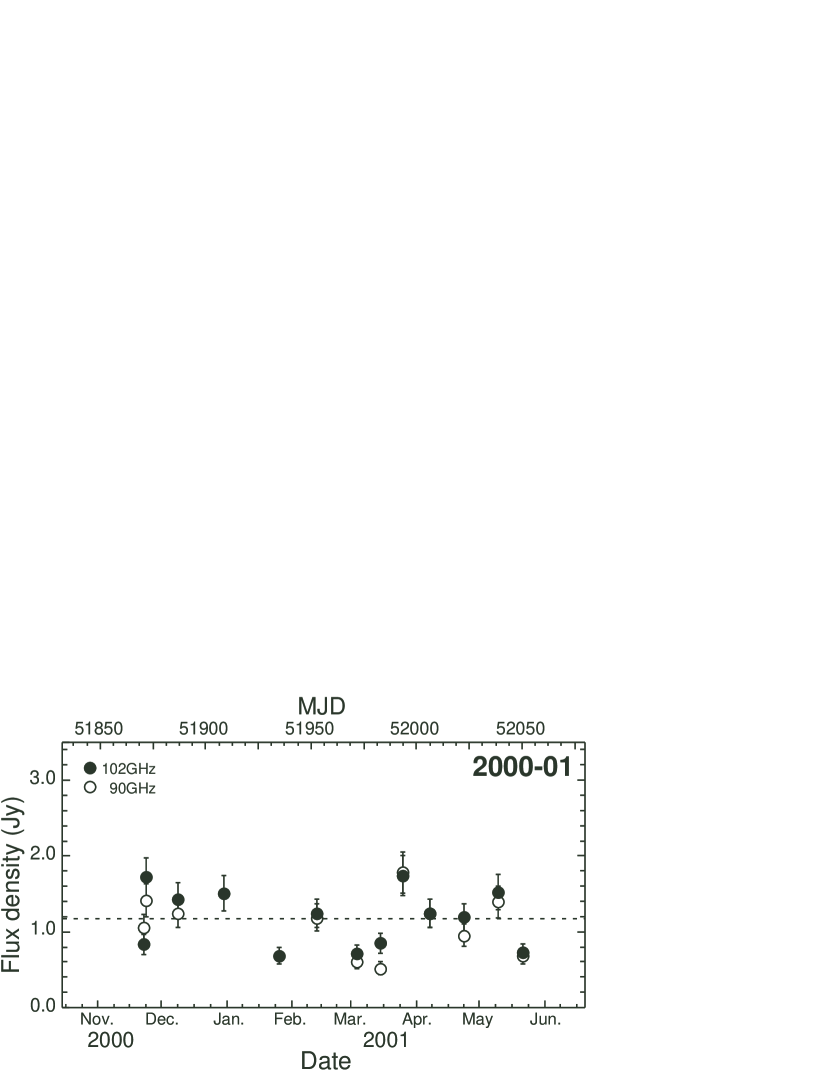
A total number of observations of Sgr A∗ at 100 GHz band from 1996 to 2003 is about 60 days. The light curve shows that Sgr A∗ has quiescent and active phases (Miyazaki et al., 2003). Mean flux densities in a quiescent phase are Jy and Jy at 90 and 102 GHz, respectively.
Figure 1 shows the light curves of Sgr A∗ at 100 and 140 GHz bands in 2000. This is a representative of the active phase. Figure 2 shows the light curves of Sgr A∗, which is probably the quiescent phase, at 100 GHz in 2000–2001. The flux densities in the figure were averaged for one observation day. There was violent variability in the active phase in 2000. Several flares with durations of days to a few weeks were identified. A most prominent flare was observed on 7 March 2000 at 140 GHz band. The peak flux densities of Sgr A∗ at 134 and 146 GHz were Jy and Jy, respectively. The flux density then decreased to Jy at 146 GHz on the subsequent day, 8 March 2000. Weather condition on 7 and 8 March was fine. The water vapor pressure was less than 2 hPa, which is translated to opacity at zenith, during the observations on both 7 and 8 March.
The half decay timescale of the flare at 146 GHz, was at most 24 hours. The averaged quiescent flux was about 1 Jy at 140 GHz band. The flare amplitude was about 300% () of the mean flux density level at 146 GHz, which is larger than that at 100 GHz band (200%). This probably indicates that the variability increases with frequency.
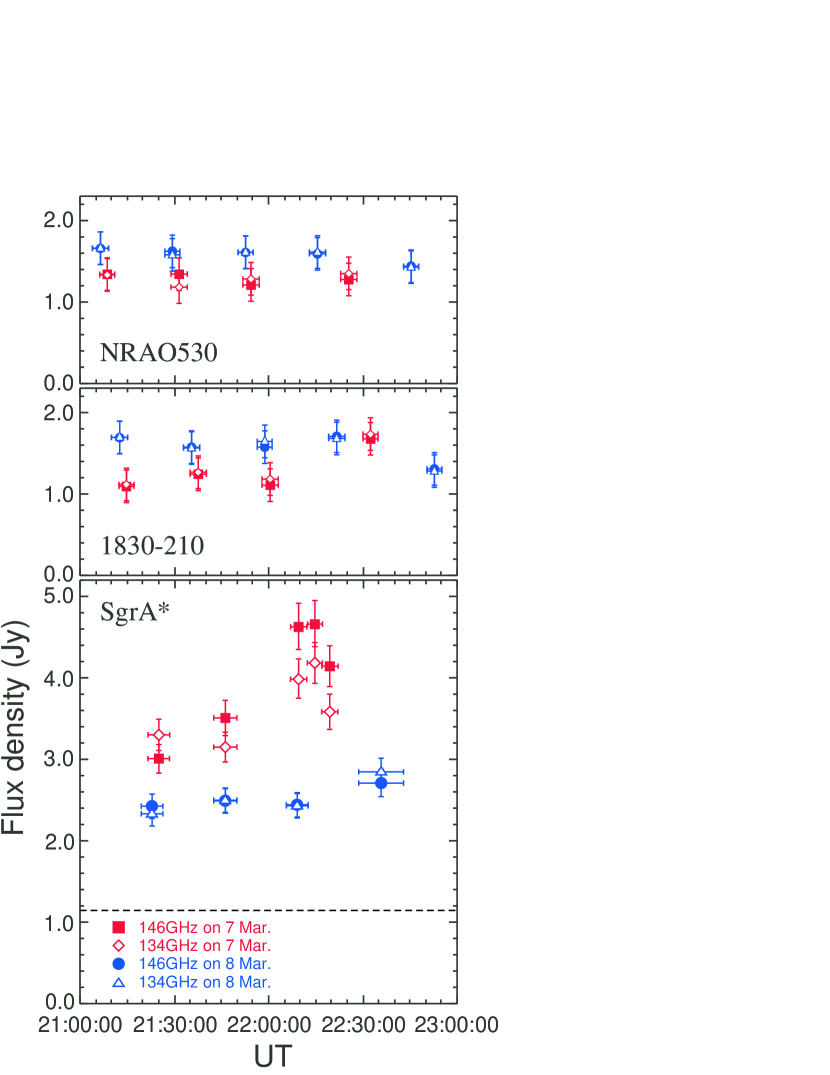
We divided the data set at 140 GHz band observed on 7 and 8 March 2000 into about a 5 minute bin around the peak and 7–14 minute bins for others and measured the flux density of Sgr A∗ at each bin in order to search for shorter timescale variability. Figure 3 shows the light curve of Sgr A∗ at 140 GHz in the two days. On 7 March, the flux density around the peaks changed rapidly. These are summarized in Table 2. The peaks of the flares at 134 and 146 GHz were occurred at 22:14 UT. The flux density of Sgr A∗ at 146 GHz increased from 3.5 to 4.7 Jy between 21:45 to 22:15 UT on 7 March. The peak flux densities were Jy at 134 GHz and Jy at 146 GHz. We used the same flux scales, which was determined from the flux calibration in March 2000, for both data on 7 and 8 March. The relative uncertainty in the two days depends only on the accuracy of the gain calibration and the estimation of decorrelation. Then the relative uncertainty is smaller than the absolute one. The typical relative uncertainties of 100 and 140 GHz bands were estimated to be a few % and 6%, respectively. The upper panel in Figure 3 shows the light curves of the calibrators (NRAO530, 1830-210). The scatters of the measured flux density are much smaller than the variation in the flare of Sgr A∗. The projected baselines change with earth rotation. This change in sampling of the source structure might cause artificial variation in flux density. However, such effect is not significant because no variation in flux density was observed within the relative uncertainty on 8 March. Thus the observed 30% increase in 30 minutes must be real. The timescale that the flux density increased by 100% (two-fold increase timescale) is estimated to be about 1.5 hours assuming that the increase has a constant gradient. On the other hand, the intra-day variation was not found in the 100 GHz band data taken during the active phase in March 2000. The intra-day variation of Sgr A∗ at cm-wavelengths reported by Bower et al. (2002) indicates that the 15 GHz flux density increased by about 10% in 2 hours. The amplitude of the variation in our mm-wavelength observations is much larger than the value of the cm-wavelength observations. The intra-day variation at mm-wavelength has been also reported for the galactic nucleus of M81 (Sakamoto et al., 2001).
4 Discussion
The peak flux at 146 GHz corresponds to a factor of 4.5 increases from the mean value in the quiescent phase. The radio luminosity of the flare at the peak is erg s-1 assuming that the frequency width of the flare is 150 GHz. The X-ray flare is rising at about 1 hour and with the peak luminosity observed by XMM-Newton of erg s-1 (Porquet et al., 2003). On the other hand, the peak luminosity of infrared flares observed by the Very Large Telescope at H-band is about erg s-1 (Genzel et al., 2003). The observed infrared flares are similar to the X-ray flares in the duration, rise/decay times and luminosities (Genzel et al., 2003). The flare at mm wavelengths has similar increasing timescale as the X-ray and infrared flares though has smaller amplitude.
During the flare peak, flux densities at 146 GHz became larger than those at 134 GHz. The last column in Table 2 shows spectral indices, , estimated between 134 and 146 GHz (). The positive spectral index during the flare peak is clear though an uncertainty in the index is large due to a small frequency span. As shown in Figure 1, the peak flux density at 140 GHz band are also larger than that at 100 GHz band. This demonstrates that the spectrum was steep during the flare phase. The steep spectrum was also observed in the flare observed in 1998 (Tsuboi et al., 1999). The spectral variation suggests that the energy injection to photons was occurred in the higher frequency regime and the emitting frequency was shifted to millimeter wave regime with time.
The increasing timescale of the mm flare, 1.5 hours, provides the physical size (light crossing size) of the flare region in the accretion disk that is compact at or below AU (; Schwarzchild radius, , assuming a black hole mass of ). This upper limit is larger than the physical size of Sgr A∗ itself ( AU) observed by VLBI (Doeleman et al., 2001; Krichbaum et al., 1998). From the upper limit, the brightness temperature at the flare is estimated to be higher than K. There is asymmetry in the light curve as the half decay timescale is much longer than the flare increase timescale. Such light curve with rapid increase and slow decay is often observed in outburst phenomena with ejections, for example, flares on the Sun, the 1972 outburst of Cyg X-3 (Marti et al., 1992), etc. The total energy of the flare is in the order of erg if the duration of the flare is assumed to be a few days. The decay rate decreased significantly between 8 March and 14 March as the flux density on 14 March was 2 Jy, which is still twice as large as the mean value in a quiescent phase. Then, the total energy of the flare is as large as erg. However, apparent flattening of the decay rate may be due to another unseen flare.
5 Summary
We have performed the monitoring observations of the flux density of Sgr A∗ at 3 mm (100 GHz) and 2 mm (140 GHz) bands using the Nobeyama Millimeter Array (NMA) from 1996 to 2003. We detected several active phases. In the March 2000 flare, the flux densities of Sgr A∗ at 140 GHz band had reached a peak, 4.5 Jy, on 7 March and increased %. Then the flux was decreased to a half in a day. Moreover, We detected the 30% flux increase in 30 minutes on 7 March 2000. The timescale that the flux density increased by 100% is estimated to be about 1.5 hours assuming that the increase has a constant gradient. The upper limit for a size of the variable component estimated from the timescale of this intra-day variability is a few tens of AU. Such a light curve with rapid increase and slow decay is similar to that often observed in outburst phenomena with ejections.
References
- Baganoff et al. (2001) Baganoff, F.K., Bautz, M.W., Brandt, W.N., et al. 2001, Nature, 413, 45
- Baganoff et al. (2002) Baganoff, F.K., Bautz, M.W., Ricker, G.R., et al. 2002, BAAS, 34, 1153
- Bower et al. (2002) Bower, G.C., Falcke, H., Sault, R.J., & Backer, D.C. 2002, ApJ, 571, 843
- Bower et al. (2004) Bower, G.C., Falcke, H., Herrnstein, R.M., et al. 2004, Science, 304, 704
- Brown & Lo (1982) Brown, R.L., & Lo, K.Y. 1982, ApJ, 253, 108
- Doeleman et al. (2001) Doeleman, S.S., Shen, Z.-Q., Rogers, A.E.E. et al. 2001, AJ, 121, 2610
- Eckart et al. (2004) Eckart, A., Baganoff, F.K., Morris, M., et al. 2004, astro-ph/0403577
- Genzel et al. (2003) Genzel, R. ,Schödel, R., Ott, T. et al. 2003, Nature, 425, 934
- Ghez et al. (2003) Ghez, A. M., Duchêne, G., Matthews, K., et al. 2003, ApJ, 586, L127
- Ghez et al. (2004) Ghez, A.M., Wright, S.A., Matthews, K., et al. 2004, ApJ, 601, L159
- Goldwurm et al. (2003) Goldwurm, A., Brion, E., Goldoni, P., et al. 2003, ApJ, 584, 751
- Krichbaum et al. (1998) Krichbaum, T.P., Graham, D.A., Witzel, A. et al. 1998, A&A, 335, L106
- Marti et al. (1992) Marti, J., Paredes, J.M., & Estalella, R. 1992, A&A, 258, 309
- Miyazaki et al. (1999) Miyazaki, A.,Tsutsumi, T., & Tsuboi, M., 1999, Advances in Space Research, 23, 5/6, 977
- Miyazaki et al. (2003) Miyazaki, A.,Tsutsumi, T., & Tsuboi, M., 2003, Astron. Nachr., 324, S1, 363
- Okumura et al. (2000) Okumura, S.K., et al. 2000, PASJ, 52, 393
- Porquet et al. (2003) Porquet, D., Predehl, P., Aschenbach, B. et al. 2003, A&A, 407, L17
- Reid (1993) Reid, M. J. 1993, ARA&A, 31, 345
- Sakamoto et al. (2001) Sakamoto, K., Fukuda, H., Wada, K., & Habe, A. 2001, AJ, 122, 1319
- Schödel et al. (2002) Schödel, R., Ott, T., Genzel, R., et al. 2002, Nature, 419, 694
- Schödel et al. (2003) Schödel, R., Ott, T., Genzel, R., et al. 2003, ApJ, 596, 1015
- Tsuboi et al. (1999) Tsuboi, M., Miyazaki, A., & Tsutsumi, T. 1999, in ASP Conf. Ser. 186, The Central Parsecs of the Galaxy, eds. H. Falcke, A. Cotera, W.J. Duschl, F. Melia, & M.J. Rieke (San Francisco: ASP), 105
- Tsutsumi, Morita, & Umeyama (1997) Tsutsumi, T., Morita, K.-I., Umeyama, S. 1997, in ASP Conf. Ser. 125, Astronomical Data Analysis Software and Systems VI, ed. Gareth Hunt and H.E. Payne (San Francisco: ASP), 50
- Wright & Backer (1993) Wright, M.C.H., & Backer, D.C. 1993, ApJ, 417, 560
- Zhao et al. (1992) Zhao, J.-H., Goss, W.M., Lo, K.Y., & Ekers, R.D. 1992, in Relationships between Active Galactic Nuclei and Starburst Galaxies, ed. A.V. Flilpenko (San Francisco: ASP), 295
- Zhao et al. (2001) Zhao, J.-H., Bower, G.C., & Goss, W.M. 2001, ApJ, 547, L29
- Zhao et al. (2003) Zhao, J.-H., Young, K.H., Herrnstein, R.M. et al. 2003, ApJ, 586, L29
- Zhao et al. (2004) Zhao, J.-H., Herrnstein, R.M., Bower, G.C., Goss, W.M., & Liu, S.M. 2004, ApJ, 603, L85
| Date | Time (UT) | Frequency (GHz) |
|---|---|---|
| February 27 | 21:10-23:00 | 90 & 102 |
| February 28 | 20:50-22:50 | 134 & 146 |
| March 6 | 20:50-23:00 | 90 & 102 |
| March 7 | 21:10-22:40 | 134 & 146 |
| March 8 | 21:00-23:00 | 134 & 146 |
| March 13 | 20:10-23:00 | 90 & 102 |
| March 14 | 20:20-23:00 | 134 & 146 |
| March 20 | 19:40-21:30 | 90 & 102 |
| March 22 | 19:40-21:30 | 90 & 102 |
| March 27 | 19:10-21:00 | 90 & 102 |
| March 29 | 19:10-21:00 | 90 & 102 |
| Time (UT) | Flux density (Jy)aaThe errors indicate the relative errors of the flux densities (see §3). | indexbbThe spectral indices, (), estimated between 134 and 146 GHz. The typical errors of indices are about . | |
|---|---|---|---|
| 134 GHz | 146 GHz | ||
| 2000 March 7 21:21-21:28 | |||
| 21:44-21:51 | |||
| 22:07-22:12 | |||
| 22:12-22:17 | |||
| 22:17-22:22 | |||
| meanccThe derived value using all data in a day. | |||
| 2000 March 8 21:19-21:26 | |||
| 21:42-21:49 | |||
| 22:05-22:12 | |||
| 22:28-22:42 | |||
| meanccThe derived value using all data in a day. | |||