Discovery of new 19.9-GHz methanol masers in star forming regions
Abstract
We have used the NASA Tidbinbilla 70-m antenna to search for emission from the (19.9-GHz) transition of methanol. The search was targeted towards 22 star formation regions which exhibit maser emission in the 107.0-GHz methanol transition, as well as in the 6.6-GHz transition characteristic of class II methanol maser sources. A total of 7 sources were detected in the transition, 6 of these being new detections. Many of the new detections are weak (0.5 Jy), however, they appear to be weak masers rather than thermal or quasi-thermal emission.
We find a strong correlation between sources which exhibit 19.9-GHz methanol masers and those which both have the class II methanol masers projected against radio continuum emission and have associated 6035-MHz OH masers. This suggests that the 19.9-GHz methanol masers arise in very specific physical conditions, probably associated with a particular evolutionary phase. In the model of Cragg, Sobolev & Godfrey (2002) these observations are consistent with gas temperatures of 50 K, dust temperatures of 150-200 K and gas densities of .
keywords:
masers – stars:formation – ISM: molecules – radio lines : ISM1 Introduction
In the 20 years since the discovery of the first of the class II methanol maser transitions (Wilson et al., 1984) they have become important probes of high-mass star formation regions. Class II methanol masers have a number of advantages over the other molecular maser species commonly found in star forming regions. They are more common than main-line OH masers and where they are found towards the same regions they are typically an order of magnitude stronger (Caswell et al., 1995a). They are significantly less variable than 22-GHz water masers, with individual features having lifetimes in excess of a decade and unlike OH and water masers they appear to be exclusively associated with high-mass star formation (Minier et al., 2003).
To date more than 20 different methanol transitions have been observed as interstellar masers, and these have been empirically divided into two classes (Menten, 1991a). Class II methanol masers are closely associated with high-mass star formation and other tracers of this process, far-infrared sources, Hii regions and OH and water masers. Class I masers are also found within high-mass star forming regions, but offset from the young stellar objects and are thought to be collisionally pumped in outflows. The most common class II methanol maser transitions are those at 6.6 and 12.1 GHz (Menten, 1991b; Batrla et al., 1987), but some sources such as W3(OH), NGC6334F and 345.010+1.792 exhibit methanol maser emission from many other transitions (Cragg et al., 2001; Sutton et al., 2001). Interferometric observations have shown that the 6.6- and 12.1-GHz emission in some sources is coincident both in velocity and spatially (to within a few milliarcseconds) (Menten et al., 1992; Norris et al., 1993; Minier, Booth & Conway, 2000). Observations with arcsecond resolution of some of the rarer transitions in W3(OH) show that to within the relative positional accuracy these are also spatially coincident with the 6.6-GHz masers (Menten et al., 1988; Sutton et al., 2001).
The pumping of interstellar masers is a complicated process that sensitively depends upon a number of factors such as the gas temperature and density, molecular abundance and external radiation field. Theoretical studies of maser pumping show that the commonly observed maser transitions are produced over a wide range of physical conditions (Cragg et al., 2002; Gray, Field & Doel, 1992; Pavlakis & Kylafis, 1996a, b; Sobolev et al., 1997) and hence it isn’t possible to infer any detailed information about the physical conditions in the maser region from observations of a single transition. However, where multiple transitions arise from the same gas any maser pumping scheme must be able to simultaneously produce the various transitions in the observed intensity ratio. This approach has been applied to OH and methanol maser emission in a small number of sources and produces physically plausible answers (Cesaroni & Walmsley, 1991; Cragg et al., 2001; Sutton et al., 2001). Typically the star-forming regions targetted in searches for new maser transitions and multi-transition modelling are those which exhibit emission from a large number of maser transitions such as W3(OH) and NGC6334F. However, the presence of a large number of different maser transitions in these sources indicates that these regions are special in some way, and not representative of the conditions that exist in the majority of high-mass star forming regions. In order to obtain information on the conditions in a larger sample of more representative star forming regions we are undertaking a program to search for methanol maser transitions that are rarely strong, (hence forth referred to as “weak methanol” maser transitions for simplicity) towards all sources that exhibit 107.0-GHz methanol maser emission. To date 25 such sources have been identified from searches of more than 175 class II methanol maser sources (Val’tts et al., 1995, 1999; Caswell et al., 2000; Minier & Booth, 2002). In constraining the physical conditions in these regions the non-detection of the weak methanol maser transitions can sometimes be as useful as a detection, as it also limits the range of parameter space within the model consistent with observations of the region (see for example Cragg et al., 2004).
We have previously undertaken searches for 23.1-, 85.5-, 86.6- and 108.8-GHz methanol masers towards the sample of star formation regions with 107.0-GHz methanol masers (Cragg et al., 2004; Ellingsen et al., 2003; Val’tts et al., 1999). Although it was one of the first methanol maser transitions discovered, few observations have been made of the 19.9-GHz transition and it has only been reported towards three star forming regions, W3(OH), NGC7538 (Wilson et al., 1985) and NGC6334F (Menten & Batrla, 1989). Here we report the results of a sensitive search for maser emission from the transition of methanol with the Tidbinbilla 70-m antenna. The search was targetted towards the 22 known 107.0-GHz methanol maser sources that are observable from Tidbinbilla.
2 Observations and Data reduction
The observations of the 19.9-GHz transition were made on 2003 April 10, October 25 & 26 and November 15-17 using the NASA Tidbinbilla 70-m antenna. The rest frequency assumed was 19967.3961 MHz, which has a 2 uncertainty of 0.0002 MHz (Mehrotra, Dreizler & Mäder, Mehrotra et al.1985). At 19.9 GHz the FWHM antenna beamwidth was 53″. The sources were observed in position switching mode with 300 seconds spent at the onsource position and 150 seconds spent at a position offset by +2.5 minutes in right ascension prior to the onsource observation and another 150 seconds spent at a position offset by -2.5 minutes in right ascension following the observation. This observing pattern means that the movement of the antenna during the observation is the same for both the onsource and reference observations and minimises the difference in atmospheric and antenna gain effects between them. The weather conditions varied considerably during the observations and the majority of the sources were observed on more than one occasion. The observations made in good weather conditions typically have a sensitivity a factor of two or more better than those observed in poor conditions. For sources observed in good weather conditions an onsource integration time of 5 minutes typically yielded an RMS of 0.1 Jy. The data for a single circular polarization (LCP) were collected using a 2-bit, three level digital autocorrelation spectrometer configured with 4096 channels spanning a 16-MHz bandwidth. For an observing frequency of 19.9 GHz this configuration produces a natural weighting velocity resolution of 0.07 , or 0.12 after Hanning smoothing. The total velocity range covered was approximately 240 , and for each source this centred around the velocity of the 6.6-GHz methanol maser emission. Tipping curves to measure the opacity of the atmosphere were performed for the observations made in November. For the earlier observations the opacity was estimated either from the variation in the system temperature with elevation, or from tipping scans made at other frequencies. The nominal pointing accuracy of the Tidbinbilla 70-m antenna is 10″ and comparison of sources observed on more than one occasion suggests that the final absolute flux density calibration is accurate to 10%
For some of the sources detected at 19.9 GHz, additional observations at 6.6 and 12.1 GHz were made with the University of Tasmania 26-m antenna at Hobart on 2003 December 1 & 2. At 6.6- and 12.1-GHz the FWHM beamwidths were 7.1′ and 3.9′ respectively. At both frequencies the observations were made with a dual circularly polarized receiver with a typical system equivalent flux density of 880 Jy at 6.6 GHz and 790 Jy at 12.1 GHz. The data were collected using a 2-bit, three level digital autocorrelation spectrometer configured with 4096 channels spanning a 4-MHz bandwidth at 6.6 GHz and 2048 channels spanning an 8-MHz bandwidth at 12.1 GHz. This configuration produces a natural weighting velocity resolution of 0.05 , or 0.09 after Hanning smoothing at 6.6 GHz, and natural weighting and Hanning smoothed velocity resolutions of 0.12 and 0.19 at 12.1 GHz. This velocity resolution is well matched to that of the 19.9-GHz observations. The sources were observed in position switching mode with 600 seconds spent at a position offset in position by -1 degree in declination and 600 seconds spent onsource at 6.6 GHz and 60 seconds spent onsource at 12.1 GHz. In addition a five point grid with observations at the nominal position and at four points each offset by approximately half the FWHM beamwidth were made for each source at both frequencies. These data were used to measure any pointing offset and the flux density of each source has been scaled to correct for the offset. Analysis of the grid observations revealed that the 12.1 GHz observations were made with the receiver significantly offset from the optimal position. The absolute flux density calibration of the 6.6-GHz observations is better than 10%, however, uncertainties due to the offset receiver position mean that at 12.1 GHz the calibration is probably only good to a factor of 2.
3 Results
A total of 22 sources were observed at 19.9 GHz and these are listed in Table 1. Emission from the 19.9-GHz transition was detected towards 7 sources, all of these except NGC6334F are new discoveries. The 19.9-GHz spectrum of each of the detected sources is shown in Fig. 1. For the sources where emission was detected Gaussian profiles were fitted and the parameters of these are listed in Table 1, for the other sources a limit of three times the RMS noise in the final spectra is given. The typical 3- limit for these observations was less than 0.3 Jy which is significantly better than our searches for the 23.1-, 85.5-, 86.6- and 108.8-GHz transitions. Of the 7 sources detected only two have a peak flux density stronger than 1 Jy and so these observations demonstrate the importance of sensitivity in searches for weak methanol maser transitions. The weakness of the 19.9-GHz methanol emission in most of our detections means that we cannot conclusively prove that it is maser emisison, however, comparison with other methanol maser transitions in each source shown in Figs 2-8 strongly suggests that for the majority it is. The recent upgrade to the Australia Telescope Compact Array (ATCA) means that it is now able to observe the 19.9-GHz methanol transition and hence will be able to determine whether the weak sources are masers.
| Name | R.A.(J2000) | Dec.(J2000) | Observed | Integration | Flux Density | Velocity | FWHM |
|---|---|---|---|---|---|---|---|
| (h m s) | (∘ ′ ″) | DOY 2003 | Time (min) | (Jy) | () | () | |
| 188.946+0.886 | 06:08:53.3 | +21:38:29 | 100 | 10 | 0.20 | ||
| 192.600–0.048 | 06:12:54.0 | +17:59:24 | 100 | 10 | 0.19 | ||
| 310.144+0.760 | 13:51:58.5 | –61:15:42 | 300,320 | 10 | 0.16 | ||
| 318.948–0.196 | 15:00:55.4 | –58:58:53 | 300,320 | 10 | 0.17 | ||
| 323.740–0.263 | 15:31:45.5 | –56:30:50 | 299,319 | 10 | 0.15 | -51.4 | 3.1 |
| 327.120+0.511 | 15:47:32.7 | –53:52:38 | 300,320 | 10 | 0.17 | ||
| 328.808+0.633 | 15:55:48.5 | –52:43:07 | 300,319,320 | 15 | 0.79 | -43.7 | 0.9 |
| 336.018–0.827 | 16:35:09.3 | –48:46:47 | 320 | 5 | 0.21 | ||
| 339.884–1.259 | 16:52:04.7 | –46:08:34 | 299,319,320 | 15 | 9.8 | -36.2 | 0.4 |
| 1.5 | -36.8 | 0.4 | |||||
| 340.054–0.244 | 16:48:13.9 | –45:21:44 | 320 | 5 | 0.20 | ||
| 340.785–0.096 | 16:50:14.8 | –44:42:26 | 320 | 5 | 0.76 | ||
| 345.003–0.223 | 17:05:10.9 | –41:29:06 | 321 | 5 | 0.22 | -27.4 | 3.4 |
| 345.010+1.792 | 16:56:47.6 | –40:14:26 | 320 | 5 | 0.21 | -17.6 | 1.5 |
| 345.504+0.348 | 17:04:22.9 | –40:44:22 | 300 | 5 | 0.65 | ||
| 348.703–1.043 | 17:20:04.1 | –38:58:31 | 320 | 5 | 0.39 | ||
| NGC6334F | 17:20:53.4 | –35:47:01 | 320 | 5 | 146.7 | -10.4 | 0.3 |
| 26.8 | -11.0 | 0.3 | |||||
| 1.9 | -9.6 | 0.4 | |||||
| 353.410–0.360 | 17:30:26.2 | –34:41:46 | 320,321 | 7 | 0.33 | -20.5 | 1.8 |
| 9.621+0.196 | 18:06:14.7 | –20:31:32 | 320,321 | 12 | 0.22 | ||
| 12.909–0.260 | 18:14:39.5 | –17:52:00 | 320 | 10 | 0.27 | ||
| 23.010–0.411 | 18:34:40.3 | –09:00:38 | 320 | 10 | 0.26 | ||
| 23.440–0.182 | 18:34:39.2 | –08:31:24 | 320 | 10 | 0.24 | ||
| 35.201–1.736 | 19:01:45.5 | +01:13:35 | 320 | 10 | 0.51 |


3.1 Comments on individual sources
323.740-0.263
This is one of the strongest 6.6- and 12.1-GHz methanol masers, however at 19.9 GHz it was only marginally detected with a peak flux density of 0.15 Jy and a FWHM of 3.1 . The velocity and width of the 19.9-GHz emission is similar to that seen at both 107.0- and 156.6-GHz (Caswell et al., 2000). Caswell et al. interpret the strong 107.0-GHz emission as being due to a blend of maser lines, with some thermal contribution and the 156.6-GHz emission as being thermal. Fig. 2 shows that the 19.9-GHz emission appears to be slightly offset from the strongest 6.6- and 12.1-GHz masers, although the low signal-to-noise ratio means that it is not possible to be definitive about this. The weak, broad nature of the 19.9-GHz emission in this source and its alignment with thermal emission from other methanol transitions (Caswell et al., 2000) means that it may too be thermal, but higher spatial resolution observations are required to determine this.
323.740-0.263 is an unusual star forming region in that although it shows extremely strong class II methanol maser emission Phillips et al. (1998) did not detect centimetre radio continuum emission with a 4- limit of 0.2 mJy/beam. Infra-red emission is present towards 323.740-0.263, but only at wavelengths in excess of 3.6 µm (De Buizer, Piña & Telesco, De Buizer et al.2000; Walsh, Lee & Burton, 2002). From their 10 and 18 µm observations De Buizer et al. calculate a dust temperature of 128 K. Walsh et al. also detected H2 emission from the region surrounding the masers, some of which appears to be shocked excited.

328.808+0.633
Fig. 3 shows that the 19.9-GHz methanol maser emission in this source has the same peak velocity as the weak 85.5-GHz emission detected by Ellingsen et al. (2003), which is slightly offset in velocity from the strongest 6.6- and 107.0-GHz emission. The 12.2-GHz emission at velocities near -44 is not detected in our Mt Pleasant observations, but Caswell et al. (1995b) found emission with a strength of 1-2 Jy in this velocity range (beneath the detection threshold of the Mt Pleasant observations). The emission at 107.0-GHz has both maser and thermal components, while the emission at 108.8- and 156.6-GHz is thought to be thermal (Caswell et al., 2000; Val’tts et al., 1999), and is offset from the velocity of the 19.9-GHz methanol maser emission.
The class II methanol masers in 328.808+0.633 are projected against a strong cometary Hii region (Walsh et al., 1998) and 1720-, 4765-, 6030- and 6035-MHz OH masers have all been detected within a few arcseconds of the methanol masers (Caswell, 2003, 2004; Dodson & Ellingsen, 2002). The masers are also associated with a mid-infrared source, from which a dust temperature of approximately 120 K is inferred (, De Buizer et al.2000).

339.884-1.259
The strong, narrow emission at 19.9 GHz in this source identifies it unambiguously as maser emission. The 19.9-GHz methanol masers are at velocities in the middle of the range seen in the 6.6- and 12.1-GHz masers. Fig. 4 shows that the strongest 19.9-GHz methanol maser emission in 339.884-1.259 is at a velocity corresponding to one of the weaker peaks in the 12.1- and 107.0-GHz emission. The observations of Caswell et al. (1995a) show that at the corresponding velocity the 6.6-GHz is at a minimum. Very long baseline interferometry observations by Phillips (1998) show a narrow 6.6-GHz emission feature with a flux density of approximately 300 Jy at a velocity of -36.1 . The observations of Caswell et al. (2000) suggest that both the 107.0 and weaker 156.6-GHz methanol masers are superimposed on top of thermal emission and show significant variations on a timescale of years.
The class II methanol masers in this source are projected against the centre of a weak cometary Hii region (Ellingsen, Norris & McCulloch, Ellingsen et al.1996) and 1720-, 6030- and 6035-MHz OH masers have all been detected within a few arcseconds of the methanol masers (Caswell, 2003, 2004). De Buizer et al. (2002) detect three mid infra-red sources close to the masers with a peak dust temperature of 145 K and suggest that some of the radio continuum emission results from a collimated ionized outflow.

345.003-0.223
The 19.9-GHz methanol masers in 345.003-0.223 follow the pattern of the majority of the other sources in being offset in velocity from the strongest emission at 6.6-GHz (see Fig. 5), but coincident in velocity with a weaker emission feature. However, the peak flux densities of the 6.6-, 12.1- and 107.0-GHz masers in this source are significantly less than for the other sources (Caswell et al., 1995b, 2000). The velocity of the 19.9-GHz peak lies between the velocity of the thermal emission at 156.6-GHz (-27.8 ) and the peak of the 107.0-GHz maser emission (-26.9 ), which also lies on top of broad thermal emission (Caswell et al., 2000). The 12.1-GHz maser emission from the velocity range of the 19.9-GHz maser is very weak (of the order of 1 Jy) (Caswell et al., 1995b) and comparison of the 6.6-GHz emission shown by Caswell et al. (1995a) with that in Fig. 5 shows that the 6.6-GHz peak flux density is less than 20% of that observed a decade ago.
Walsh et al. (1998) found the 6.6-GHz methanol masers in this source to lie in two clusters, the emission near -27 is projected against an Hii region and 1720-, 6030- and 6035-MHz OH masers have all been detected within a few arcseconds of the class II methanol masers (Caswell, 2003, 2004)

345.010+1.792
345.010+1.792 is a remarkable source which exhibits class II methanol maser emission in nearly every known transition in which it has been observed (Val’tts, 1998; Val’tts et al., 1999; Cragg et al., 2001), to date the only exception is the 23.1-GHz transition (Cragg et al., 2004). However, as can be seen in Fig. 6 the 19.9-GHz methanol maser emission differs from the other weak methanol transitions which are generally observed at velocities near -22 (Cragg et al., 2001). The 19.9-GHz maser emission at -17.6 corresponds to a 100 Jy 6.6-GHz emission feature, which at one time was the strongest feature in the spectrum, but has significantly declined in strength over the last decade (Caswell et al., 1995a). There is 12.1- and 107.0-GHz emission present at the velocity of the 19.9-GHz emission, but only at a level of a few Jy (Caswell et al., 2000). Strong thermal emission (most evident in the 108.8-GHz spectrum) is also present in many of the millimetre methanol transitions that have been observed towards 345.010+1.792, however, it is well offset in velocity from the 19.9-GHz peak and the other weak methanol maser transitions.
The class II methanol masers are projected against an Hii region, although significantly offset from the centre (Walsh et al., 1998). The 10 and 18 µm MIR emission associated with the masers implies a dust temperature of approximately 160 K (, De Buizer et al.2000) and 6030- and 6035-MHz OH masers are located within a few arcseconds of the methanol (Caswell, 2003).

NGC6334F
NGC6334F is the archetypal high-mass star forming region of the southern sky, it shares many characteristics with W3(OH) and has been well studied over a range of wavelengths and molecular transitions. It remains the strongest known 19.9-GHz methanol maser source, although it has significantly decreased in strength over the 16 year period since its discovery (Menten & Batrla, 1989). Unlike most of the other 19.9-GHz methanol maser sources Fig. 7 shows that in NGC6334F the 19.9-GHz peak is at the same velocity as the peak flux density at 6.6-, 12.1- and 107.0-GHz. There are two regions of class II methanol maser emission near NGC6334F, separated by about 6 arcseconds, one projected onto the Hii region, the other offset from it (, Ellingsen et al.1996). Unfortunately both clusters show strong emission at velocities around -10.4 and interferometric resolution observations are required to determine which of the clusters the 19.9-GHz emission is associated with.
NGC6334F has 1720-, 6030- and 6035-MHz OH masers within a few arcseconds of the class II methanol maser cluster projected onto a strong Hii region (Caswell, 2003, 2004). There are a number of MIR sources in the NGC6334F region, the strongest of which coincides with the peak of the radio continuum and maser cluster (, De Buizer et al.2000). De Buizer et al. estimate a dust temperature of 159 K from their observations.

353.410-0.360
Fig. 8 shows that the 19.9-GHz methanol maser emission in 353.410-0.360 follows the pattern seen in most of the other sources, being aligned in velocity with secondary 6.6-GHz and 12.1-GHz peaks (Caswell et al., 1995b). The class II methanol masers are projected onto an Hii region with a peak flux density of 215 mJy/beam at 3-cm (Phillips et al., 1998) and 1720-, 4765-, 6030- and 6035-MHz OH masers are located within a few arcseconds (Caswell, 2003, 2004; Dodson & Ellingsen, 2002).

4 Discussion
Table 2 presents a nearly complete set of observations of 25 class II methanol maser sources in 9 transitions. The selected sources all exhibit masers at 6.6 and 107.0 GHz, and all but 1 also have masers detected at 12.1 GHz (although in some cases not at the velocity of the 107.0 GHz peak). Of the remaining 6 frequencies surveyed, the 19.9-GHz maser which is the subject of this paper is detected in the largest number of sources (9), followed by the 156.6-GHz maser (4 sources), the 23.1-GHz maser (3 sources), the 85.5- and 86.6-GHz masers (2 sources each), and the 108.8-GHz maser (1 source). While these statistics demonstrate that these other maser transitions are rarely strong, they suffer from a number of limitations. The searches at different frequencies were carried out with different sensitivities, some are incomplete, and the detectability of weak millimetre-wavelength masers is often compromised by overlapping thermal emission. Nevertheless, the general scarcity of the weaker masers helps delimit the conditions prevalent in our sample of 107.0-GHz maser sources, as is outlined in section 4.2.
Landscape table to go here
4.1 Association with radio continuum and 6-GHz OH masers
It is clear from the comments on the individual sources that most 19.9-GHz methanol masers are :
-
•
offset in velocity from the strongest 6.6- and 12.1-GHz masers ;
-
•
occur in sources that are projected against centimetre continuum emission ;
-
•
have associated 6030- and 6035-MHz OH masers.
Our observations include 7 of the 9 sources known to exhibit 19.9-GHz methanol maser emission (the other two being W3(OH) and NGC7538). Both W3(OH) and NGC7538 also have the masers projected against centimetre radio continuum (Argon et al., 2000; Kawamura & Masson, 1998) and associated 6035-MHz OH masers Baudry et al. (1997). We have examined the literature to look at the association with radio continuum and OH maser transitions for all 25 sources that show 107.0-GHz methanol masers, the results are summarised in Table 3. This shows that there is a very good correlation between centimetre radio continuum and 6035-MHz OH masers and 19.9-GHz methanol masers. Most of the 19.9-GHz detections (7 of 9) are also associated with 1720-MHz OH maser emission, which is only detected in about 7% of OH maser sources in star forming regions (Caswell, 1998). There is only one source (323.740-0.263) which lacks both radio continuum emission and 6035-MHz OH masers and has 19.9-GHz methanol and the weak, broad nature of the emission in this source means that it may be thermal. Further, there is also only one source (35.201-1.736/W48) which has the class II methanol masers projected against radio continuum emission, has associated 6035-MHz OH masers but does not show 19.9-GHz methanol emission. However, the absolute position of the class II methanol masers with respect to the radio continuum emission has not been accurately determined in this source and so it may not be a true exception. As all the sources in our sample are 107.0-GHz methanol masers further observations are required to determine if 19.9-GHz methanol masers are found more generally towards sources projected against centimetre radio continuum with 6035-MHz OH masers. We can use the observed association between 19.9-GHz methanol, 6035-MHz OH and radio continuum and the Cragg et al. (2002) model of methanol and OH masers to constrain the conditions in these sources.
| Name | Associated with | References | ||
|---|---|---|---|---|
| cm continuum | 19.9 GHz methanol | OH maser transitions | ||
| W3(OH) | Y | Y | 1612,1665,1667,1720,4765,6030,6035 | 2,11,12,16 |
| 188.946+0.886 | N | N | 1665 | 1 |
| 192.600–0.048 | N | N | 13 | |
| 310.144+0.760 | N | 1665,1667 | 3 | |
| 318.948–0.196 | N | N | 1665,1667 | 3,9 |
| 323.740–0.263 | N | Y | 1665,1667 | 3,15 |
| 327.120+0.511 | Y | N | 1665,1667 | 3,15 |
| 328.808+0.633 | Y | Y | 1665,1667,1720,4765,6030,6035 | 3,4,5,8,17 |
| 336.018–0.827 | N | 1665,1667 | 3 | |
| 339.884–1.259 | Y | Y | 1665,1667,1720,6030,6035 | 3,4,5,9 |
| 340.054–0.244 | N | N | 1665,1667 | 3,17 |
| 340.785–0.096 | N | N | 1665,1667,1720,6035 | 3,4,5,17 |
| 345.003–0.223 | Y | Y | 1665,1667,1720,6030,6035 | 3,4,5,17 |
| 345.010+1.792 | Y | Y | 1665,1667,6030,6035 | 3,4,17 |
| 345.504+0.348 | N | N | 1665,1667 | 3,17 |
| 348.703–1.043 | N | N | 1665 | 3,17 |
| NGC6334F | Y | Y | 1665,1667,1720,6030,6035 | 3,4,5,9 |
| 353.410–0.360 | Y | Y | 1665,1720,4765,6030,6035 | 3,4,5,8,15 |
| 9.621+0.196 | Y | N | 1665,1667 | 3,15 |
| 12.909–0.260 | N | N | 1665,1667,1720 | 3,5,17 |
| 23.010–0.411 | N | N | 1665,1667 | 6,10 |
| 23.440–0.182 | N | N | 1665,1667 | 6,10 |
| 35.201–1.736 | Y | N | 1665,1667,6035 | 4,6,14 |
| Cep A | N | 1665,1667,4765,6030,6035 | 1,2,16 | |
| NGC7538 | Y | Y | 1665,1667,1720,4765,6035 | 1,2,7,16 |
4.2 Maser Modelling
The methanol maser model of Sobolev & Deguchi (1994) can account for maser action in the 19.9-GHz transition, as well as in the other 8 class II maser transitions for which observations are listed in Table 2 (Sobolev et al., 1997). The same model has been applied to OH masers in star-forming regions (Cragg et al., 2002). When both molecules are highly abundant in the gas phase, masers of methanol and OH can be excited under the same model conditions, consistent with the close associations which are often observed. Here we examine model predictions in relation to the newly identified trends for sources exhibiting 19.9-GHz methanol maser emission.
In the model of Sobolev & Deguchi, the maser pumping is produced by infrared emission from warm dust at temperatures exceeding 100 K. For methanol this is sufficient to pump the molecules to their second torsionally excited state; for OH the pumping proceeds via excited rotational states. The maser pumping is strongest when the gas is significantly cooler than the dust, although some masers persist even when the gas and dust temperatures are comparable. The masers are thermally quenched at gas densities exceeding . Very large column densities of methanol and OH are required to account for observed maser brightness temperatures, which can be as great as K. For plausible maser dimensions, this implies large abundances relative to hydrogen (e.g. , ), which are believed to follow from the evaporation of icy grain mantles in the neighbourhood of a young stellar object (Hartquist et al., 1995). In the model calculations, the maser intensities can be enhanced by beaming, and by the amplification of continuum radiation from an underlying ucH ii region. The principal parameters governing the behaviour of the masers are the dust temperature which drives the maser pumping, the gas kinetic temperature and hydrogen density which influence the collisional relaxation, and the beaming factor and specific column density of methanol or OH which determine the optical depth. In terms of these parameters the column density of the species in question along the line of sight is given by , where is the velocity width of the maser line.
One of the major sources of uncertainty in excitation studies of methanol has been the influence of collisions, which has until now been modelled on propensity rules derived from a small number of experiments (Lees & Haque, 1974). State-to-state rate coefficients for rotational excitation of methanol have recently been calculated (Pottage, Flower & Davis, 2002, 2004), and here we report the first methanol maser calculations to employ the new data. We include collisional transitions between the methanol torsional ground state levels, assuming the collision partners to be 20% He and 80% para-H2 (rate coefficients involving ortho-H2 are not yet available). Data are provided for methanol energy levels up to J=9, so we extrapolated these to higher J values using the 1/J propensity rule. A full investigation of the effects of the improved collision modelling on the masers, and of the minor effects of collisions involving higher torsional states, will be published elsewhere.
The masers are sensitive to the model conditions, switching on and off as parameters representing physical conditions are varied, with different combinations of maser lines appearing in different regimes. The masers at assorted frequencies which are observed in a given source often appear at the same velocity, and we assume this to mean that they are simultaneously excited. In this case, the model can be used to identify physical conditions which produce the same combination of masers. Observations at high spatial resolution are required to test this assumption by establishing whether or not the masers coincide in position.
Figures 9-12 illustrate a range of model conditions under which methanol and OH masers become active. Each plot shows the behaviour of maser brightness temperature as a single model parameter is varied. The upper panels include data for 7 of the methanol masers for which observations are collected in Table 2: 6.6, 12.1, 19.9, 23.1, 85.5, 86.6 and 107.0 GHz. Curves for 108.8 and 156.6 GHz are omitted in the interests of clarity – these resemble the curves for 107.0 GHz, but are generally weaker. The lower panels show the behaviour of the 7 most prevalent OH masers at 1612, 1665, 1667, 1720, 4765, 6030 and 6035 MHz. The strongest and most widespread observed masers (6.6-GHz methanol and 1665-MHz OH) are shown as bold traces; in most cases these are also the strongest masers in the models. The calculations were based around conditions which illustrate significant methanol maser action at 19.9 GHz: gas temperature K, dust temperature K, hydrogen density , and methanol specific column density . The OH specific column density is . In these calculations the beaming factor was . Since 19.9-GHz emission is detected in sources where the methanol masers are projected against radio continuum emission, we also included background continuum radiation in the modelling. The H ii continuum spectrum has temperature K, where K and GHz, and is geometrically diluted by a factor . Apart from the choice of parameter values and the new collision rate coefficients for methanol, the model calculations are identical to those described in full detail in Cragg et al. (2002).
For all but one of the sources in Table 2 the flux density at 107.0 GHz exceeds that at 19.9 GHz, the exception being the very strong 19.9-GHz maser in NGC 6334F. To compare these flux densities with the model calculations of maser brightness temperature requires an estimate of the maser source angular extent , since depends on . In the absence of this information, we seek models which can reproduce the observed flux density ratios, assuming that the masers of different frequency in the same source have a common size. When the frequency factor is taken into account, the observations suggest that for the sources where the 19.9-GHz emission is detected (excepting NGC6334F), the ratio of maser brightness temperatures for the component at the 19.9-GHz peak velocity lies in the range . Thus the models which best represent the sources in our sample, all of which have detectable 107.0-GHz maser emission, will be those in which the 107.0-GHz maser is relatively strong. Conditions representing the sources with associated 19.9-GHz emission are likely to be in the vicinity of the intersection of the 19.9-GHz (dotted) and 107.0-GHz (dashed) traces. The correlation between 19.9-GHz methanol emission and 6030- and 6035-MHz OH emission in the model can be examined by comparing the dotted traces in the upper and lower panels of Figs 9-12.
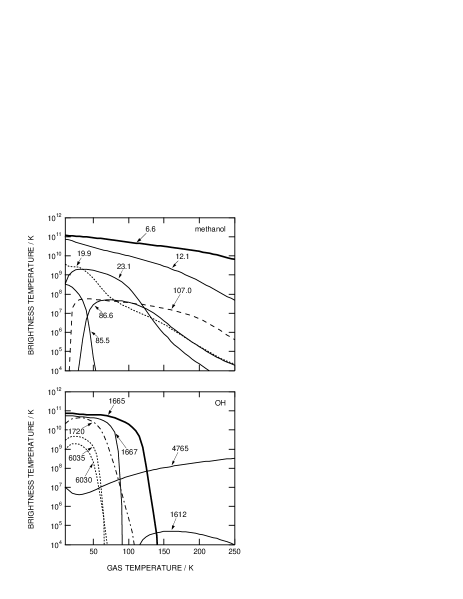
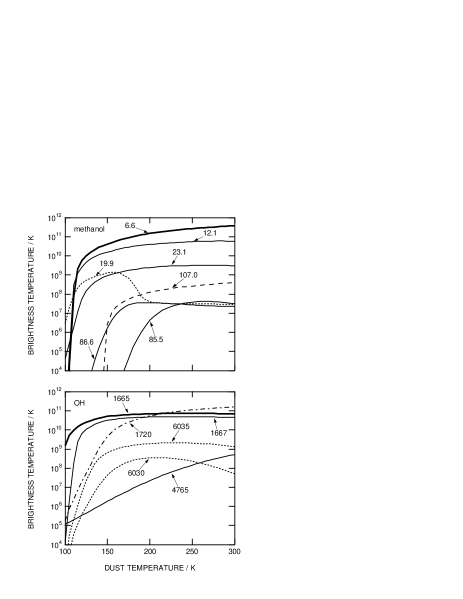
Fig. 9 shows the variation with gas temperature . The strongest methanol masers are, as observed, at 6.6 and 12.1 GHz, with the 19.9-GHz maser being most favoured at gas temperatures below 50 K. As the 23.1-GHz maser is also rather strong at gas temperatures up to 100 K, its nondetection (Cragg et al. 2004) can set useful limits on model parameters, but note that the 23.1-GHz survey was made with lower sensitivity than obtained in the current investigation at 19.9 GHz. Based on this plot, our observed flux density ratios would suggest that NCG 6334F may have rather low gas temperature ( K, consistent with the earlier modelling of Cragg et al., 2001) , the other 19.9-GHz maser sources may have temperatures in the range K, while the sources in which no 19.9-GHz maser was detected may have temperatures in the same range or higher. Gas temperatures above 100 K in the majority of sources would be consistent with the scarcity of masers at 23.1, 85.5, 86.6, 108.8 and 156.6 GHz. Note that such one-dimensional analysis is very simplistic, since different choices of gas density, dust temperature, methanol abundance etc. will influence the conclusions drawn, but this nevertheless gives a useful starting point for future multidimensional fitting of the model to the observations. The lower panel of Fig. 9 shows that the 6030-, 6035- and 1720-MHz OH masers are also favoured by gas temperatures below 75 K, in keeping with their observed correlation with 19.9-GHz methanol masers.
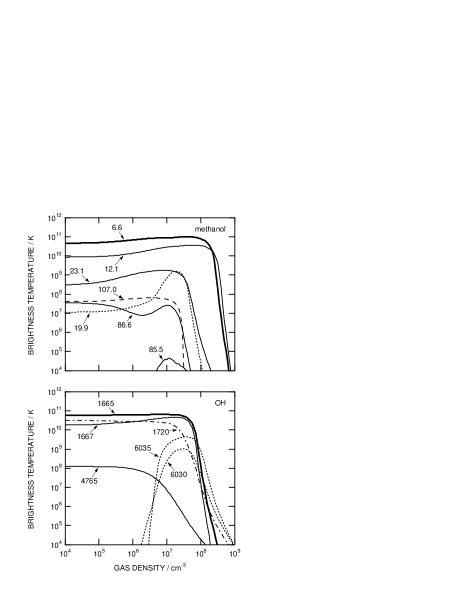
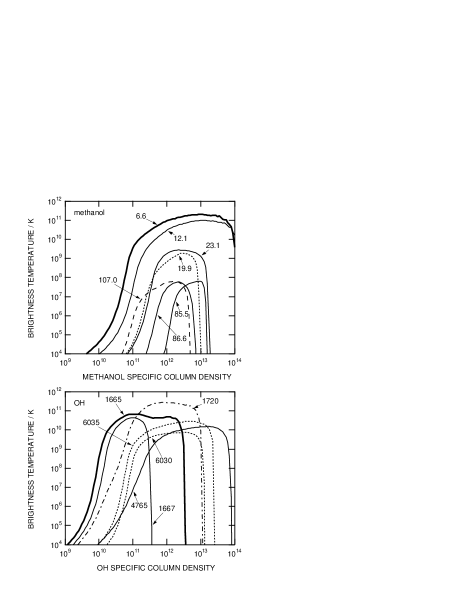
Fig. 10 shows the variation with dust temperature . The 19.9-GHz maser is strongest for dust temperatures K. This is consistent with the infrared observations of (De Buizer et al.2000); De Buizer et al. (2002) which suggest dust temperatures in the range K for our 19.9-GHz methanol maser sources, as noted in section 3.1. The various transitions have slightly different threshold temperatures for maser activity. For example the 107.0-GHz methanol maser requires dust temperature above 150 K to turn on under the chosen conditions, and is brighter than the 19.9-GHz maser at temperatures above 200 K. The 6030-, 6035- and 1720-MHz OH masers are also strong at dust temperatures above 150 K.
Fig. 11 shows the variation with gas density . All the masers are thermally quenched at the highest density . Under the conditions illustrated the 107.0-GHz maser is quenched at , while the 19.9-GHz line is strongest for densities . These conditions also favour maser activity in the 6030-, 6035- and 1720-MHz OH transitions.
Fig. 12 shows the variation with specific column density of methanol and OH. The calculations on which Figs 9-11 are based have , following Cragg et al. (2002) where it was established that this factor accounts well for the observed intensity ratios of the dominant 6.6-GHz methanol and 1665-MHz OH masers. Fig. 12 shows that this factor also provides substantial common ground between the 19.9-GHz methanol and 6030-, 6035- and 1720-MHz OH masers, in keeping with the correlation identified by our observations. The plotted brightness temperatures suggest that our sample of 107.0-GHz methanol maser sources have in the range .
We may conclude that the maser models are able to account qualitatively for the detection of 19.9-GHz methanol masers in 9 out of 25 of the 107.0-GHz sources, and are also able to explain the correlation found between methanol emission at 19.9 GHz and OH masers at 6035 MHz. The model calculations suggest that the 19.9-GHz maser sources have gas temperatures around 50 K, dust temperatures 150-200 K, gas density and methanol specific column density , while the sources with no 19.9-GHz maser detected may be higher in gas or dust temperature or lower in gas density. As these estimates were determined in a simplistic fashion by varying only one model parameter at a time, they cannot be considered definitive. A more quantitative comparison between model calculations and observations in individual sources can further constrain the physical conditions which give rise to the observed masers. This is best undertaken after observations at high spatial resolution have clarified the associations between the different masers. The exceptional sources W3(OH), 345.010+1.792 and NGC6334F have been the subject of previous detailed modelling of this type (Sutton et al., 2001; Cragg et al., 2001), and fitting of the maser model to observations of the 25 107.0-GHz maser sources is the subject of ongoing work. For this purpose further model calculations are required to explore the multidimensional parameter space in the regions identified above.
5 Conclusions
We have made the first sensitive search for the 19.9-GHz transition of methanol in the southern hemisphere and detected 6 new sources, taking the total number to 9. There is a strong correlation between sources which show 19.9-GHz methanol emission and those which both have the class II methanol masers projected against radio continuum and have associated 6035-MHz OH. This suggests that the 19.9-GHz methanol masers trace a narrow range of physical conditions, probably associated with a specific evolutionary phase. We have made a preliminary examination of this association in the model of Cragg et al. (2002) and find it to be consistent with a gas temperatures of 50 K, dust temperatures of 150-200 K and gas densities of , although further modelling is required to more thoroughly sample the parameter space.
Acknowledgements
This research has made use of NASA’s Astrophysics Data System Abstract Service. This research has made use of the SIMBAD database operated at CDS, Strasbourg, France. The authors thank David Flower for making methanol rate coefficient data available prior to publication. Financial support for this work was provided by the Australian Research Council. AMS was supported by the Ministry of Industry, Science and Technology of the Russian Federation (Contract No. 40.022.1.1.1102).
References
- Argon et al. (2000) Argon, A. L., Reid, M. J., Menten, K. M. 2000, ApJS 129, 159
- Batrla et al. (1987) Batrla, W., Matthews, H. E., Menten, K. M., Walmsley, C. M. 1987, Nat 326, 49
- Baudry et al. (1997) Baudry, A., Desmurs, J. F., Wilson, T. L., Cohen, R. J. 1997, A&A 325, 255
- Caswell (1998) Caswell, J. L. 1998, MNRAS 297, 215
- Caswell (2003) Caswell, J. L. 2003, MNRAS 341, 551
- Caswell (2004) Caswell, J. L. 2004, MNRAS in press
- Caswell & Haynes (1983) Caswell, J. L., Haynes, R. F. 1983, Aust. J. Phys. 36, 417
- Caswell et al. (1995a) Caswell, J. L., Vaile, R. A., Ellingsen, S. P., Whiteoak, J. B., Norris, R. P. 1995a, MNRAS 272, 96
- Caswell et al. (1995b) Caswell, J. L., Vaile, R. A., Ellingsen, S. P., Norris, R. P. 1995b, MNRAS 274, 1126
- Caswell et al. (2000) Caswell, J. L., Yi, J., Booth, R. S., Cragg, D. M. 2000, MNRAS 313, 599
- Cesaroni & Walmsley (1991) Cesaroni, R., Walmsley, C. M. 1991, A&A 241, 537
- Cragg et al. (2001) Cragg, D. M., Sobolev, A. M., Ellingsen, S. P., Caswell, J. L., Godfrey, P. D., Salii, S. V., Dodson, R. G. 2001, MNRAS 323, 939
- Cragg et al. (2002) Cragg, D. M., Sobolev, A. M., Godfrey, P. D. 2002, MNRAS 331, 521
- Cragg et al. (2004) Cragg, D. M., Sobolev, A. M., Caswell, J. L., Ellingsen, S. P., Godfrey, P. D. 2004, MNRAS in press
- (15) De Buizer, J. M., Piña, R. K., Telesco, C. M. 2000, ApJSS 130, 437
- De Buizer et al. (2002) De Buizer, J. M., Walsh, A. J., Piña, R. K., Phillips, C. J., Telesco, C. M. 2002, ApJ 564, 327
- Dickel et al. (1982) Dickel, H. R., Rots, A. H., Goss, W. M., Forster, J. R. 1982, MNRAS 198, 265
- Dodson & Ellingsen (2002) Dodson, R. G., Ellingsen, S. P. 2002, MNRAS 333, 307
- (19) Ellingsen, S. P., Norris, R. P., McCulloch, P. M. 1996, MNRAS 279, 101
- Ellingsen et al. (2003) Ellingsen, S. P., Cragg, D. M., Minier, V., Muller, E., Godfrey, P. D. 2003, MNRAS 344, 73
- Forster & Caswell (2000) Forster, J. R., Caswell, J. L. 2000, ApJ 530, 371
- Gaume & Mutel (1987) Gaume, R. A., Mutel, R. L. 1987, ApJS 65, 193
- Gray, Field & Doel (1992) Gray, M. D., Field, D., Doel, R. C. 1992, MNRAS 262, 555
- Hartquist et al. (1995) Hartquist T. W., Menten K. M., Lepp S., Dalgarno, A. 1995, MNRAS 272, 184
- Kawamura & Masson (1998) Kawamura, J. H., Masson, C. R. 1998, ApJ 509, 270
- Koo et al. (1988) Koo, B., Williams, D. R. W., Heiles, C., Backer, D. C. 1988, ApJ 326, 931
- Lees & Haque (1974) Lees, R. M., Haque, S. S. 1974, Can J Phys 52, 2250
- Mehringer et al. (1997) Mehringer, D. M., Zhou, S., Dickel, H. R. 1997, ApJ 475, L57
- (29) Mehrotra S. C., Dreizler H., Mäder H. 1985, Z. Naturforsch 40a, 683
- Menten (1991a) Menten, K. M. 1991a, in ASP Conf. Ser. 16, Atoms, ions and molecules: New results in spectral line astrophysics, ed. A. D. Haschick & P. T. P. Ho, 119
- Menten (1991b) Menten, K. M. 1991b, ApJ 380, L75
- Menten et al. (1988) Menten, K. M., Johnston, K. J., Wadiak, E. J., Walmsley, C. M., Wilson, T. L. 1988, ApJ 331, L41
- Menten & Batrla (1989) Menten, K. M., Batrla, W. 1989, ApJ 341, 839
- Menten et al. (1992) Menten, K. M., Reid, M. J., Pratap, P., Moran, J. M., Wilson, T. L. 1992, ApJ 401, L39
- Minier et al. (2000) Minier, V., Booth, R. S., Conway, J. E. 2000, A&A 362, 1093
- Minier & Booth (2002) Minier, V., Booth, R. S. 2002, A&A 387, 179
- Minier et al. (2003) Minier, V., Ellingsen, S. P., Norris, R. P., Booth, R. S. 2003 A&A 403, 1095
- Norris et al. (1993) Norris, R. P., Whiteoak, J. B., Caswell, J. L., Wieringa, M. H., Gough, R. G. 1993, ApJ 412, 222
- Onello et al. (1994) Onello, J. S., Phillips, J. A., Bengalia, P. 1994, ApJ 426, 249
- Pavlakis & Kylafis (1996a) Pavlakis, K. G., Kylafis, N. D. 1996a, ApJ 467, 300
- Pavlakis & Kylafis (1996b) Pavlakis, K. G., Kylafis, N. D. 1996b, ApJ 467, 309
- Phillips (1998) Phillips, C. J. 1998, PhD Thesis, University of Tasmania
- Phillips et al. (1998) Phillips, C. J., Norris, R. P., Ellingsen, S. P., McCulloch, P. M. 1998, MNRAS 300, 1131
- Pottage et al. (2002) Pottage, J. T., Flower, D. R., Davis, S. L. 2002, J. Phys. B 35, 2541
- Pottage et al. (2004) Pottage, J. T., Flower, D. R., Davis, S. L. 2004, MNRAS in press
- Slysh et al. ( 1995) Slysh, V. I., Kalenskii, S. V., Val’tts, I. E. 1995, ApJ 442, 668
- Sobolev & Deguchi (1994) Sobolev A.M., Deguchi S., 1994, A&A, 291, 569
- Sobolev et al. ( 1997) Sobolev A.M., Cragg D.M., Godfrey P.D., 1997, MNRAS, 288, L39
- Sutton et al. (2001) Sutton, E. C., Sobolev, A. J., Ellingsen, S. P., Cragg, D. M., Mehringer, D. M., Ostrovskii, A. B., Godfrey, P. D. 2001, ApJ 554, 173
- Szymczak et al. (2000) Szymczak, M., Hrynek, G., Kus, A. J. 2000, A&ASS 143, 269
- Szymczak et al. (2000) Szymczak, M., Kus, A. J., Hrynek, G. 2000, MNRAS 312, 211
- Val’tts (1998) Val’tts, I. E. 1998, Astron. Lett 24, 788
- Val’tts et al. (1995) Val’tts, I. E., Dzura, A. M., Kalenskii, S. V., Slysh, V. I., Booth, R. S., Winnberg, A. 1995, A&A 294, 825
- Val’tts et al. (1999) Val’tts, I. E., Ellingsen, S. P., Slysh, V. I., Kalenskii, S. V., Otrupcek, R., Voronkov, M. A. 1999, MNRAS 310, 1077
- Walsh et al. (1997) Walsh, A. J., Hyland, A. R., Robinson, G., Burton, M. G. 1997, MNRAS 291, 261
- Walsh et al. (1998) Walsh, A. J., Burton, M. G., Hyland, A. R., Robinson, G. 1998, MNRAS 301, 640
- Walsh et al. (2002) Walsh, A. J., Lee, J. -K., Burton, M. G. 2002, MNRAS 329, 475
- Wilson et al. (1984) Wilson, T. L., Walmsley, C. M., Snyder, L. E., Jewell, P. R. 1984, A&A 134, L7
- Wilson et al. (1985) Wilson, T. L., Walmsley, C. M., Menten, K. M., Hermsen, W. 1985, A&A 147, L19