Fitting the HiRes Spectra and Monocular Composition
Abstract
This paper consists of two sections. In the first section, we discuss our fits to the latest HiRes monocular spectra. We find that the best fit for the extragalactic component has a spectral index of with a distribution of sources varying with a evolution parameter . In the second section, we discuss preliminary results from a new composition measurement using HiRes monocular data. We find a predominantly light spectrum above eV.
1 Fitting the HiRes Spectra
Fitting the ultra high energy cosmic ray (UHECR) spectrum is a common way to attempt to gain understanding of the sources of these particles. These fits often neglect the galactic component of cosmic rays, which is expected to be small at the very highest energies. However, the energy at which at which this becomes true is not known.
Rather than assume a negligible galactic component, we employ a toy model in which composition determines source. In this model, we use the recent composition measurements of the HiRes Prototype/MIA experiment[1] and of HiRes in stereo mode[2]. These are shown in Figure 1. The light component in these measurements, assumed to be protons, is identified with the extragalactic component of UHECRs; the heavy component, assumed to be iron, is identified with the galactic component.

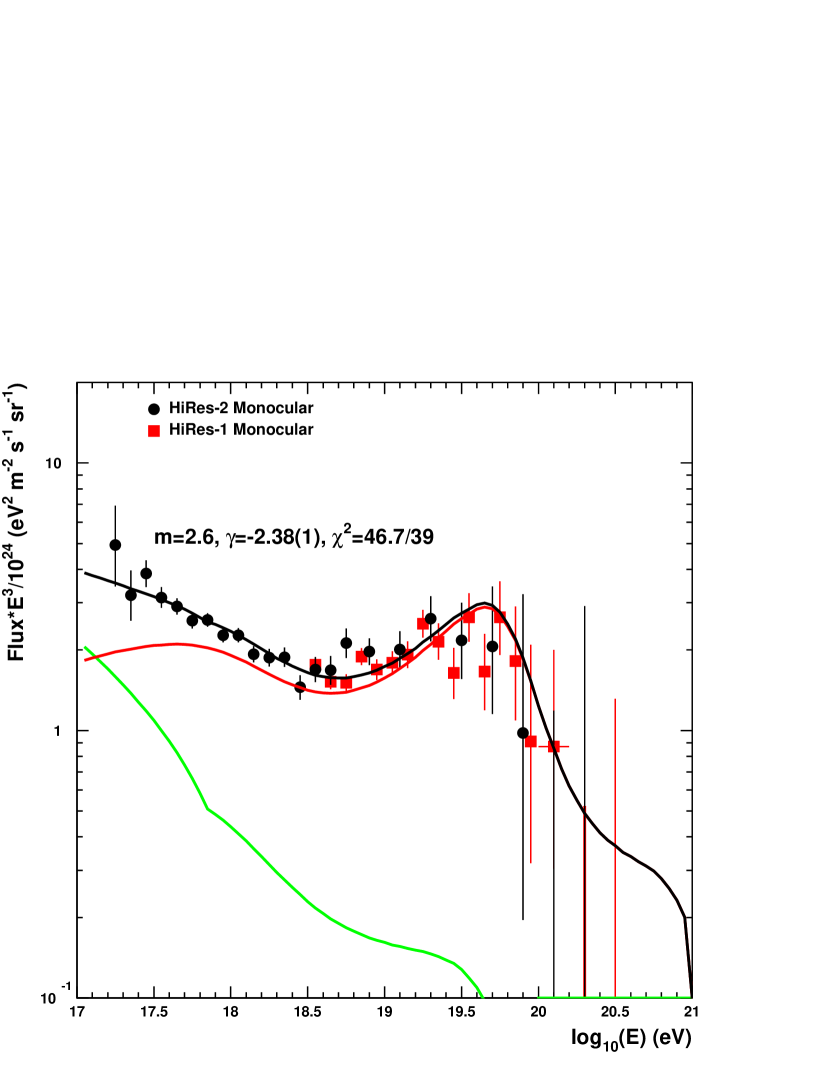
Having identified the extragalactic component of the UHECR spectrum, we fit this component using the assumption that the protons have lost energy between their acceleration and our observation, and that the sources are distributed uniformly throughout the universe, with a density that is smoothly varying in time. The fits assume a simple power law spectrum, , with a spectral index identical for all sources. We use the average energy loss model of Berezinsky et al.[5] to find the observed spectrum from a source a given redshift.
In addition, we use a Monte Carlo (MC) simulation[6] for the discrete energy losses associated with pion production. The MC is only important for propagating particles from small redshifts, , where the proton interacts only a few times. For propagation from larger redshifts, the distribution of observed energies for a given input energy is a gaussian of ever narrowing width.
The MC is run to create an - matrix with two million entries for propagation from each redshift, , to our observation. The - matrix is calculated every 0.01 step in for to . Smaller steps, as small as 0.0001, are used below 0.05. Sources are assumed to be uniformly distributed at any given redshift, and with a density with which varies as . The MC results at individual redshifts are added together to form an - matrix for uniformly distributed sources evolving according given value of . These -integrated matrices were formed for 0 to 5 in steps of 0.5.
The fits are performed by varying the normalization, the spectral slope (), and the evolution parameter (). The goodness-of-fit is evaluated using the binned-maximum-likelihood method. The comparison spectra for fitting are calculated by multiplying a vector containing the input spectrum by the - matrix using matrix multiplication. The input spectrum vectors are calculated every 0.05 in the spectral index . The comparison spectra for intermediate values of and are found by interpolation.
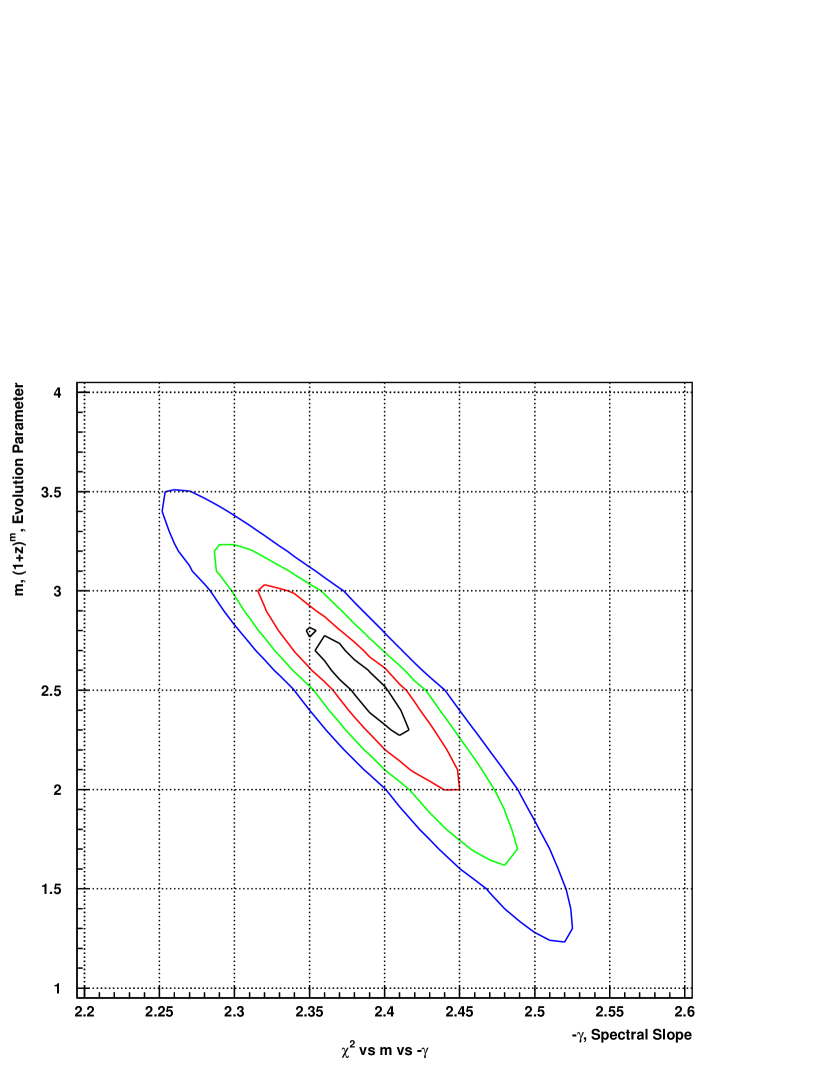
The result of the fit to the most recent HiRes-I[7] and HiRes-II[8] monocular spectra is and . This fit is shown in Figure 2. The quoted uncertainties include the effect of the correlation between and . This correlation is shown in Figure 3. Not included in this fit are any systematic uncertainties. The largest systematic uncertainty is expected to be due to the details of composition used in the aperture calculation for the HiRes-II spectrum. Changes in the composition tend to move the best fit point along the trough of Figure 3, changing the vs. relationship little.
2 HiRes Monocular Composition Measurement
Because the uncertainty in composition is a large part of the uncertainty in the parameters in the fit to the spectrum, we were motivated to try to improve on the existing composition measurements, especially below eV. To go to low energies with HiRes requires using the monocular data sets, and we chose the HiRes-II monocular data set for this analysis.
Unfortunately, the limited elevation coverage of the HiRes-II aperture biases our acceptance, with the bias increasing at lower energies. The bias stems from the requirement that we find within that extent of the shower observed in the detector. Events that are closer to the detector are more likely to have above the visible range, and thus be cut. Furthermore, because lower energies can only be observed close to the detector, events at these energies will have a larger acceptance bias than those at higher energies. This bias precludes performing an elongation rate analysis at energies below eV.
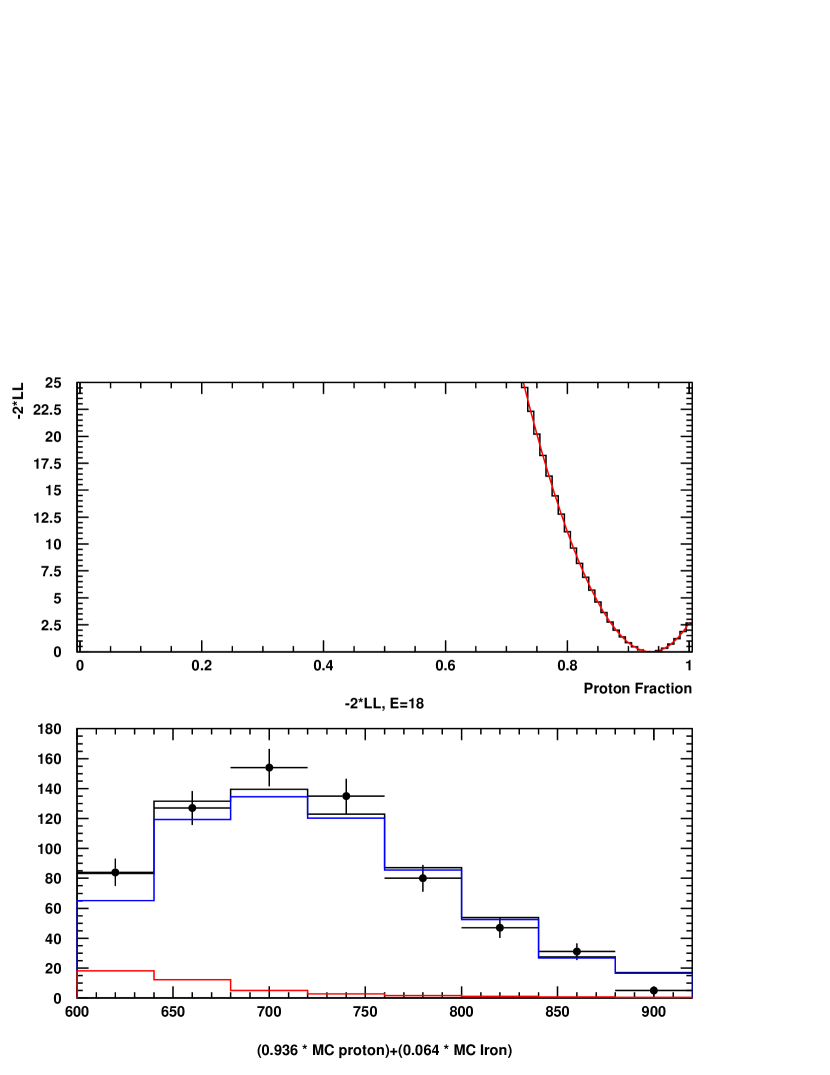
Instead, we have chosen to fit the distribution in energy bins to a combination of MC generated distributions from proton primaries and from iron primaries. The distribution in each energy bin is stored in a histogram, and the data histogram is then compared to a mixture of the proton and iron MC histograms to find the best fit proportion of each. The fit is performed using the binned maximum likelihood technique as implemented in the HBOOK[9] routine HMCLNL. The uncertainty of the fit in each energy bin is taken from the width of as fit to a quadratic in the region about the maximum. An example of this procedure for the bin at eV is shown in Figure 4. The result of these fits for the data at all energies is shown in Figure 5.

This fit gives only the proportion of proton and iron in the final, accepted sample; as such, it is not intrinsically interesting, but must be corrected to find the proton-iron ratio of UHECRs entering the atmosphere. However, one can test this procedure on an independent MC sample where one knows a priori which events are protons and which are iron. The result of this analysis on the MC sample used to calculate the aperture used in the spectrum analysis is shown in Figure 6. The fits agree very well with what is actually in the sample.
The raw composition measurements are corrected using the relative acceptances in the proton and iron MC samples. These are the same MC samples used to provide the comparison distributions used in the fit. The fit proton-iron proportion is interpreted as given numbers of proton events and iron events. These numbers then are separately corrected for the relative acceptance appropriate to each. Finally, the proton-iron ratio is recalculated using the corrected numbers of events of each type.
For a MC sample, we can again compare the corrected proton-iron proportion to the input to the MC simulation. This is shown in Figure 7. In this case, the input is just the HiRes Prototype/MIA and HiRes Stereo composition measurements, where the mean of the data is interpreted as representing a proton-iron proportion given by the distance between the Corsika/QGSJET proton and iron lines. The input is in fact given by linear fits to the mean above and below eV. Again, the corrected results of the fits agree very well with the inputs to the MC.
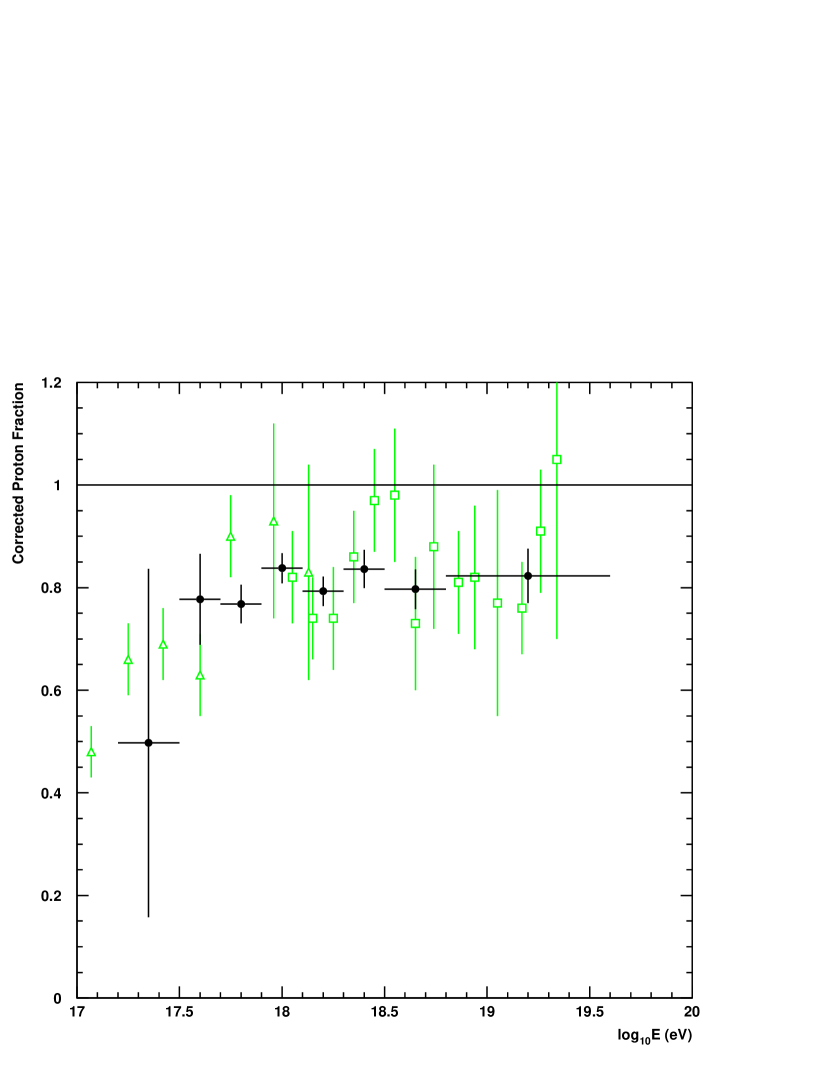
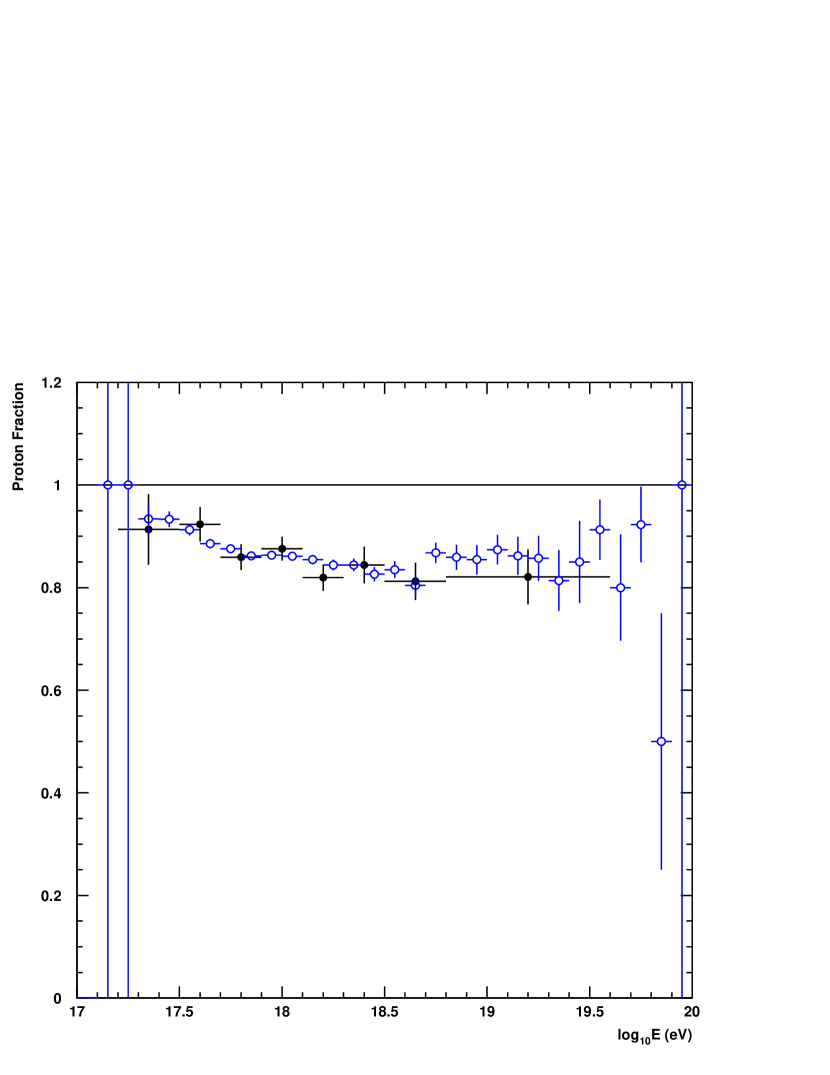
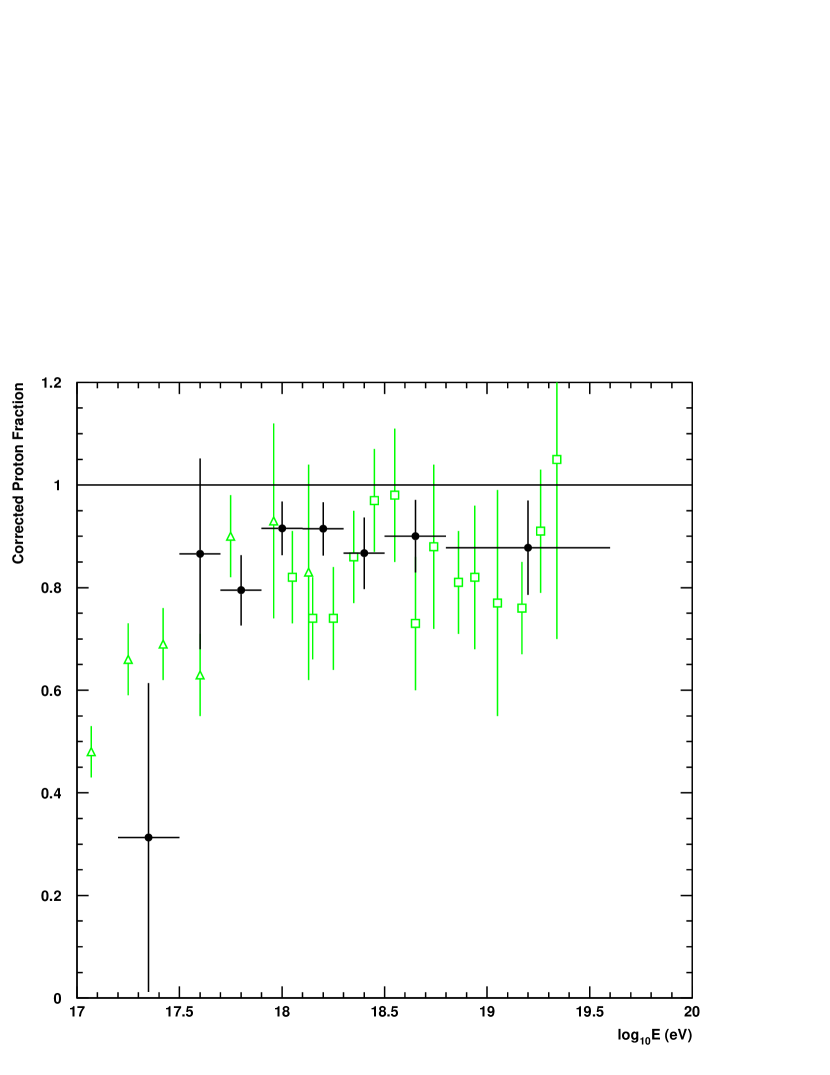
Finally, we show as a very preliminary result, the corrected proton-iron ratio for the data. See Figure 8. This result shows a very light composition (90% protons) above eV. Below this energy we measure a sharply lower composition, but with large uncertainties because of few events and a large acceptance correction. The measured composition at high energies is in agreement with the HiRes Stereo measurement, but closer to being all protons.
The data used in the fits comes from the same data set used in the HiRes-II spectrum analysis which was fit above. A considerable amount of data, about a factor of three more, was collected after this data set. This later data was collected with lower light thresholds, and as such, will have a lower energy threshold. In addition, the aperture at each energy will be increased, reducing the size of biases. Performing this analysis on this expanded data set should give us much tighter constraints on the composition in the middle of the eV energy decade.
The Telescope Array (TA), which has already received Japanese funding, and the TA Low Energy extension (TALE) will be able to push this analysis even further. TALE will use the HiRes phototubes with larger mirrors to push the thresholds even lower. The mirrors will be arranged in a tower rather than a ring to avoid biases in . Geometrical resolution at the level of HiRes Stereo will be provided by coincidences with the TA ground array.
References
- [1] T. Abu-Zayyad, et al., Phys. Rev. Lett. 84 (2000) 4276.
- [2] G. Archbold and P.V. Sokolsky (for the HiRes Collaboration), Proc. of the 28th Int. Cosmic Ray Conf. (2003) 405.
- [3] D. Heck, J. Knapp, J.N. Capdevielle, G. Schatz and T. Thouw “CORSIKA : A Monte Carlo Code to Simulate Extensive Air Showers”, Report FZKA 6019 (1998), Forschungszentrum Karlsruhe.
- [4] N.N. Kalmykov, S.S. Ostapchenko and A.I. Pavlov, Nucl. Phys. B (Proc. Suppl.) 52B, 17, (1997).
- [5] V. Berezinsky, A.Z. Gazizov, S.I Grigorieva, hep-ph/0204357.
- [6] De Marco, Blasi, Olinto, Astropart. Phys. 20 (2003) 53.
- [7] R.U. Abassi et al., Phys. Rev. Lett. 92, (2004) 151101.
- [8] A. Zech, these proceedings.
- [9] HBOOK Manual. http://wwwasdoc.web.cern.ch/wwwasdoc/hbook_html3/hboomain.html