Keck Adaptive Optics Imaging of Field Galaxies from the Hubble Space Telescope Archive11affiliation: All authors are affiliated with the Center for Adaptive Optics.
Abstract
We have employed natural guide star adaptive optics (AO) on the Keck II telescope to obtain near-infrared ( and ) images of three field galaxies, each of redshift greater than 0.5. These are among the highest-redshift non-active disk galaxies to be imaged with AO. Each of the galaxies was chosen because it had been observed previously with the Hubble Space Telescope (HST) Wide Field Planetary Camera 2 (WFPC2) by others. Our AO images in the near infrared (NIR) closely match both the depth and high spatial resolution of those optical data. Combining the archival and data with our new and images potentially produces a long wavelength baseline at uniform resolution. The NIR data probe emission well longward of the 4000 Å-break at these redshifts, and provide stellar fluxes less contaminated by dust. We fit two-dimensional galaxy bulge-plus-disk models simultaneously in all bands, and compare stellar-population-synthesis modeling to the photometry of these separated components. This is an initial foray into combining HST and AO imaging to produce a high spatial-resolution multi-color dataset for a large sample of faint galaxies. Our pilot program shows that NIR AO images from large ground-based observatories, augmented by HST images in the optical, can in principle provide a powerful tool for the analysis of faint field galaxies. However, the AO data will have to be increased, and AO PSFs need to be controlled more carefully than they were here.
1 Introduction
Disentangling the evolutionary histories of bulges, disks, and star-formation regions is a complicated endeavor. As reviewed by Wyse, Gilmore & Franx (1997) bulges are not universally old small ellipticals inhabiting the centers of young disks. De Jong (1996) and Peletier & Balcells (1996) have shown that, at low redshift, there is a strong relationship between bulge color and disk color. Their near-infrared (NIR) -band imaging avoids the confusion caused by extinction and indicates that there is a wide range of bulge colors, but for a given galaxy the disk and bulge colors are similar. This may imply similar ages and metallicities of the stellar populations in each galaxy, and perhaps a shared evolutionary history. At high redshift, Schade et al. (1995) find, in a small sample of galaxies with Hubble Space Telescope (HST) and imaging, not only “normal” blue galaxies with exponential disks and red galaxies with prominent bulges, but a significant population of bulge-dominated blue galaxies - the so-called “blue nucleated galaxies” (BNG) - which may be bulges undergoing active star formation. For galaxies at redshift in the HDF, Abraham et al. (1999) showed that Wide Field Planetary Camera 2 (WFPC2) and colors could be used to separate mean stellar population age from extinction. Studying the stellar populations of galaxies would be improved by obtaining broadband color data over an even wider range of wavelengths. Not only would this help distinguish between age and extinction, but population models (e.g., Bruzual & Charlot 1993) show that mass-to-light ratios are much less sensitive to population age beyond 1 micron rest wavelength. Thus, measurements of structural parameters at NIR wavelengths should give a much truer picture of the stellar mass distribution. For galaxies with , the filter desirably samples rest-frame , which is below the 4000 Å-break. However, NIR colors then become even more important because to sample rest-frame wavelengths longward of 1 micron requires -band data.
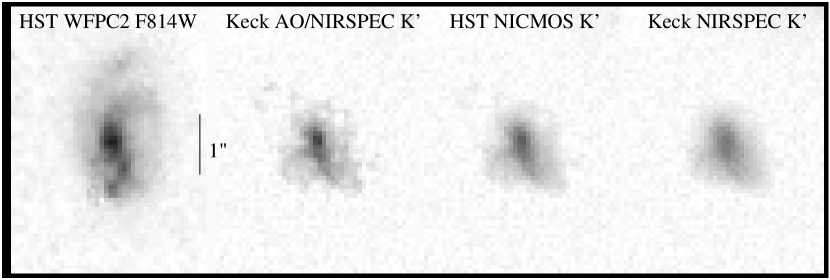
To be of any use, such multi-wavelength data must resolve the galaxies spatially, certainly with resolution better than the typical size of bulges. Low redshift samples (e.g., (Andredakis, Peletier, & Balcells, 1995)) suggest that the mean effective radius of bulges might be as small as 1.2 kpc. This would correspond to 020 at ( km Mpc, , ; these cosmological parameters will be maintained throughout the text). The data should ideally cover a large sample of faint galaxies over a significant range in redshift. The only means of obtaining such high-resolution images in the optical ( and ) is with HST. However, the best match to these data in the NIR ( and ) is not provided by the HST NIR camera NICMOS, but rather by ground-based AO. The small aperture of HST means that in the NIR its resolution is limited to about 03. A 10 m class ground-based telescope equipped with AO can in principle achieve better than 01. Figure 1 shows a WFPC2 F814W image of the galaxy JHU 2375 and a Keck AO image (using the NIRSPEC camera) resampled to the WFPC2 pixel scale (these data will be discussed later in the text). Next to this is the original image smoothed to simulate the larger diffraction pattern for NICMOS (PSF FWHM of 03). The image furthest to the right simulates the image under natural seeing conditions (PSF FWHM of 05). The resolution and per-pixel in the WFPC2 and AO data are similar and are both noticeably better than either the non-AO ground-based image or the simulated NICMOS image. This is a definite advantage for large ground-based telescopes with AO, but a limitation of Keck and other AO systems (in the absence of laser beacons) is that they can correct only small regions of sky near bright stars. This precludes for the immediate future a large sample with, say, 1000 faint galaxies with high-spatial-resolution data in both the optical and NIR.
The Keck AO system requires a natural guide star for optimal correction, which can potentially yield Strehl ratios (the ratio of the guide star peak to the peak value of a perfect telescope diffraction pattern) better than 0.4 and provide resolution under good seeing conditions. The AO point-spread function (PSF) has a sharp diffraction-limited core superimposed on a broad seeing-limited halo. Anisoplanatism dramatically degrades this on-axis image quality with increasing offset from the quide star, but it is the Strehl ratio and not resolution that suffers most. The size of the halo changes very little with offset, but as the Strehl ratio worsens the contrast between the halo and the central peak drops. Typically, the resolution 30″ off-axis from the guide star will be about , with a PSF Strehl ratio closer to 0.05. Thus for our purposes the combination of anisoplanatism and guide-star brightness limits the available sky to within about 30″ of stars. We cross-correlated the HST Guide-Star Catalog and HST Archive to find all WFPC2 pointings that can be reached with Keck that include such stars. The tendency of WFPC2 observers to avoid bright stars - to prevent saturation and limit scattered light - made these coincidental pointings rare. We found 38 previous WFPC2 pointings that satisfied this requirement, but only 13 had more than 2000 seconds of integration, and only two, Selected Area 68 (SA68) and the Groth Survey Strip (GSS), had been targeted by previous galaxy redshift surveys. Spectroscopic redshifts are essential to establish the true physical size and scale of these objects. As it happened, both SA68 and GSS had been surveyed by us or our collaborators through the Deep Extragalactic Evolutionary Probe (DEEP) project. In addition to redshifts, some of our Keck LRIS spectra were of sufficiently good quality to provide mass estimates from linewidths and rotation curves. Redshifts were in hand for 15 galaxies in SA68 and GSS that were (a) within 30″ of the guide-star, and (b) had deep WFPC2 and images. Of these, 7 are in SA68, and 8 are in GSS. About half of these galaxies have redshifts greater than 0.5.
This work involved a pilot program of deep imaging of field galaxies with Keck AO that was designed to provide similar depth and resolution in the NIR as that provided by HST in the optical. A future sample of hundreds of galaxies will be obtained as part of the Center for Adaptive Optics Treasury Survey (CATS). The aim of CATS is to use HST’s Advanced Camera for Surveys (ACS) and Keck AO (first with natural guide stars, and then with the laser when it becomes available) to separate galaxy stellar populations (in the GOODS-North field) into bulges, disks, and star-formation regions and determine relative mean ages. The addition of the NIR data will provide a means of accurately determining the bulge-to-total flux ratio, , of the galaxy for the mature stellar populations, far less corrupted by dust and recent star formation. For now, we present Keck natural-guide-star AO observations of three field galaxies with which had already been imaged with HST WFPC2. In Section 2 the combined HST and Keck dataset and its reduction is outlined. The modeling results are presented in Section 3 and compared to the available kinematic information in Section 4. Our conclusions follow in Section 5.
2 Data and Reductions
The HST WFPC2 F606W and F814W data in SA 68 were obtained during the Cycle 6 program 6838 (PI: Kron). The WFPC2 data in GSS were obtained for program 5090 (PI: Groth) during Cycle 4. Both programs were designed to probe the morphology of faint galaxies in the optical, and thus deep exposures were made. In SA 68 exposure times were 2400 s in and 2600 s in ; in GSS they were 2800 s in and 4400 s in . Structural parameters such as disk scale length , inclination , bulge effective radius , ellipticity , orientation , and bulge fraction have been derived for our targets by Holden (2001) (in SA 68) and Simard et al. (2002) (GSS), but this is the first time the WFPC2 images have been published. The archival WFPC2 data used in this work were processed by members of the DEEP collaboration. These images were combined using standard Space Telescope Science-Database Analysis System tasks and rotated to the proper orientation based on information contained in the image headers. The signal-to-noise ratio of the HST images is very good. For the brightest structures the per-pixel (assuming noise due solely to Poisson statistics) approaches 100, but is more typically about 20. The fainter structures, such as disks and possible spiral arms, have per pixel. The HST WFPC2 F606W and F814W data were transformed to standard Johnson and according to the prescriptions in Simard et al. (2002). The point-spread function (PSF) for the WFPC2 images was determined by measuring a bright but unsaturated star in the field.
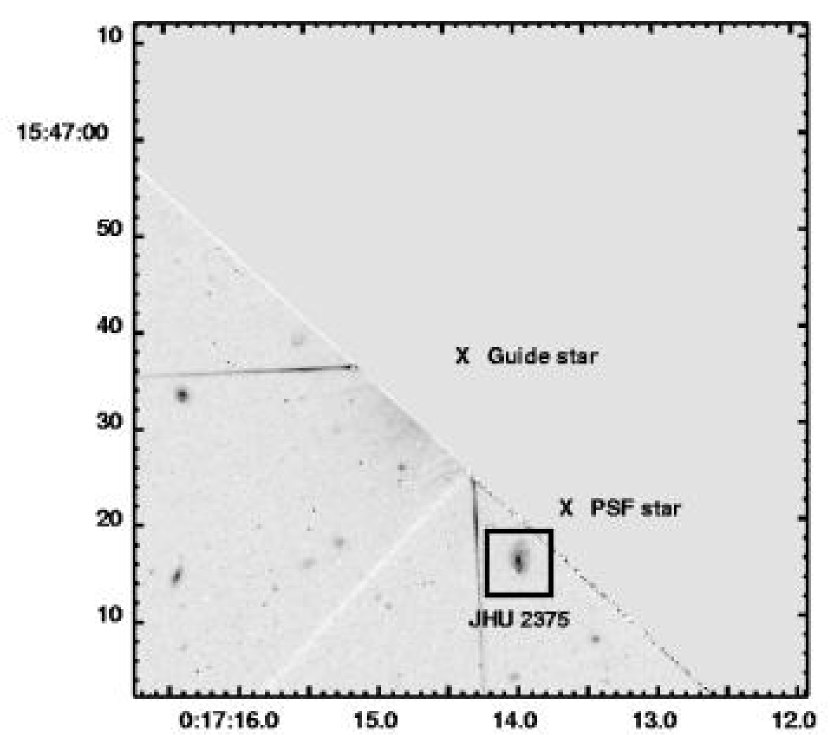
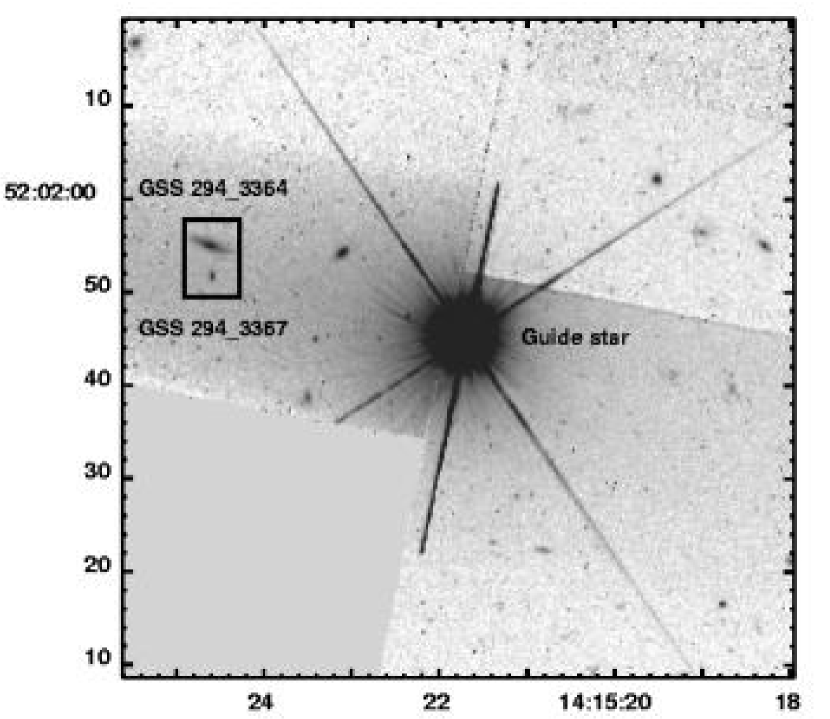
We obtained Keck II AO observations during observing runs in August 2000 and May 2001. A journal of the observations is given in Table 1. See Wizinowich et al. (2000) for a discussion of the Keck II AO instrument and its performance. In all observations a star was used as a guide. The uncorrected seeing during our runs was not routinely monitored, but our AO corrected images suggest that it was never much better than 07 in . We made observations through standard and filters. The band provides the largest possible wavelength difference relative to the HST data and should give the best discrimination between young and old stellar populations. On the other hand, band should give a better combination of good AO correction and low sky noise. Because the dedicated NIRC2 NIR camera was not yet available, the NIRSPEC spectrograph slit-viewing (SCAM) camera was employed as the imager (McLean et al., 2000). This is a HgCdTe array providing a 45 45 FOV with 00175 pixels. Exposures of either 150 s or 300 s each were made in a non-repeating rectangular dither pattern with 2″ steps. Total exposure times of 2400 s to 3000 s provided images covering roughly 7″ 7″. Their locations within the WFPC2 images are indicated in Figures 2 and 3. In all cases the AO data were resampled to match the 00996 pixel sampling of the WFPC2 data. No smoothing was done prior to resampling. The quality of the AO data is poorer than WFPC2, but not hugely so. It was greatly improved by resampling to the larger WFPC2 pixel scale. The best per-pixel (at the WFPC2 pixel scale) we obtained for the AO data is 26.5, with more typical values between 3 and 10. Photometric calibration of the August 2000 data was made by observing standard stars from the United Kingdom Infrared Telesope catalog (Hawarden et al., 2001). In May 2001 a standard star field in the globular cluster M 5 was used to transform to standard Johnson and .
Before we discuss the characterization of our data, a brief introduction to the problem of determining the AO PSF is in order. A more detailed discussion can be found in Steinbring et al. (2002). The basic points are as follows: Fainter stars result in poorer correction, and for a given guide star brightness the AO PSF is worse with decreasing wavelength , and varies with time and position. The best and most stable correction is obtained at the longest observable . To first order, correction worsens with decreasing Fried parameter , which has a dependence (see, for example, (Roddier, 1999)). Thus correction is generally poorer in than in . Temporal variation in the correction is due to fluctuations in , so one must continuously monitor the variation in PSF with seeing. The spatial variation is due to anisoplanatism, which is inversely proportional to . Because of the dependence of , we would also expect the isoplanatic angle to be smaller with shorter wavelength; only as big in as in . Thus for a given the AO PSF is always worse at shorter wavelengths and always worse farther from the guide star. One further complication is that the AO PSF is also anisotropic, which means that for any significant offset it is elongated towards the guide-star. Non-radial variation in the PSF as a function of azimuth about the guide star is expected to be small. Thus it is probably sufficient to simply measure the radial dependence of the PSF and rotate it to account for any difference in guide-target position angle.
Our observations were all at offsets of approximately 30″ from the guide star, where anisoplanatism significantly degraded the PSF. Thus on-axis calibration observations give an optimistic estimate of the target PSF. Off-axis PSF measurements can be made at offsets of 30″ or more, or made with a shorter wavelength filter than that used during the science observations - or both. These measurements therefore give a pessimistic PSF estimate. Together, the on-axis and off-axis PSF measurements provide a range of possible PSFs, an optimistic “best-case” PSF and a pessimistic “worst-case” PSF, with the true (unknown) PSF somewhere in between.
We obtained on-axis PSF estimates by interleaving target observations with short exposures of the guide star. We began each set of observations with a measurement of the guide-star PSF, returned to it at 10 to 30 minute intervals, and finished by observing it a final time. These were combined to determine the time-averaged on-axis PSF.
Off-axis PSF estimates were obtained by observing stars at offsets similar to or slightly larger than those of the targets. For JHU 2375 (in SA 68), a nearby star was well situated for this task. This star was within 10″ of the target and at roughly the same offset from the guide star (see Figure 2). It was observed immediately after target observations were completed (within just a few minutes), but as the seeing conditions were worsening. It therefore gives an appropriate worst-case PSF estimate. The angular dependence was accounted for by rotating the image to account for the difference between PSF reference star and target position angles. The targets in GSS, unlike SA 68, had no convenient nearby star for determining the target PSF. Thus, calibration observations of the off-axis PSF had to be taken in a different field, and for practicality, after all of the scientific observations were complete. To help minimize uncertainty in the temporal PSF variation, the anisoplanatic dependence was estimated by obtaining a calibrating mosaic image of a crowded stellar field. The value of a mosaic over a sequence of on-axis and off-axis measurements is that coincident stars in the small regions of overlap between each pair of observations could be used to determine if the seeing had varied during construction of the mosaic. The globular cluster M 5 was used. The small FOV of SCAM required a mosaic with 6 individual pointings to create a strip covering roughly 7″ 35″. This mosaic was constructed as quickly as possible, in under 10 minutes, hopefully before seeing conditions could change dramatically and spoil the calibration. The overlap regions confirm that the temporal variations were small. The mosaic was observed using a guide star of brightness similar to the GSS observations (), and at a similar airmass. We used an filter in order to record the worst-case PSF. A star at an offset slightly larger than that of the target observation was used as an estimate of the target PSF. Again, the angular dependence was accounted for by rotating the image to the same orientation as the target observations.
The FWHMs of the AO and HST PSFs were determined by fitting them with a two-dimensional Gaussian using the IRAF task IMEXAM. Our off-axis AO data have modest Strehl ratios. As with uncorrected ground-based data, a Gaussian is a reasonable model for these PSFs. Our higher Strehl ratio on-axis AO PSFs have a more centrally concentrated core, but retain the broad halo. Thus a Gaussian slightly overestimates the FWHM of those PSFs. There is probably a similar bias towards overestimating the FWHM of the HST data as the WFPC2 PSF also has a sharp core and broad halo, although in this case the halo is from scattered light in the optics (Holtzman et al., 1995). For either the AO or HST data it is better to overestimate rather than underestimate the PSF width for a conservative estimate of whether a given image resolves a galaxy. The measured PSF FWHMs are presented in Table 2. For the GSS galaxies the resolution of the AO images was between 012 and 024, a reasonable match to the 017 to 020 resolution afforded by HST WFPC2. For JHU 2375, however, the AO PSF may have been as poor as 031.
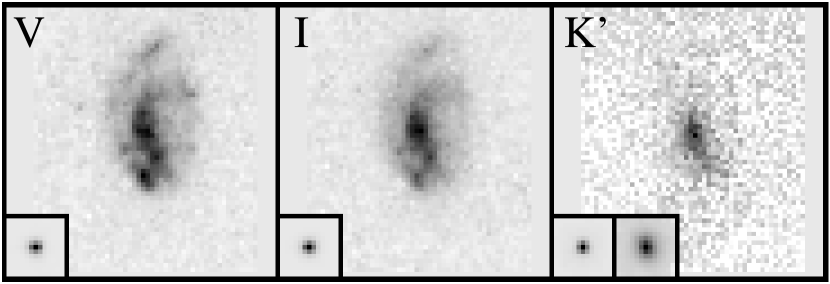
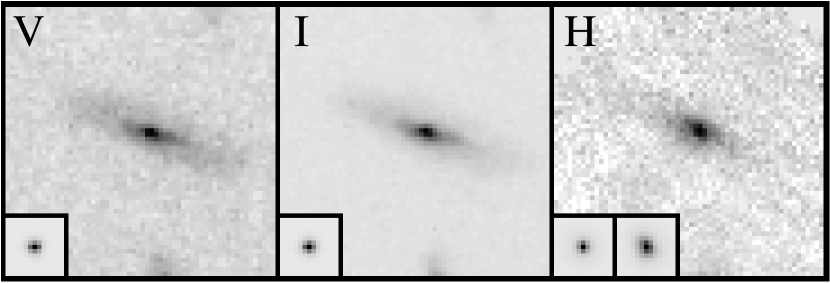
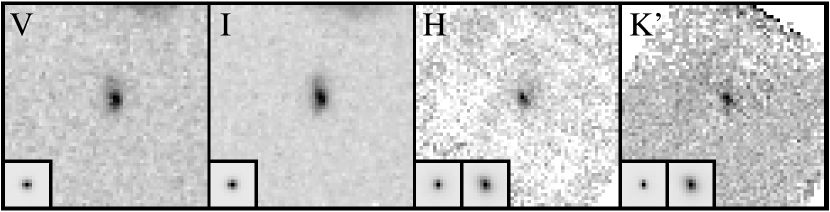
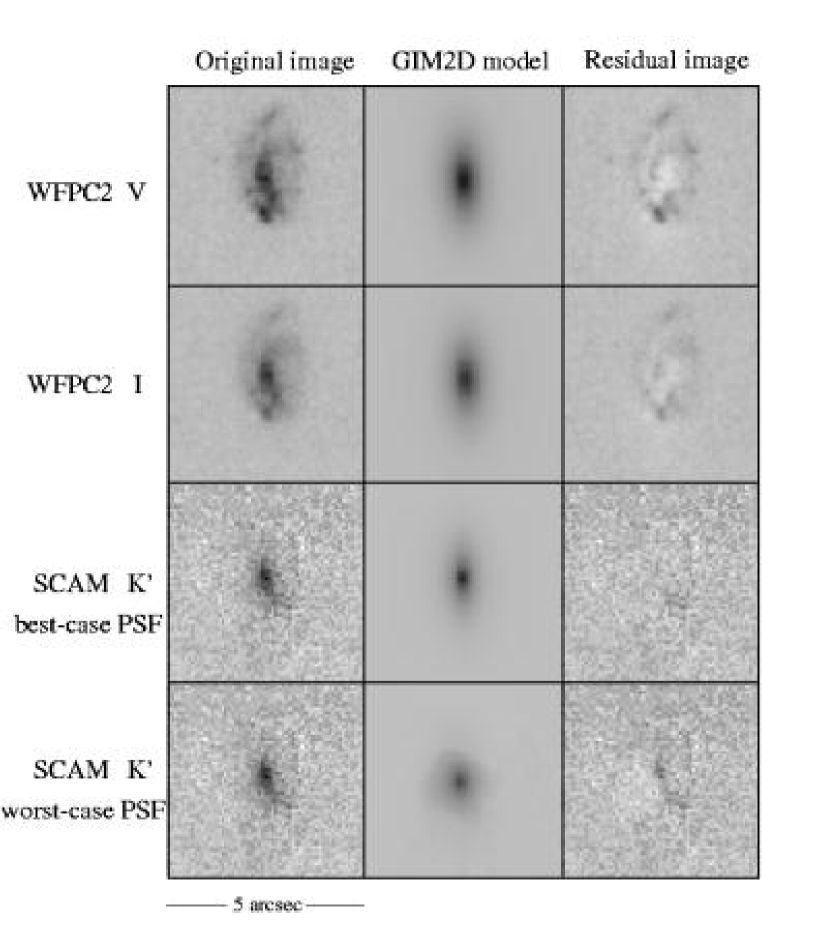
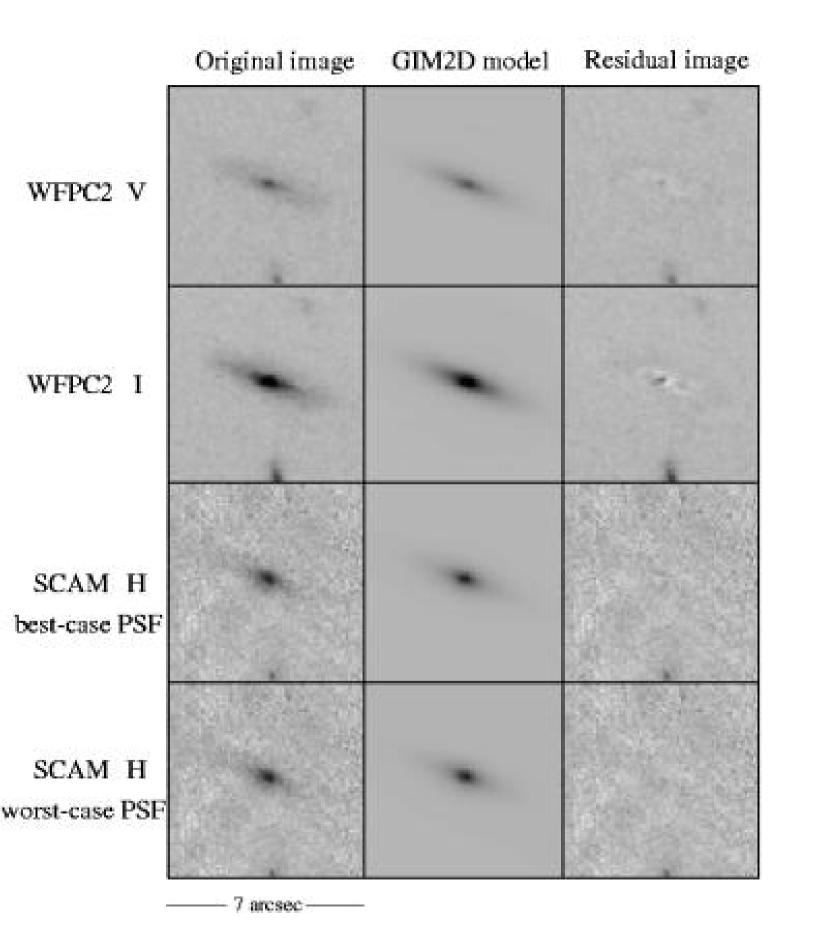
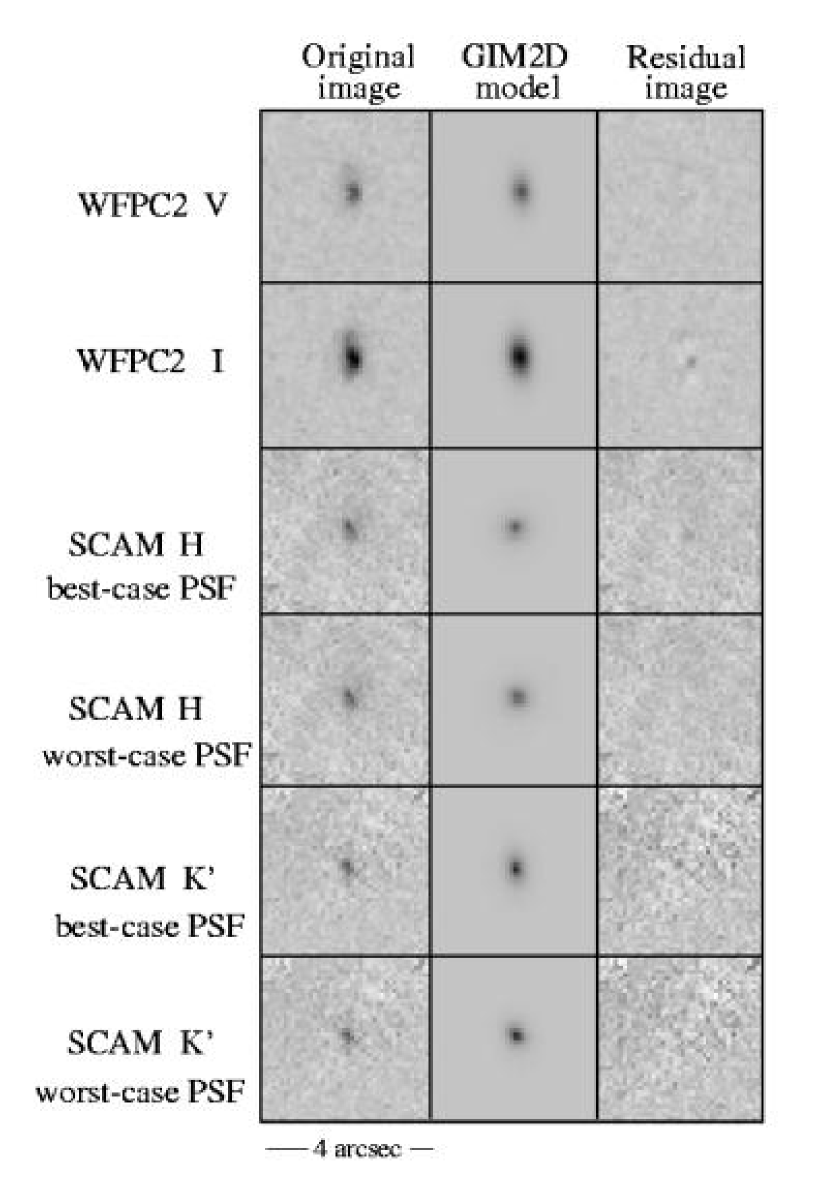
The images of all three galaxies are shown in Figures 4, 7, and 9, including the HST data. Each field is 6″ 6″, with north up and east left. The best and worst-case PSFs for each filter are inset in the lower left corner.
2.1 JHU 2375
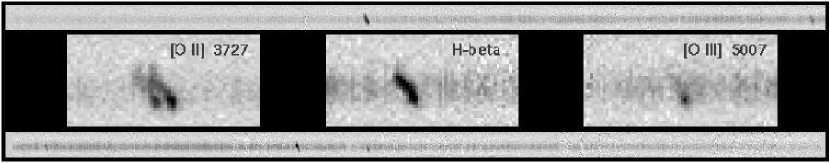
The WFPC2 and images reveal a great deal of structure in JHU 2375. The redshift of this galaxy is . The disk is easily discernible in both images. Two long faint structures to the north may indicate spiral arms. These structures are also fainter and more diffuse in the image. In both images an arc of emission extends (about 9.4 kpc in the rest frame of the galaxy) south from the bright central core. It terminates in a smaller compact structure, whose bluer (roughly rest-frame ) color may indicate a region undergoing active star formation. The DEEP LRIS spectrum for JHU 2375 seems to confirm this (Phillips, A.C. 2003, private communication). It is shown in Figure 5. The regions around prominent emission lines are enlarged. Each inset is about 4″ high and oriented with north up. The H- emission is fairly uniform within the galaxy, but the strong [O III] line and the [O II] doublet are noticeably enhanced at the site of the southern knot. The rotational velocity is easily derived from the strong [O II] doublet and is found to be km .
Our AO image clearly shows that the central region has a compact core. Figure 6 shows a minor-axis profile across the galaxy peak in these data, spanning 2″ east to west. Overplotted are the best and worst-case PSF estimates as dashed and dotted lines, respectively. The peak is marginally larger than the best-case PSF, but the worst-case PSF is probably too broad, and may in fact be broader than the galaxy. The core in our image is also elongated towards the south, consistent with its shape in the HST data. More striking is that the possible star formation region at the southern tip of the galaxy is not visible here. Its absence may be due to the poorer of our data, but if not it suggests that this population is young and probably not a second nucleus (already unlikely due to the uncomplicated rotation curve) or an infalling satellite, for example. The faint nebulosity of the disk may also be detected in our image but it is only barely discernible.
2.2 GSS 294_3364
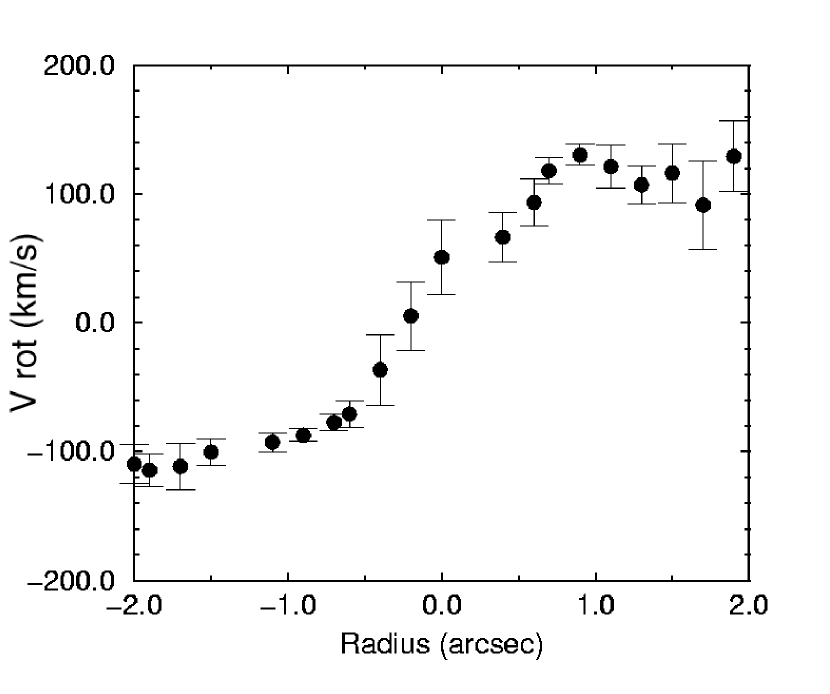
The WFPC2 and images of GSS 294_3364 () are very similar to each other. They reveal a very smooth nearly edge-on disk which may be as much as 5″ in extent ( kpc in the rest frame), aligned northeast to southwest. This smooth structure is mirrored in the rotation curve derived from [O II] doublet in the DEEP LRIS spectrum (see Figure 8). After correction for slit position angle (40.5 degrees) and the disk inclination indicated in the WFPC2 images the derived rotational velocity is km (Vogt, N.P. 2003, private communication). The HST images also reveal a compact bulge. Our band AO image resolves this bulge as well, and also indicates the faint disc running diagonally across the image.
2.3 GSS 294_3367
The WFPC2 image of GSS 294_3367 () shows the galaxy to be very small, less than 1″ in extent (only 6 kpc in the rest frame), with a compact core elongated north-south. The image is similar, but with some indication of faint nebulosity to the north. Our and AO images confirm the core to be very compact, spanning only a few pixels. Some of the elongation in our images may be, in part, an artifact of our noncircular PSF. Both GSS 294_3367 and GSS 294_3364 are resolved, however, in the AO data. Figure 10 shows a profile of both galaxies. It is a 6″ long slice running south to north across the peaks of each. The worst-case PSFs are overplotted as dashed lines. This plot suggests that even with the worst-case, broadest PSF, both galaxies would be resolved, if only marginally for GSS 294_3367.
3 Analysis
The galaxies were resolved in all of the images. How well resolved is a determining factor in the measurements of and the photometry, and hence in the relative ages and star-formation histories of bulge and disk. Because we can only set limits on the range of possible PSFs, a natural approach is to carry out these analyses in two separate streams: one for best and one for worst PSF. We fit the data in each band with two-dimensional bulge-plus-disk galaxy models, one model assuming the best case, and the other the worst case PSF. The output photometry of the bulge and disk components was then compared to the results of simple stellar poplulation models, guided by the available kinematic information.
3.1 Galaxy Structural Parameters and Photometry
To determine bulge and disk photometry, we fit each galaxy in our sample with a de Vaucouleurs bulge plus exponential disk model using GIM2D (Marleau & Simard 1998, Simard et al. 2002). Although GIM2D can model profiles for any , we chose because the of our AO data was too poor to discriminate between other possible values. This precludes a direct comparison of our bulge sample with those of local galaxies, which seem to have (e.g. Balcells et al. (2003)). GIM2D models a galaxy’s total flux, , bulge and disk sizes and orientations, and galaxy pixel center from an input image, or simultaneously from multiple images. Bulge-plus-disk models are convolved with an input PSF and directly compared to data during an optimization with the Metropolis algorithm (Metropolis et al., 1953). Once the algorithm converges, 99% confidence intervals are determined via Monte-Carlo sampling of parameter space.
We first fit GIM2D models simultaneously to and band images of the galaxies, as these images typically had higher signal to noise than those in the NIR filters. This is the same procedure employed by Holden (2001) and Simard et al. (2002) and reproduces their results for the WFPC2 data. Our version of GIM2D is not capable of simultaneous fits in three or four bands, so disk sizes , bulge effective radii , inclinations , and orientations were then locked to the values determined from the and images so that only total flux, , sky background values, and galaxy pixel centers were allowed to float in models from images in other filters. The input PSFs were those described in Section 2. GIM2D fits from WFPC2 images were run with a single input PSF in each band. The NIR SCAM images were run twice in each band, each with the two different input PSFs: best and worst. We note that particularly in the cases of the worst PSFs, GIM2D did a poor job of centering the model, so object centers were determined through an iterative process of fixing centers by hand in several different positions. The output model with the best reduced- measurement was taken to have the best-fit center.
Figures 11 - 13 show the results. The column of panels on the left is WFPC2 and SCAM data. Best-fit models for each are displayed in the center column, and the best and worst PSF cases for the AO data are shown. The residuals are to the right. The WFPC2 PSF is well determined and so the negative residuals from modelling the and images, especially for JHU 2375 (Figure 11) and GSS 294_3364 (Figure 12), may indicate dust in the disks of these galaxies. Notice the prominent positive residual at the southern tip of JHU 2375. This is the location of the possible star formation region discussed in Section 2.1. The amplitude of the NIR residuals allows us to constrain the AO PSF somewhat, at least for JHU 2375. The higher amplitude of the JHU 2375 worst-case residuals suggests that the best-case PSF is favored here. The residuals for the other two galaxies are in the noise, which therefore provide no constraint on the PSF.
The resulting structural parameters for all the galaxies are shown in Table 3, quoted with 99% confidence limits. The results for the WFPC2 and data are those for Holden (2001) (JHU 2375) and Simard et al. (2002) (GSS 294_3364 and GSS 294_3367). Two of the galaxies (JHU 2375 and GSS 294_3367) are clearly disk-dominated in the WFPC2 images, with essentially no bulge being detected above the level of the noise. We fixed our disk and bulge radii based on the WFPC2 data. It therefore may seem puzzling that we obtain in the NIR for JHU 2375 and GSS 294_3367. But note that even without detecting the bulge the WFPC2 data still provide an upper constraint on bulge size, and it is the bulge radius which is maintained for the NIR models. For example, the and JHU 2375 data permit SCAM models with assuming the best-case PSF. If the AO PSF is broader, the model bulge is also broader, and the upper limit on is relaxed to as much as 0.54 based on SCAM. In Section 2.1 we noted, however, that the true could not be much worse than the on-axis case and so the value must be less than about 0.5. The discontinuity in the measurements for JHU 2375, from less than 0.01 to potentially 0.5, is still a concern though. The situation is similar for GSS 294_3367. Due to the small size of this galaxy in and , if one assumes either the best-case or worst-case and PSFs the bulge and disk models have almost the same radius. Because the bulge model falls off more slowly with radius than the disk, this inflates the values to almost 1. The remaining galaxy, GSS 294_3364, had significant values in all bands, and the optical and NIR results were more consistent, especially between () and ().
Bulges were not unambiguously detected in two of our three galaxies. Even so, we attempted to detect any varying position angles of the galaxies’ isophotes, especially between the HST and AO data. Large deviations between the bulge and disk PA for a galaxy might be an indication of a bar. This suggests no evidence of bars in the HST data, since for each galaxy the disk and bulge PAs are consistent. One might hope that the indications of a bar would be stronger at longer wavelengths, where such signatures are more prominent. To test this we repeated the NIR bulge-plus-disk decomposition, but allowed both the and PA to vary. The differences in returned NIR PA between the initial run and when PA was allowed to float were large ( degrees). However, the uncertainties were equally large due to the noisy NIR images. Therefore we see can see no evidence of bars from our AO data.
The photometry of the separated bulge and disk components was derived from the total fluxes and the for each galaxy, assuming best and worst PSFs and the zeropoints discussed in Section 2. Bulge magnitudes therefore correspond to limits that have been propagated from the total magnitude measurements and their uncertainties. Total, bulge, and disk colors are presented in Table 4; errors again represent 99% confidence limits. Our NIR total magnitude of (in Vega magnitudes, which we will maintain throughout) for JHU 2375 is roughly consistent with the value of measured with Keck NIRSPEC without AO by Cardiel (2000, private communication). We do not quote worst-case PSF photometry for JHU 2375 because this PSF seemed to be broader than the galaxy core (see Section 2.1). The label “knot” refers to the region of possibly very young stars at the southern tip of the galaxy. Notice that for GSS 294_3364 and GSS 294_3367, assuming a worst-case PSF permits a higher total brightness for the galaxy. This is expected because the broader PSF wings will make the galaxy model larger and thus it will include more light. If the PSF estimate is too broad this may provide an overestimate, however, because the broader wings will tend to underestimate sky flux.
Noise in the images and PSF uncertainty both affect the accuracy of the output bulge and disk photometry. To isolate the effect due only to noise, we ran GIM2D on model galaxy images with artificial noise added to match the noise characteristics of our WFPC2 and SCAM data. We used the best-fit models as input model images and generated ten noise realizations per filter. Input PSFs were chosen to match those used to generate the model images. That is, we assumed perfect knowledge of the input PSF and estimated the error due to noise. We find that output GIM2D-modelled bulge and disk properties match the known properties of the input model images within the errors, indicating that, for a known PSF, photometric error is attributable to noise in the image. For the real data we do not know the true input PSF, only a range of possible PSFs, so our resulting color estimates are bounded by the best and worst PSF values plus their photometric uncertainties.
3.2 Comparison to Stellar Population Models
We compared an updated version of the Bruzual & Charlot (1993) population synthesis models (Charlot 1998, private communication) with the data. We selected the models using the Padova isochrones and a Salpeter initial mass function (IMF) (Salpeter, 1955) with lower and upper mass cutoffs of 0.1 and 125 , respectively. These models include stellar populations with five metallicities: , 0.004, 0.008, 0.02 and 0.05.
From the single-stellar-population models, we can construct spectra for arbitrary star formation histories by adding together the single-stellar-population spectra from various ages, weighted appropriately. To examine the widest possible range of star formation histories, we constructed two extreme models: a population that passively evolves (that is, there is no active star formation) after a brief (100 Myr) burst, and one that maintains a constant star formation rate. Two extreme metallicity cases for these two models were developed, one metal rich (), the other metal poor (). The resulting spectra represent populations of ages from 1 Myr to as much as 14 Gyr. To construct the , , and colors for these spectra, we shifted the spectra to the redshift of the observed galaxy (which will, of course, restrict the age of the oldest possible populations) and then convolved the spectra with the appropriate filter bandpasses.
In addition to metallicity, star formation history, and age, we need to examine the effects of dust extinction. For this purpose we used the Calzetti (1997) dust attenuation curve. We calculated the extinction in observed , , and and parameterized our models by color excess.
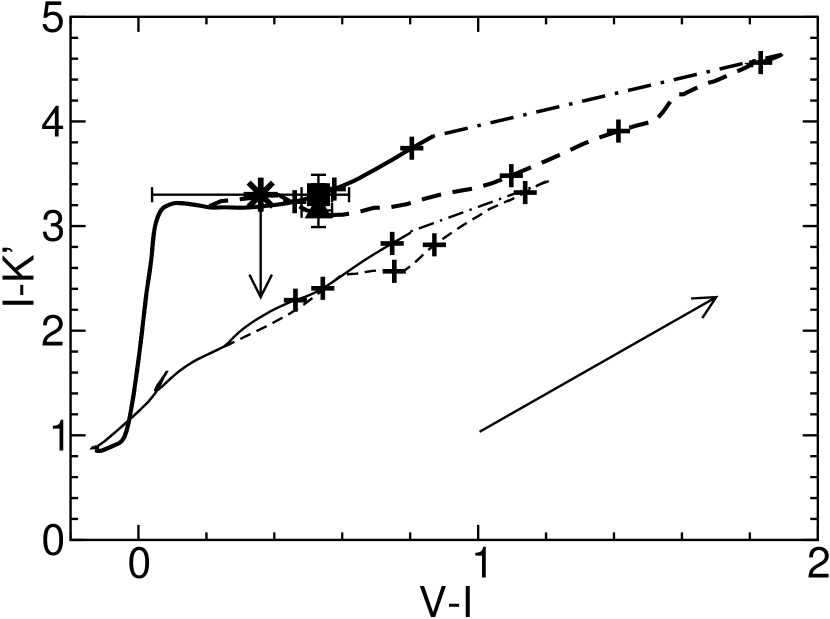
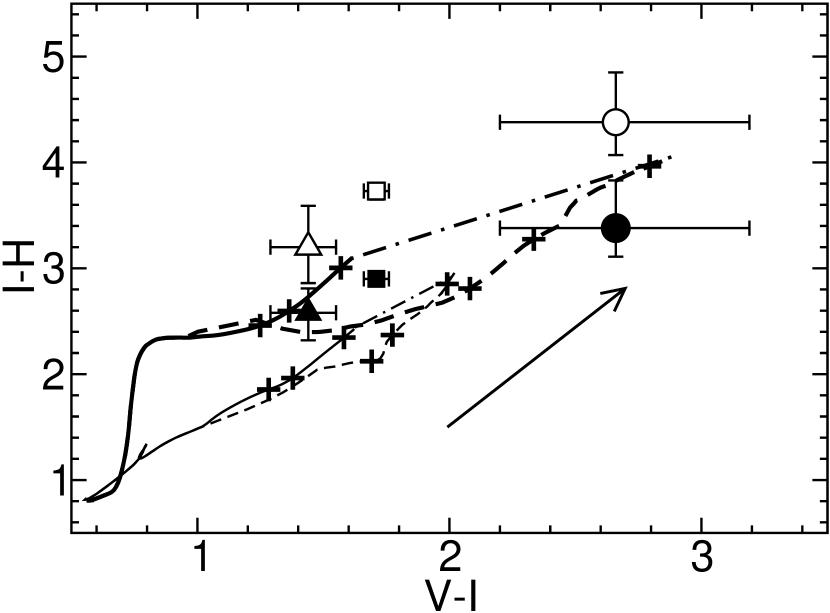
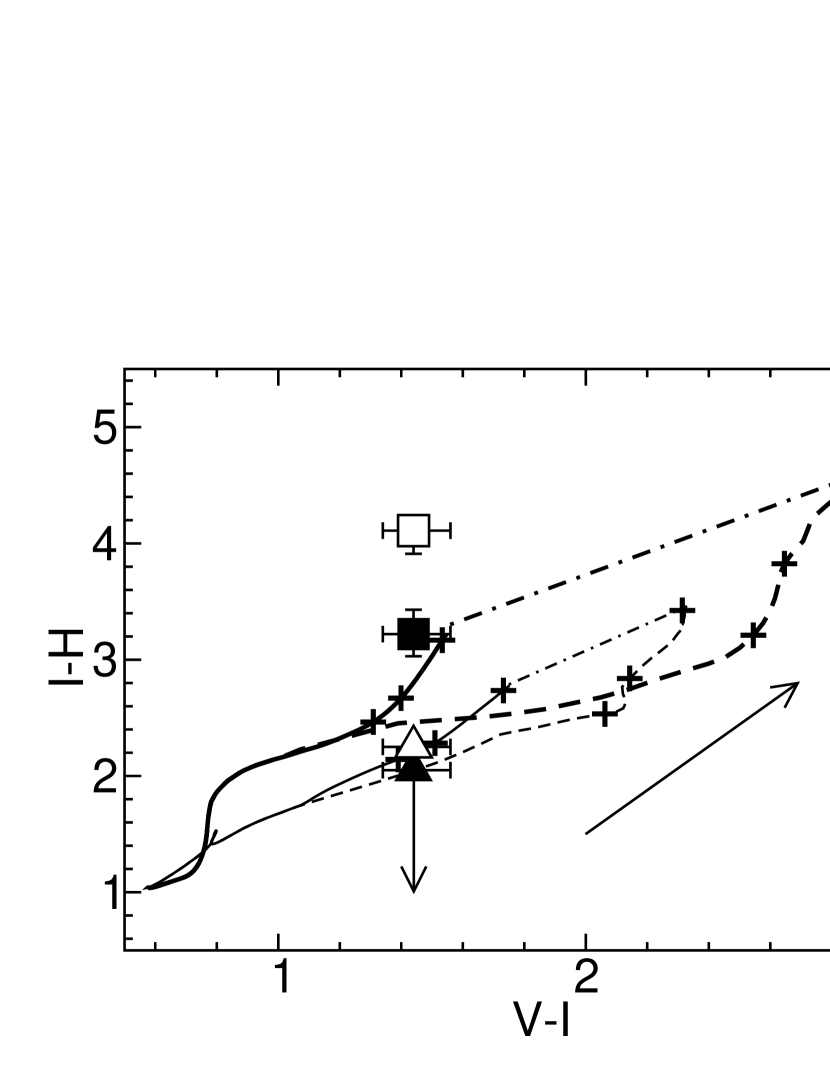
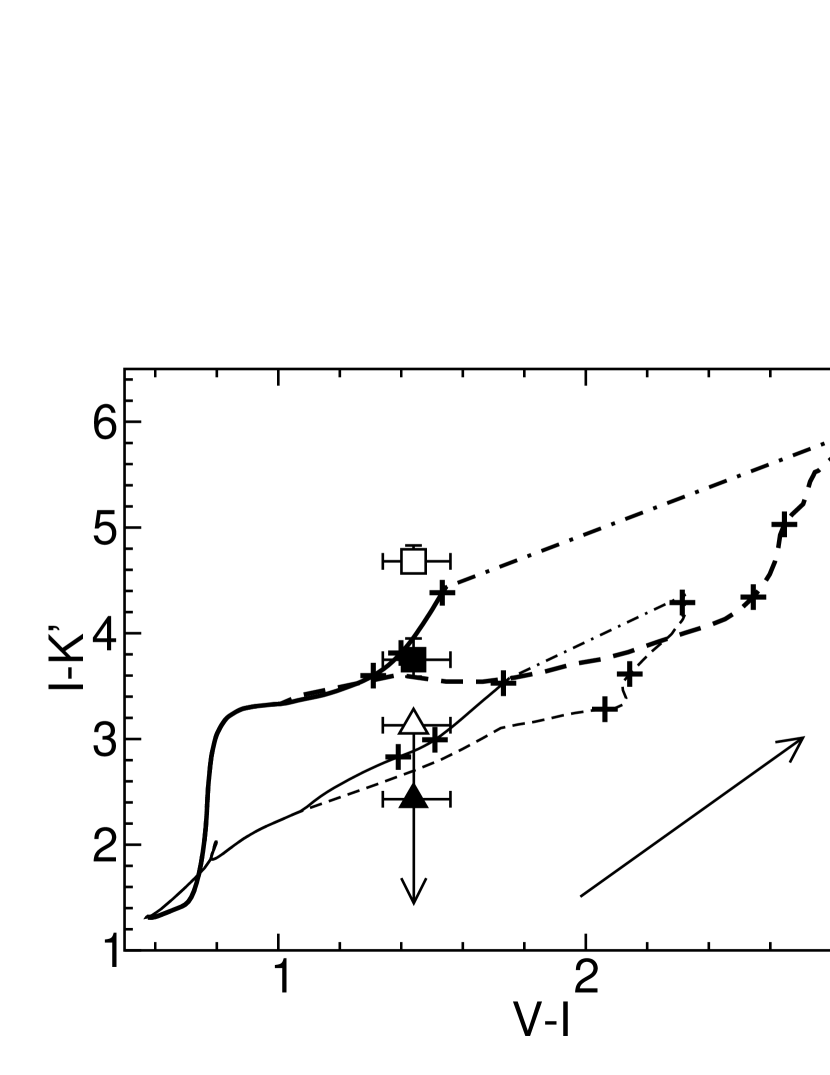
The photometry of Section 3.1 is plotted against these models in Figures 14 - 16. The total, disk, and bulge (Figure 15 only) components are represented by squares, triangles, and circles, respectively. The data assuming the best-case PSF are indicated by solid symbols, and the data assuming the worst-case PSF by open symbols (Figures 15 and 16 only). We have overplotted the galaxy models. In each plot we include an arrow indicating the effect of dust extinction with rest-frame . For all the galaxies, because it appears necessary to explain the observed colors, we apply an extinction correction to the models corresponding to rest-frame .
Figure 14 suggests that the bulk of the stellar population in JHU 2375 is metal rich and young or at least still forming strongly. The southern knot may be bluer than the rest of the galaxy, which would be consistent with it being a region of active star formation. Adding more dust to the galaxy will only make it bluer and thus give even younger ages. We have no constraint on the color of a bulge, and hence very little information about its age or star-formation history. It is equally compatible with having the same or a very different star formation history relative to the disk.
The AO photometry of GSS 294_3364 is better measured than JHU 2375, and therefore it is easier to judge which of the two main star-formation models is a better fit in Figure 15. In fact, it seems that both old and young models are necessary to describe the separated disk and bulge light if both are to have formed at the same time. The best-case AO PSF seems to be a better fit to the data. If so, the high-metallicity continuous-star-formation model matches the total light and disk data well, whereas a passively evolving high-metallicity model is favored for the bulge. The mean age of the galaxy based on the bulge may be 7 Gyr, but, with added dust, the PSF uncertainty can accommodate much younger ages - even as young as 1 Gyr.
The range of allowed integrated color for GSS 294_3367 in Figure 16 makes it difficult to determine an age for this galaxy. An age as old as 6 Gyr is possible by assuming the worst-case PSF and continuous star formation, but younger ages can be accommodated by either adding dust to that model or by adopting the best-case PSF and a burst-plus-passive-evolution scenario. Note that the best-case PSF integrated color for GSS 294_3367 agrees with only the reddest model predictions, whereas multiple models are in good agreement with the data. One plausible solution to this minor discrepancy is to appeal to a combination of the tiny size of this galaxy (only a few pixels across) and the difficulty of AO PSF characterization. Correction is better and more stable in than in . This suggests that we may slightly overestimate the FWHM of our “best-case” PSF. Poorer resolution of the galaxy would tend to predict a redder best-case PSF color, which is what one might expect by looking at the red worst-case PSF datapoints in this plot. To see if choosing a sharper PSF might give a bluer color we re-ran the models with the best-case PSF. This model did not converge; it may be that the better data for GSS 294_3367 is in , where the galaxy is better resolved. The disk color of GSS 294_3367 seems to favor low metallicity and young age.
The overall result of the stellar population modeling is that the light of all the galaxies’ disks could be described by either a burstpassive or continuous star formation history. Typically, most populations are quite metal rich, but significant variation in the amount of dust can be accommodated, and thus ages are poorly constrained. For GSS 294_3364 - the only galaxy with a prominent bulge in all bands - the difference in color between bulge and disk is plausibly due to different star formation histories. The bulge and disk may have started forming stars at the same time, but the redder bulge can be explained by its being formed in an initial burst followed by passive evolution, whereas the disk is still undergoing constant star formation.
4 Discussion
Our galaxies seem to be typical spirals. The integrated WFPC2 magnitude of JHU 2375 is 20.3, which gives an absolute rest-frame magnitude of using the K-corrections in Simard et al. (2002). Similarily, of GSS 294_3364 is approximately and GSS 294_3367 has . These rest-frame magnitudes would correspond to the high end of the Tully-Fisher relation (TFR) for local galaxies (Pierce & Tully, 1992; Ziegler et al., 2002). There is some debate about whether the TFR evolves out to . Vogt et al. (1997) suggest that there is essentially no change in zeropoint or slope over the redshift range with respect to the local TFR. Ziegler et al. (2002) find a change in slope of TFR with redshift, but their TFR for galaxies crosses the local one at about . This suggests that our galaxies should have masses about the same as local spirals of the same brightness. For the two galaxies for which we can obtain mass estimates from and we find (JHU 2375) and (GSS 294_3364).
The sizes of our two galaxies with rotation curves are somewhat large for their , but otherwise within the spread of seen in larger samples. Mao, Mo, & White (1998) find that for a given rotation speed, , disk scale length, , decreases as out to . This suggests a peak in the high- distribution of at about . JHU 2375 and GSS 294_3364 lie at about and respectively.
Massive galaxies tend to have higher metallicity, and local galaxies with absolute magnitudes similar to ours fall in the solar to super-solar range (Zaritsky, Kennicutt & Huchra, 1994). The relation does not seem to evolve much out to for galaxies (Kobulnicky et al., 2003), which suggests that we should expect ours to have . The results of our stellar population synthesis modeling indicate that our three galaxies are indeed plausibly metal rich, since the colors of the integrated light seem to agree with our high- models. But this last result must depend at least in part on the properties of the bulges, since for the one target where we unambiguously detect a bulge it may constitute a significant fraction of the mass.
In the local universe, the bulges of spirals seem to follow an extension of the tight relation between luminosity and masses of low-mass ellipticals. If one includes the bulges of spirals in the -band fundamental plane (FP) of local galaxies, those with integrated should fall at about and (Bender, Burstein & Faber, 1992). The -band FP relation for galaxies is also tight, with perhaps the most massive galaxies being somewhat brighter in the past for everything else being equal, including (Gebhardt et al., 2003). The one galaxy where we unambiguously detect the bulge is GSS 294_3364. If we simply assume for the moment its bulge and disk share the same ( based on its kinematic mass), our values can then be used to estimate a bulge mass. The bulge in rest-frame is small, certainly with a mass less than . Does this mean that the bulge is still being constructed? Possibly not because our NIR data are compatible with higher masses, perhaps as much as . This is in better agreement with the observed masses of local bulges found by Bender, Burstein & Faber (1992).
Spirals in the local universe seem to have similar disk and bulge colors, which suggests they probably share the same age, metallicity, and perhaps even star-formation history (deJong, 1996; Peletier & Balcells, 1996). The metallicities of our galaxies (in integrated light) would seem to be typical of massive local spirals based our stellar population synthesis modeling. The color of the GSS 294_3364 bulge suggests that it shares the same high metallicity as the disk, even if it formed in an initial burst rather than still actively undergoing star formation, as the disk seems to be. We caution that this is just one galaxy, and the result depends strongly on the allowed , and thus knowledge of the delivered AO PSF FWHM. This would seem to be an argument for obtaining high-spatial-resolution NIR AO images of a larger sample of field galaxies, with good control of the AO PSF. The laser beacon on Keck is one path towards obtaining this, and a key scientific program of the CfAO, the CATS survey, plans to take advantage of this route.
5 Conclusions
We have discussed a program of NIR AO observations of field galaxies where archived optical HST data were already available. The addition of the NIR data provided new information about the star-formation histories of these systems. The high spatial resolution allowed us to fit two-dimensional galaxy bulge-plus-disk models so that stellar-population-synthesis modeling could be carried out on the separated components. Two of the galaxies are disk dominated in the optical but possibly not in the NIR: JHU 2375 and GSS 294_3367. A significant bulge component is detected in all bands for GSS 294_3364. The integrated colors of all three galaxies can be fit by a model with either extended periods of star formation or passive evolution after an initial burst. Some metal enrichment is needed to fit the data. In all cases, the age of the galaxy is not well determined because of poor constraints on dust extinction; in turn due mostly to poor constraints on the AO PSF. For GSS 294_3364, one way to explain the difference in color between the bulge and disk is that the star formation histories of the bulge and disk are very different. The bulge evolved passively after an initial burst, and the disk is still undergoing active star formation.
This is an initial attempt at obtaining multi-color photometry of faint galaxy substructures by providing NIR images at spatial resolution and depth comparable to HST. We achieved similar resolutions with Keck AO, but our ground-based was generally poorer. One conclusion of this pilot study is that AO exposures need to be approximately a factor of 5 times longer than we have obtained in order to properly match the of the HST data. More importantly, PSF uncertainties introduced significant errors; these would have to be reduced by at least a factor of two for serious work. These requirements set goals for the next phase of our work. Clearly AO data provides a significant advantage over HST alone for determining the bulge properties of spirals. For our one galaxy where the bulge is unambiguously present, the sharp AO PSF nicely resolves this bright compact structure at a rest wavelength where it is bright. AO does not do as well with low surface-brightness features such as disks, and thus in this paper we have the HST data to constrain them. We have not investigated whether sufficiently deep seeing-limited data can provide the necessary information about extended, low surface-brightness emission that the AO data currently do not.
References
- Abraham et al. (1999) Abraham, R.G., Ellis, R.S., Fabian, A.C., Tanvir, N.R. & Glazebrook, K. 1999, MNRAS, 303, 641
- Andredakis, Peletier, & Balcells (1995) Andredakis, Y.C., Peletier, R.F., & Balcells, M. 1995, MNRAS, 275, 874
- Balcells et al. (2003) Balcells, M., Graham, A.W., Dominguez-Palmero, L., & Peletier, R.F. 2003, ApJ, 582, L79
- Bender, Burstein & Faber (1992) Bender, R., Burstein, D. & Faber, S.M. 1992, ApJ, 399, 462
- Bruzual & Charlot (1993) Bruzual A.G. & Charlot, S. 1993, ApJ, 405, 538
- Calzetti (1997) Calzetti, D. 1997, AJ, 113, 162
- deJong (1996) de Jong, R.S. 1996, A&A., 313, 45
- Gebhardt et al. (2003) Gebhardt, K., Faber, S.M., Koo, D.C., Im, M., Simard, L., Illingworth, G.D., Phillips, A.C., Sarajedini, V.L., Vogt, N.P., Weiner, B., & Willmer, C.N.A. 2003, ApJ, 597, 239
- Hawarden et al. (2001) Hawarden, T.G., Leggett, S.K., Letawsky, M.B., Ballantyne, D.R., & Casali, M.M. 2001, MNRAS, 325, 563
- Holden (2001) Holden, B. 2001, private communication
- Holtzman et al. (1995) Holtzman, J., Hester, J., Casertano, S., Trauger, J.T., Watson, A.M., Ballester, G.E., Burrows, C.J., Clarke, J.T., Crisp, D., Evans, R.W., Gallagher, J.S., Griffiths, R.E., Hoessel, J.G., Matthews, L.D., Mould, J.R., Scowen, P.A., Stapelfeldt, K.R., Westphal, J.A. 1995, PASP, 107, 156
- Kobulnicky et al. (2003) Kobulnicky, H.A., Willmer, C.N.A., Weiner, B.J., Koo, D.C., Phillips, A.C., Faber, S.M., Sarajedini, V.L., Simard, L. & Vogt, N.P. 2003, submitted to ApJ
- Marleau & Simard (1998) Marleau, F.R., & Simard, L. 1998, ApJ, 507, 585
- McLean et al. (2000) McLean, I.S., Graham, J.R., Becklin, E.E., Figer, D.F., Larkin, J.E., Levenson, N.A., Teplitz, H.I. 2000, Proc. SPIE, 4008, 1048
- Metropolis et al. (1953) Metropolis, N., Rosenbluth, A., Rosenbluth, M., Teller, A., & Teller, E. 1953, J. Chem. Phys., 21, 1087
- Mao, Mo, & White (1998) Mao, S., Mo, H.J., & White, S.D.M 1998, MNRAS, 297, L71
- Peletier & Balcells (1996) Peletier, R.F. & Balcells, M. 1996, AJ, 111, 2238
- Pierce & Tully (1992) Pierce, M.J. & Tully, R.B. 1992, ApJ, 387, 47
- Roddier (1999) Roddier, F. 1999, in Adaptive Optics in Astronomy, Cambridge University Press, New York, ed. F. Roddier, 9
- Salpeter (1955) Salpeter 1955, ApJ, 121, 161
- Schade et al. (1995) Schade, D., Lilly, S.J., Crampton, D., Hammer, F., Le Fevre, O. & Tresse, L. 1995, ApJ, 451, L1
- Simard et al. (2002) Simard, L., Willmer, C.N.A., Vogt, N.P., Sarajedini, V.L., Phillips, A.C., Weiner, B.J., Koo, D.C., Im, M., Illingworth, G.D. & Faber, S.M. 2002, ApJS, 142, 1
- Steinbring et al. (2002) Steinbring, E., Faber, S.M., Hinkley, S., Macintosh, B.A., Gavel, D., Gates, E.L., Christou, J.C., Le Louarn, M., Raschke, L.M., Severson, S.A., Rigaut, F., Crampton, D., Lloyd, J.P., Graham, J.R. 2002, PASP, 114, 1267
- Vogt et al. (1997) Vogt, N.P., Phillips, A.C., Faber, S.M., Gallego, J., Cronwall, C., Guzman, R., Illingworth, G.D., Koo, D.C. & Lowenthal, J.D. 1997, ApJ, 479, L121
- Wizinowich et al. (2000) Wizinowich, P., Acton, D.S., Shelton, C., Stomski, P., Gathright, J., Ho, K., Lupton, W., Tsubota, K., Lai, O., Max, C., Brase, J., An, J., Avicola, K., Olivier, S., Gavel, D., Macintosh, B., Ghez, A. & Larkin, J. 2000, PASP, 112, 315
- Wyse, Gilmore & Franx (1997) Wyse, R.F.G., Gilmore, G. & Franx, M. 1997, ARA&A, 35, 637
- Zaritsky, Kennicutt & Huchra (1994) Zaritsky, D., Kennicutt, R.C. & Huchra, J.P. 1994, ApJ, 420, 87
- Ziegler et al. (2002) Ziegler, B.L., Bohm A., Fricke, K.J., Jager, K., Nicklas, H., Bender, R., Drory, N. Gabash, A., Saglia, P., Seitz, S., Heidt, J., Mehlert, D., Mollenhoff, C., Noll, S. & Sutorius, E. 2002, ApJ, 564, L69
| Coordinates (J2000.0) | Guide Star | PSF Star | Exp. Time (s) | |||||||||
|---|---|---|---|---|---|---|---|---|---|---|---|---|
| Target | Right Asc. | Dec. | Mag. () | Offset (″) | Guide Mag. () | Offset (″) | Date | |||||
| JHU 2375 (catalog ) | 0.531 | 46′156 | 12.0 | 25 | 12.0 | 23 | 21 August 2000 | 2400 | ||||
| GSS 294_3364 (catalog ) | 0.651 | 01′549 | 11.5 | 29 | 10.0 | 30 | 7-9 May 2001 | 2700 | ||||
| GSS 294_3367 (catalog ) | 0.928 | 01′515 | 27 | 3000 | 2400 | |||||||
| Target | Best | Worst | Best | Worst | |||
|---|---|---|---|---|---|---|---|
| JHU 2375 (catalog ) | 0.17 | 0.20 | 0.13 | 0.31 | |||
| GSS 294_3364 (catalog ) | 0.17 | 0.20 | 0.15 | 0.24 | |||
| GSS 294_3367 (catalog ) | 0.17 | 0.20 | 0.15 | 0.23 | 0.12 | 0.23 | |
| Target | (kpc) | (deg) | (kpc) | Best | Worst | Best | Worst | ||||||
|---|---|---|---|---|---|---|---|---|---|---|---|---|---|
| JHU 2375 (catalog ) | |||||||||||||
| GSS 294_3364 (catalog ) | |||||||||||||
| GSS 294_3367 (catalog ) | |||||||||||||
| Object | Best | Worst | Best | Worst | Best | Worst | Best | Worst | |||||
|---|---|---|---|---|---|---|---|---|---|---|---|---|---|
| JHU 2375 | |||||||||||||
| Total | |||||||||||||
| Disk | |||||||||||||
| Bulge | |||||||||||||
| Knot | |||||||||||||
| GSS 294_3364 | |||||||||||||
| Total | |||||||||||||
| Disk | |||||||||||||
| Bulge | |||||||||||||
| GSS 294_3367 | |||||||||||||
| Total | |||||||||||||
| Disk | |||||||||||||
| Bulge | |||||||||||||