11email: hkuntsch@eso.org
Line-of-sight velocity distribution corrections for
Lick/IDS
indices of early-type galaxies
We investigate line-of-sight velocity distribution (LOSVD) corrections for absorption line-strength indices of early-type galaxies in the Lick/IDS system. This system is often used to estimate basic stellar population parameters such as luminosity weighted ages and metallicities. Using single stellar population model spectral energy distributions by Vazdekis (1999) we find that the LOSVD corrections are largely insensitive to changes in the stellar populations for old galaxies (age Gyr). Only the Lick/IDS Balmer series indices show an appreciable effect, which is on the order of the correction itself. Furthermore, we investigate the sensitivity of the LOSVD corrections to non-Gaussian LOSVDs. In this case the LOSVD can be described by a Gauss-Hermite series and it is shown that typical values of and observed in early-type galaxies can lead to significant modifications of the LOSVD corrections and thus to changes in the derived luminosity weighted ages and metallicities. A new, simple parameterisation for the LOSVD corrections, taking into account the and terms, is proposed and calibrations given for a subset of the Lick/IDS indices and two additional indices applicable to old (3 Gyr) stellar populations.
Key Words.:
Line: profiles – Methods: data analysis – Galaxies: abundances – Galaxies: elliptical and lenticular, cD – Galaxies: kinematics and dynamics1 Introduction
Absorption line strength measurements have long been used to investigate the stellar populations of (early-type) galaxies which are typically too far away to be resolved into individual stars. The interpretation of the measurements are performed via stellar population models which have become more and more sophisticated in their predictions over the years. For example, recent models (e.g., Trager et al. 2000; Thomas et al. 2003) are able to predict line-strength indices as a function of age, metallicity and abundance ratios. The success of these studies does not only depend on high signal-to-noise data and up-to-date model predictions but also on accurate calibrations of the observed data to a standard system. This is particularly important when comparing data between different objects such as giant ellipticals and globular clusters.
There are typically three stages in the calibration process: 1) choosing a line-strengths system which allows the measurement of the absorption features of interest in a large range of objects; 2) correcting the line-strength measurements for instrumental effects and 3) correcting the observed data for differences caused by the objects themselves, such as the stellar kinematics or emission line contamination. In this paper we will concentrate on point three and specifically on the corrections due to different line-of-sight velocity distributions (LOSVD) in galaxies.
In Section 2 we summarize the method of measuring line-strength indices in the Lick/IDS system while we focus on the effects of non-Gaussian LOSVDs in Section 3. Section 4 presents the stellar population models we use and the effects of ages and metallicities in our simulations. In Section 5 we present the new parameterisation of the LOSVD corrections applicable to old stellar population and LOSVDs which can be described by a fourth order Gauss-Hermite series. A literature comparison for our LOSVD corrections is given in Section 6. Section 7 gives a brief discussion of the results while the conclusions are listed in Section 8.
2 Measuring line-strength indices for early-type galaxies
For a purely stellar object the observed spectrum at a given sky position is the luminosity weighted sum of all stars redshifted according to their line-of-sight velocities and convolved with the instrumental resolution. However, one typically assumes that the observed data can be described by the luminosity weighted mean of a single age, single metallicity and single abundance ratio model-spectrum convolved with the LOSVD and instrumental resolution. Even though this is a gross simplification one can learn a great deal about the average stellar populations in galaxies.
One of the most successful line-strength systems for the interpretation of early-type galaxies was created by the Lick group (Faber et al. 1985; Worthey et al. 1994; Trager et al. 1998). In the Lick/IDS system, absorption-line strengths are measured by indices, where a central feature bandpass is flanked to the blue and red by pseudo-continuum bandpasses (see Figure 1). The mean height in each of the two pseudo-continuum regions is determined, and a straight line is drawn through the midpoint of each one. The difference in flux between this line and the observed spectrum within the feature bandpass determines the index. For most absorption features the indices are expressed in Ångströms of equivalent width. For broad molecular bands the index is expressed in magnitudes.
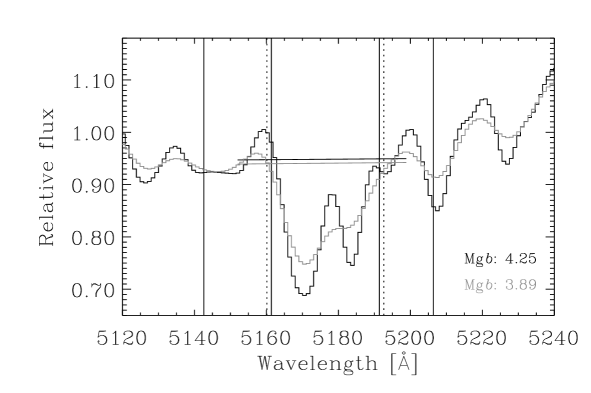
A significant LOSVD of stars in galaxies broadens the spectral features, in general reducing the observed line-strength in the Lick/IDS system compared to the intrinsic value of the average stellar population (see Figure 1). The net change in absorption strength is the combination of several competing effects and depends on the detailed absorption line composition in the vicinity of the main index feature. In general there are two ways to affect the observed index due to the LOSVD of stars: (1) the absorbed flux in the central index bandpass itself changes and (2) the pseudo-continuum level changes. Since the continuum of early-type galaxies in the optical wavelength region is completely eaten away by absorption lines, both effects play an important role.
For example, the measured absorption strength becomes weaker if stars in a given galaxy have large enough relative velocities so that part of the main index absorption feature extends beyond the central index bandpass. If the pseudo-continuum bandpasses are close to the index bandpass then the same effect will additionally lower the pseudo-continuum. However, if there are significant absorption features in the pseudo-continuum bandpasses the pseudo-continuum level is lifted up due to the broadening and therefore the observed index value becomes larger.
In order to compare the line-strength measurements at different positions across a galaxy or between different objects, a given index must be corrected to the value it would have if measured at some standard LOSVD. Generally, it is convenient to correct all indices to the values they would have if measured in an object without internal velocity structure and at a given instrumental resolution which can be described by a simple Gaussian. In the Lick/IDS system this is a wavelength dependent value which ranges from approximately 8.4 Å to 11.5 Å (for details see Worthey & Ottaviani 1997).
When correcting Lick/IDS indices for galaxies, typically only the first moment of the LOSVD, , is taken into account, hence the corrections have been referred to as velocity dispersion corrections (e.g., Davies et al. 1993). An example of such a correction factor111 as a function of is given in Figure 2. One can see that the correction strength is a rising function of the velocity dispersion and reaches 12.6% at for the Mg index. Other indices show similar curves, however with a varying magnitude of the correction factor (e.g., Kuntschner 2000).

3 Effects of non-Gaussian velocity profiles
With the availability of high quality measurements of significant non-Gaussian terms of the LOSVD (e.g., Bender et al. 1994) it is necessary to investigate the possible effects on the line-strength measurements. We start with a LOSVD constructed by a double Gaussian (see Figure 3). This LOSVD was designed to show a significant non-Gaussian shape, which qualitatively is representative for a number of early-type galaxies (see e.g., Scorza & Bender 1995). A double Gaussian of the following form was used
| (1) |
with parameters , , , , , and . This set of parameters was constrained to give a LOSVD with a mean velocity close to zero.
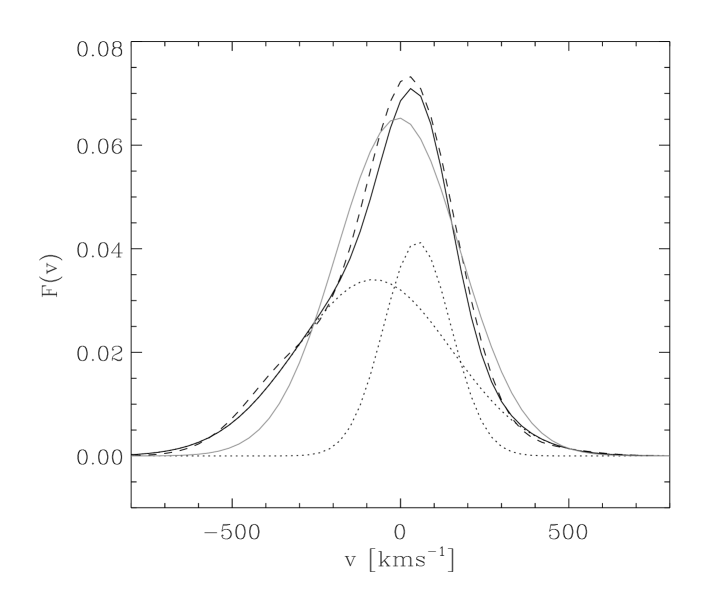
In order to test the influence on the line-strength indices, we use a single stellar population spectral energy distribution (hereafter SED) of 10 Gyr and solar metallicity (Vazdekis 1999) with known line-strength. We convolve this spectrum with our test LOSVD to simulate an early-type galaxy. The LOSVD corrections for our test LOSVD are determined by comparing the line-strengths measured on the simulated galaxy with those from the un-convolved spectrum. These corrections need to be compared with the classical procedure of measuring a simple velocity dispersion (ignoring the non-Gaussian components) from our test spectrum and calculating a correction factor with the help of calibrations as shown in Figure 2. The best fitting Gaussian LOSVD is represented by and (see solid, grey line in Figure 3).
For the Mg index we infer a LOSVD correction factor of 1.089 for the true test LOSVD while for the best fitting Gaussian we infer a factor of 1.068 – a difference of 2.1% to the true correction factor. It is clear from this example that line-strength indices in the Lick/IDS system can be sensitive to non-Gaussian LOSVDs and that this warrants a more systematic investigation into the LOSVD corrections.
In practise it is more convenient to describe the non-Gaussian terms of the LOSVD by the Gauss-Hermite parametrisation introduced by van der Marel & Franx (1993) and Gerhard (1993). The best fit to our example LOSVD using a fourth order Gauss-Hermite series is obtained with parameters , , , and (see dashed line in Figure 3). This parameterisation gives generally very good fits to observed LOSVDs and can therefore be used conveniently to parametrise otherwise complex LOSVDs. In our example the correction factor would be underestimated by only 0.2% when using the Gauss-Hermite parametrisation.
Using the integral-field-unit SAURON, Emsellem et al. (2004) report measurements of and terms in a representative sample of early-type galaxies. Most of the targets show 2-dimensional structure for the and terms with values as large as . Although the terms tend to be close to zero in the central region of early-type galaxies, a non-zero term is frequently observed. In our example LOSVD both and were non-zero and it is interesting to see if the line-strength indices show a different sensitivity to them.
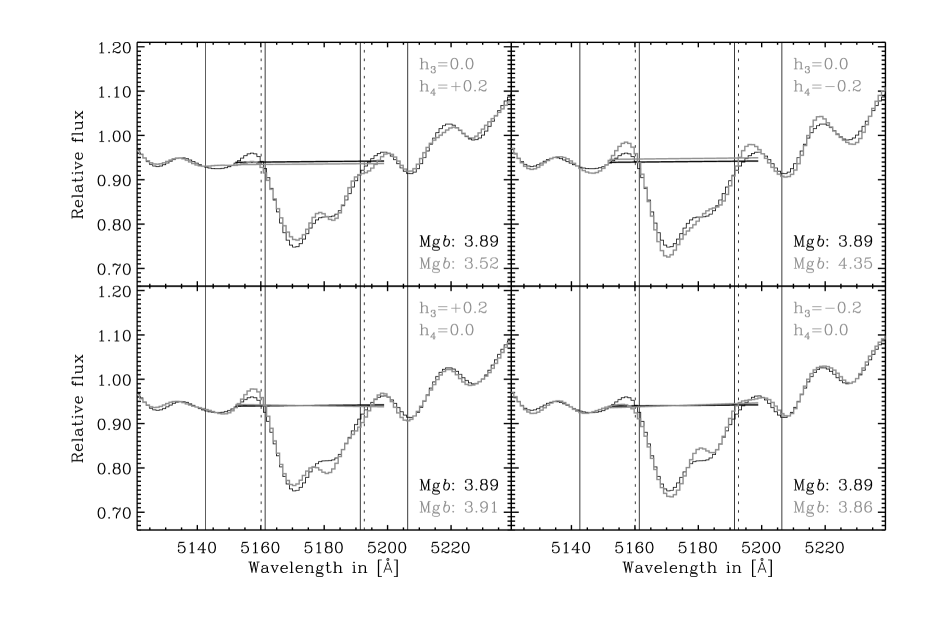
In Figure 4 we show spectra with non-Gaussian LOSVDs for four different combinations of and and a constant in the Mg region. For the Mg line-strength index a causes changes in the observed index strength of approximately % compared to a purely Gaussian LOSVD of . A non-zero term (), has negligible effects (%).
4 Simulations and the effects of different stellar populations
The main aim of this paper is to provide a simple procedure to correct for the LOSVD broadening of line-strength indices in the Lick/IDS system. Since the corrections are sensitive to the detailed absorption line composition around the features of interest, it is crucial to investigate these corrections on simulated galaxy spectra which are a good representation of real observations. It is well known that early-type galaxies harbour stellar populations which can span a wide range in ages and metallicities (e.g., Kuntschner & Davies 1998; Trager et al. 2000). For this purpose we have chosen to use a sub-set of 27 single stellar population (SSP) model spectra from the work of Vazdekis (1999). The models cover a large range in metallicity ([Fe/H] = -0.68 to +0.2) and age (1.0 to 17.78 Gyr). For all models we use an “unimodal” IMF type with Salpeter slope value. The spectra cover two windows of 3820 to 4500 Å and 4780 to 5460 Å at a resolution of 1.8 Å (FWHM), including a large set of Lick/IDS indices (see Table 1).
In order to match the Lick system the spectra were first broadened to the wavelength dependent Lick/IDS resolution (see Worthey & Ottaviani 1997). All spectra were further broadened to velocity dispersions of to 400 in steps of 40 , to in steps of and to in steps of in order to simulate the observed LOSVDs of galaxies. In total there are 32 697 simulated galaxy spectra per spectral window. The set of Lick/IDS indices (Trager et al. 1998) and two additional indices are then measured for each simulated galaxy spectrum and correction factors, , are determined such that
| (2) |
where is the index measured for the stellar population model and index .
For molecular indices (CN1, CN2) and indices which can have values close to zero (H, H) additive corrections, , are determined such that
| (3) |
where is the index measured for the stellar population model and index . Table 1 lists all the indices considered in this paper and also indicates whether additive or multiplicative corrections are used.
The above measurements on the simulated galaxy spectra yield corrections for each line-strength index and stellar population model at a given LOSVD characterised by , and . One of the first questions to ask here is whether the LOSVD correction at a given LOSVD is a function of input stellar population model, i.e. the age and metallicity of the simulated galaxy spectrum. Overall, the changes with age and metallicity are surprisingly small (1%) as demonstrated in Figure 5 for the Mg index. However, for stellar populations younger than about 3 Gyr one can see significant deviations.

The other indices with multiplicative corrections show a similar behaviour with average scatters smaller than 1%. Only the G4300 and Fe4383 indices show a larger scatter with 1.2% and 1.8%, respectively. Typically, the scatter due to different stellar population models increases with increasing velocity dispersion. We note, that the H index, a variant of the Lick/IDS H index shows a reduced sensitivity to stellar population changes (error 0.3% and 0.7%, respectively).
For indices with additive corrections, the CN1,2 indices show very little scatter with stellar population model, while the higher order Balmer series indices do show significant scatter. Here the uncertainty is on the order of the corrections themselves. At first sight this is an unfavourable situation, however, the corrections are small and the uncertainties are only a fraction () of the index change between a stellar population of 5.62 and 10.0 Gyr at solar metallicity. Therefore, the indices are still useful for stellar population studies. All former uncertainties due to different stellar populations were derived by using purely Gaussian LOSVDs and are quoted as average 1 uncertainties over the full range of velocity dispersions.
Here in this paper the aim is to provide simple to use LOSVD corrections for old stellar populations, so we decided to average the measurements for all ages greater than 3 Gyr and all metallicities covered by the model spectra.
We note, that more accurate LOSVD corrections can be achieved by fitting an optimal template to the galaxy spectrum in question (e.g., Cappellari & Emsellem 2004). This fit, obtained in real pixel space, can provide the necessary parametrisation of an individual LOSVD as well as the average stellar spectrum. Using this optimal template one can then determine more accurate LOSVD corrections, especially for galaxies with young stellar populations.
5 The new model for LOSVD corrections
Taking into account all simulations with an age of greater than 3 Gyr we find that the following models provide a good description of the corrections. For indices with multiplicative corrections:
| (4) |
For the additive corrections the model is changed to:
| (5) |
where , and are the correction coefficients for index (see Table 1).
A LOSVD corrected index is then for multiplicative corrections
| (6) |
and for additive corrections
| (7) |
where is the raw index measurement for index and is the LOSVD correction factor.
Table 1 lists the correction coefficients for all indices investigated in this paper. Table 2 gives the average 1 error and the 99.73% percentile level error for . The former errors are derived by averaging over all considered stellar population models and LOSVDs.
| Name | Typeb | ||||||||
|---|---|---|---|---|---|---|---|---|---|
| 1 | H | a | 1.6352E-05 | -3.4479E-06 | 3.3455E-09 | 1.1306E-03 | -3.1261E-06 | -2.2092E-03 | 1.0247E-06 |
| 2 | H | a | -2.7223E-05 | 1.5629E-06 | -3.9026E-10 | 1.4632E-03 | -2.8438E-06 | 8.9675E-04 | 2.8072E-06 |
| 3 | CN1 | a | 4.5496E-07 | 5.6976E-08 | -6.9482E-11 | 3.3855E-05 | -1.2322E-07 | 3.2924E-05 | -3.2799E-08 |
| 4 | CN2 | a | -9.1107E-07 | 2.0562E-07 | -2.2045E-10 | -9.1159E-05 | 1.4759E-07 | 1.3265E-04 | -1.2433E-07 |
| 5 | Ca4227 | m | 4.1692E-05 | 2.6781E-06 | 5.7468E-09 | -2.6918E-03 | 6.5988E-06 | 8.9098E-04 | 1.4347E-05 |
| 6 | G4300 | m | 2.3222E-05 | 6.3570E-07 | 1.6306E-10 | -5.6194E-04 | 1.9549E-06 | -7.4895E-05 | 3.7196E-06 |
| 7 | H | a | 1.1688E-05 | 1.0194E-06 | -5.9652E-09 | -5.8547E-04 | -5.0147E-06 | 2.2800E-03 | -2.0744E-05 |
| 8 | H | a | -1.7727E-05 | -4.9682E-07 | 2.0945E-09 | -1.7022E-03 | -4.8060E-07 | -1.3818E-04 | 3.4325E-06 |
| 9 | Fe4383 | m | 1.1509E-05 | 2.3090E-06 | -3.1740E-10 | -9.4865E-04 | 5.1610E-08 | 9.1133E-04 | 4.4302E-06 |
| 10 | H | m | 4.7881E-05 | -2.0608E-07 | 1.7285E-09 | 7.0527E-04 | 5.2770E-07 | -7.5619E-04 | 6.5777E-06 |
| 11 | H c | m | -3.2132E-05 | 1.0408E-06 | 4.0073E-10 | 7.4397E-04 | -1.2992E-06 | 4.6158E-04 | 3.2367E-06 |
| 12 | Fe5015 | m | 8.8838E-06 | 3.0684E-06 | -2.5073E-09 | -1.0867E-03 | 2.5696E-06 | 1.5059E-03 | 6.8840E-07 |
| 13 | Mg | m | -6.1814E-05 | 2.4787E-06 | -7.1595E-10 | -6.2044E-05 | -2.7694E-08 | 1.1524E-03 | 3.0182E-06 |
| 14 | Fe5270 | m | 6.9948E-06 | 2.7662E-06 | -1.7504E-09 | 1.2910E-04 | 3.0655E-07 | 7.3827E-04 | 4.1853E-06 |
| 15 | Fe527S c | m | -2.5596E-05 | 9.1585E-07 | 2.3466E-09 | 4.5289E-04 | -1.0934E-06 | -8.9776E-05 | 8.6598E-06 |
| 16 | Fe5335 | m | -9.5088E-05 | 5.7773E-06 | -6.0153E-10 | 9.0887E-04 | -5.8071E-06 | 3.5863E-03 | 1.1284E-06 |
| 17 | Fe5406 | m | -1.1774E-04 | 5.3334E-06 | 1.5920E-09 | 8.3065E-05 | 2.5328E-06 | 3.7854E-03 | 2.1638E-06 |
- a
- b
-
c
These indices are not defined in the Lick/IDS system. For a definition of H see Jørgensen (1997). For Fe527S, a variant of the Fe5270 index used in the SAURON survey (Kuntschner et al., in preparation), the blue, central and red bandpasses are defined as 5233.0–5250.000 Å, 5256.5–5278.5 Å, and 5285.5–5308.0 Å, respectively.
| Name | Typea | Errorb | 99.73% errorc | |
|---|---|---|---|---|
| 1 | H | a | 0.080 | 0.277 |
| 2 | H | a | 0.027 | 0.103 |
| 3 | CN1 | a | 0.001 | 0.004 |
| 4 | CN2 | a | 0.001 | 0.004 |
| 5 | Ca4227 | m | 0.015 | 0.053 |
| 6 | G4300 | m | 0.013 | 0.040 |
| 7 | H | a | 0.039 | 0.146 |
| 8 | H | a | 0.061 | 0.207 |
| 9 | Fe4383 | m | 0.021 | 0.076 |
| 10 | H | m | 0.013 | 0.045 |
| 11 | H | m | 0.006 | 0.019 |
| 12 | Fe5015 | m | 0.006 | 0.019 |
| 13 | Mg | m | 0.006 | 0.015 |
| 14 | Fe5270 | m | 0.005 | 0.015 |
| 15 | Fe527S | m | 0.004 | 0.013 |
| 16 | Fe5335 | m | 0.012 | 0.031 |
| 17 | Fe5406 | m | 0.017 | 0.044 |
6 Literature comparison
Before we start to discuss the results from this study, we present in the following a comparison with the literature for purely Gaussian LOSVDs. For the comparison we chose the calibrations by Trager et al. (1998, original Lick/IDS galaxy sample), Longhetti et al. (1998) and Kuntschner (2000). The literature calibrations were derived by using a number of typically G or K giants as input spectra for the simulations. For the indices in common we find good agreement in the general trends. The agreement is of the order of 2% for most of the indices between this paper, Trager et al. (1998) and Kuntschner (2000). Yet, for individual indices such as H we find differences as large as 5% (see Figure 6). The agreement with the study of Longhetti et al. (1998) is not as good and we find differences as large as 10% at 300 for the Fe5015 index (see Figure 6). The disagreement for the H index between Trager et al. (1998) and other studies can be largely explained by the wide range of correction strengths derived from individual stars (for details see Kuntschner 2000). We believe that, by using model spectra representative for early-type galaxies, this problem can be overcome. The disagreement between Longhetti et al. (1998) and other studies for the Fe5015 and Fe5270 indices is large and remains to be explained. Overall, we conclude that the LOSVD corrections in the literature agree qualitatively well, but significant quantitative differences remain.

7 Results and discussion
Most of the indices considered in this paper show significant changes when the LOSVD is characterised by a non-zero term, while the sensitivity to is negligible. Notable exceptions to this are the H, Fe4383, and H indices. These indices are sensitive to both and terms. Figures 7 & 8 schematically present for each index the dependency of the LOSVD corrections on , and .


Our simple correction model (Equations 4 & 5) typically achieves a good fit to the set of galaxy simulations with 1 errors of order 1.5% or less for the multiplicative corrections. For most of the investigations into the stellar populations of early-type galaxies this accuracy is sufficient since the error in the raw index measurements are typically larger. For more accurate LOSVD corrections one needs to create an optimal template of the average stellar population and kinematics of each galaxy spectrum and use this individual template to derive the corrections.
The simulated galaxy spectra, which we use to derive the LOSVD corrections, are based on predicted SEDs for single-age, single-metallicity stellar populations as provided by Vazdekis (1999). Generally, these model spectra represent well the observed spectra of early-type galaxies. However, the SEDs do not reflect, particularly at solar metallicity and above, the super-solar -element to Fe ratios typically found in elliptical and lenticular galaxies (e.g., Worthey et al. 1992; Davies et al. 1993; Maraston et al. 2003). So, for individual indices affected by non-solar abundance ratios, such as Mg , the model spectra often do not achieve a good fit. When model spectra with varying abundance ratios become available, potential changes in the LOSVD corrections will need to be investigated.
Most of the existing line-strengths studies in the Lick/IDS system did not take into account the effects of non-Gaussian LOSVDs which raises the question of how wrong their LOSVD corrections and interpretation of the data were. An often used index combination to infer luminosity weighted ages and metallicities of early-type galaxies is [MgFe] vs H 222 (e.g., Kuntschner & Davies 1998; Trager et al. 2000; Mehlert et al. 2003; Thomas et al. 2003). In order to assess the effects on the derived stellar population parameters we use a simulated galaxy spectrum representative of a central observation of a luminous early-type galaxy with a large h4 term ( , h and h; solar metallicity and 10 Gyr of age). Using the LICK/IDS system of line-strength indices and our newly proposed LOSVD corrections we recover from the simulated galaxy spectrum an age of 10.0 Gyr and a metallicity of . If we would have used only the traditional corrections for the LOSVD broadening, i.e. measuring only a pure Gaussian velocity dispersion ( ) we would have obtained an age of 11.4 Gyr and a metallicity of . The former exercise assumes no errors in the determination of the line-strength indices and kinematics.
For central galaxy line-strength measurements the observed LOSVDs typically do not show such extreme h4 terms and thus the traditional LOSVD corrections, if well calibrated, are correct on the few percent level. For line-strength gradients across galaxies one observes significantly non-Gaussian LOSVDs (e.g., Emsellem et al. 2004) and therefore the LOSVD corrections and thus the derived stellar population parameters can indeed be significantly wrong.
8 Conclusions
In this paper we address the line-of-sight velocity distribution (LOSVD) corrections for absorption line-strength indices of early-type galaxies in the Lick/IDS system. We derive a simple parameterisation of the corrections as a function of velocity dispersion and the first moments of the Gauss-Hermite series, and , which describe non-Gaussian LOSVDs. We provide calibrations for 15 Lick/IDS indices and two additional indices.
For single stellar population ages greater than 3 Gyr and metallicities between [Fe/H] = and we find that LOSVD corrections are almost independent of the stellar population. The typical scatter is less than 1.5% (rms). The LOSVD corrections for higher order Balmer lines, which are important age indicators for the study of early-type galaxies, show an increased sensitivity to stellar population differences. However, the corrections themselves are small compared to the typical range of line-strengths observed in early-type galaxies. If more accurate corrections are needed, an optimal template of the average stellar population and kinematics of each galaxy spectrum can be created and used to derive precise corrections.
Investigating the sensitivity to non-Gaussian LOSVDs, parametrised by the and terms of a Gauss-Hermite series, we find that the H, Fe4383, and H indices are sensitive to both and , while the remaining indices of this study are sensitive to only. For variations of at a constant velocity dispersion of 250 we typically find changes of in the LOSVD correction. These changes translate into approximately 15% and 20% errors in the ages and metallicities of old stellar populations, respectively, as estimated from index-index diagrams.
Acknowledgements.
We thank R. McDermid, C. Harrison, E. Emsellem, M. Cappellari and the referee S. Trager for useful discussions and advice.References
- Bender et al. (1994) Bender, R., Saglia, R. P., & Gerhard, O. E. 1994, MNRAS, 269, 785
- Cappellari & Emsellem (2004) Cappellari, M. & Emsellem, E. 2004, PASP, 116, 138
- Davies et al. (1993) Davies, R. L., Sadler, E. M., & Peletier, R. F. 1993, MNRAS, 262, 650
- Emsellem et al. (2004) Emsellem, E., Cappellari, M., Peletier, R. F., et al. 2004, MNRAS, in press
- Faber et al. (1985) Faber, S. M., Friel, E. D., Burstein, D., & Gaskell, C. M. 1985, ApJS, 57, 711
- Gerhard (1993) Gerhard, O. E. 1993, MNRAS, 265, 213
- Jørgensen (1997) Jørgensen, I. 1997, MNRAS, 288, 161
- Kuntschner (2000) Kuntschner, H. 2000, MNRAS, 315, 184
- Kuntschner & Davies (1998) Kuntschner, H. & Davies, R. L. 1998, MNRAS, 295, L29+
- Longhetti et al. (1998) Longhetti, M., Rampazzo, R., Bressan, A., & Chiosi, C. 1998, A&AS, 130, 251
- Maraston et al. (2003) Maraston, C., Greggio, L., Renzini, A., et al. 2003, A&A, 400, 823
- Mehlert et al. (2003) Mehlert, D., Thomas, D., Saglia, R. P., Bender, R., & Wegner, G. 2003, A&A, 407, 423
- Scorza & Bender (1995) Scorza, C. & Bender, R. 1995, A&A, 293, 20
- Thomas et al. (2003) Thomas, D., Maraston, C., & Bender, R. 2003, MNRAS, 339, 897
- Trager et al. (2000) Trager, S. C., Faber, S. M., Worthey, G., & González, J. J. 2000, AJ, 119, 1645
- Trager et al. (1998) Trager, S. C., Worthey, G., Faber, S. M., Burstein, D., & Gonzalez, J. J. 1998, ApJS, 116, 1
- van der Marel & Franx (1993) van der Marel, R. P. & Franx, M. 1993, ApJ, 407, 525
- Vazdekis (1999) Vazdekis, A. 1999, ApJ, 513, 224
- Worthey et al. (1992) Worthey, G., Faber, S. M., & Gonzalez, J. J. 1992, ApJ, 398, 69
- Worthey et al. (1994) Worthey, G., Faber, S. M., Gonzalez, J. J., & Burstein, D. 1994, ApJS, 94, 687
- Worthey & Ottaviani (1997) Worthey, G. & Ottaviani, D. L. 1997, ApJS, 111, 377