A Chandra Deep X-ray Exposure on the Galactic Plane and Near Infrared Identification
Abstract
Using the Chandra ACIS-I instruments, we have carried out a deep X-ray observation on the Galactic plane region at , where no discrete X-ray sources have been known previously. We have detected, as well as strong diffuse emission, 274 new point X-ray sources (4 confidence) within two partially overlapping fields (250 arcmin2 in total) down to the flux limit erg s-1 cm-2 (2 – 10 keV) and erg s-1 cm-2 (0.5 – 2 keV). We clearly resolved point sources and the Galactic diffuse emission, and found that % of the flux observed in our field of view originates from diffuse emission. Many point sources are detected either in the soft X-ray band (below 2 keV) or in the hard band (above 2 keV), and only a small number of sources are detected in both energy bands. On the other hand, most soft X-ray sources are considered to be nearby X-ray active stars. We have carried out a follow-up near-infrared (NIR) observation using SOFI at ESO/NTT. Most of the soft X-ray sources were identified, whereas only a small number of hard X-ray sources had counterparts in NIR. Using both X-ray and NIR information, we can efficiently classify the point X-ray sources detected in the Galactic plane. We conclude that most of the hard X-ray sources are background Active Galactic Nuclei seen through the Milky Way, whereas majority of the soft X-ray sources are nearby X-ray active stars.
keywords:
Chandra; Milky way; ESO/NTT; Near-infrared; survey; diffuse emission
1 Chandra observation and results
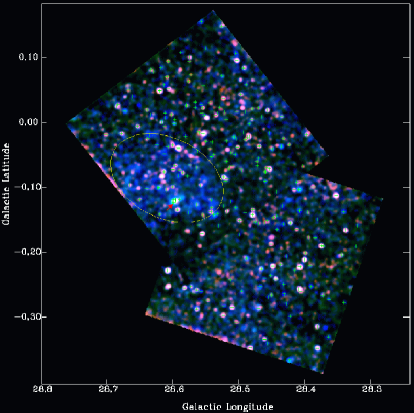
We have carried out two 100 ksec pointings with Chandra ACIS-I in AO1 (February 25 and 26, 2000) and AO2 (May 20, 2001), with slightly overlapping fields (Fig. 1). Total area of the observed field is arcmin2. The first results from the AO1 observation has been published in Ebisawa et al. (2001). Detailed analysis of the new supernova remnant candidate in the field of view, AX J1843.8–0352/G28.6–0.1 (marked in Fig. ), is reported in Ueno et al. (2003). The full results including the X-ray source catalog will be published in Ebisawa et al. (2004).
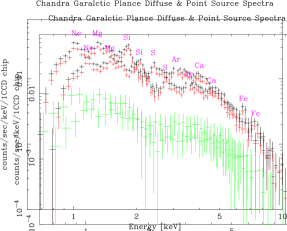
We have extracted an energy spectrum from our Chandra Galactic plane field (Fig. 2) by subtracting the instrumental background and excluding the AX J 1843.8–0352/G28.6–0.1 region (marked in Fig. 1). We found that the diffuse emission contributes to % of the flux in the field of view, and that emission lines from highly ionized heavy elements are associated with the diffuse emission. This indicates that the Galactic ridge X-ray emission is truly diffuse, and its origin is probably a highly ionized plasma.
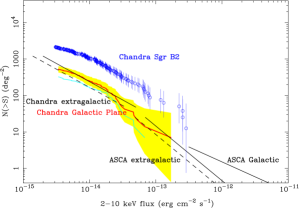
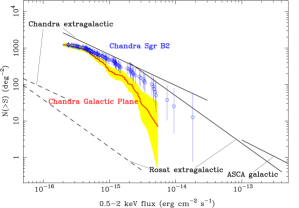
We have made curves in 2 – 10 keV and 0.5 – 2 keV from the surface density of the detected point sources (Fig. 3). Our results are also compared with those from the high Galactic region and Galactic center.
In the 2 – 10 keV band, after taking into account the Galactic absorption, our curve does not indicate significant excess over the extragalactic one. This indicates that most of the hard X-ray point sources we detected in the Galactic plane are in fact of extragalactic origin, presumably background AGNs. If we compare the hard X-ray curve at the Galactic center region and that of the Galactic plane (Fig. 3, left), we see clear excess of the Galactic X-ray sources in the Galactic center region over the Galactic plane. In the soft X-ray band, on the other hand, contribution from the extragalactic sources is negligible since they are almost fully absorbed. Thus almost all the soft X-ray sources discovered in our Galactic plane field are considered to be Galactic.
2 Near Infrared Observation at ESO using NTT/SOFI
Because of the heavy Galactic absorption, the near infrared band has a great advantage over the optical to identify dim X-ray sources in the Galactic plane. In order to identify X-ray point sources in our Chandra field, we have carried out a NIR follow-up observation at European Southern Observatory (ESO) using the New Technology Telescope with the SOFI infrared camera. The observations were carried out on the nights of July 28 and 29, 2002.
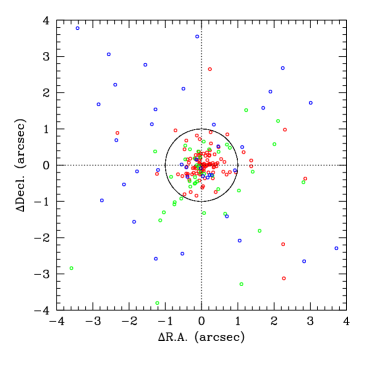
In Fig. 4, we plot angular distance between the Chandra point sources (classified with X-ray colors) and the nearest NIR sources detected by SOFI. If the separation between the Chandra source and SOFI source is less than , we identify the two sources. We can see that most of the soft X-ray sources (marked in red) have NIR counterparts, while only a small portion of the hard X-ray sources is identified in the NIR. This is consistent with the result from the analysis that most hard X-ray sources are extragalactic, whereas almost all the soft X-ray sources are Galactic.
3 Classification of the Point Sources
Using both X-ray and NIR information, we may effectively classify X-ray point sources.
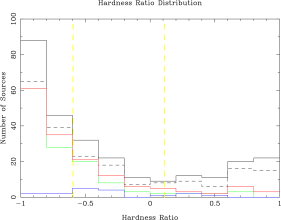
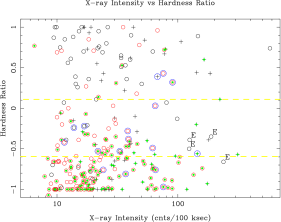
In Fig. 5, we show a histogram of the X-ray hardness ratio distribution and the intensity-hardness diagram. From the left panel in Fig. 5, we can see that the softest sources are most numerous, and most of them have NIR counterparts. With increasing hardness ratio, the number of sources first decreases, but again increases toward the hardest values. This clearly indicates the dichotomy of the point source population, Galactic population and extragalactic one.
In the right panel of Fig. 5, we can see that all the bright soft sources have NIR counterparts. Only several dim soft sources do not have counterparts, presumably because they are intrinsically dim and/or very far Galactic sources. On the other hand, we can see that there are many bright hard sources which are not identified in NIR. In particular, the brightest Chandra source, which has the hardness ratio 0.74 (Fig. 5), is not identified in the NIR. This is not surprising since AGNs tend to be bright in hard X-rays, but even the brightest AGNs should be completely absorbed through the Galactic plane.
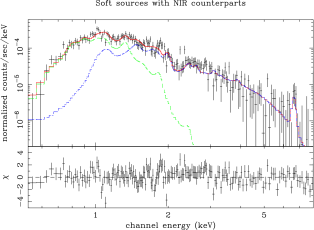
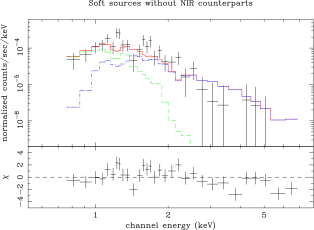
We have created composite (average) energy spectra of point sources, by dividing them into four categories, depending on the X-ray hardness (soft and hard) and presence or absence of the NIR counterparts (Fig. 6). The soft sources with NIR counter parts (top left) show thermal emission lines, and are fitted with the two-component thermal plasma model. This kind of spectrum is consistent with stellar coronal emission. The soft sources without NIR counterparts are dimmer but can be fitted with exactly the same model with decreasing normalization and increasing hydrogen column density, which suggests they are farther and/or dimmer active stars.
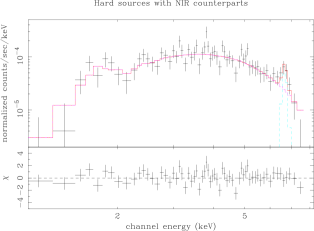
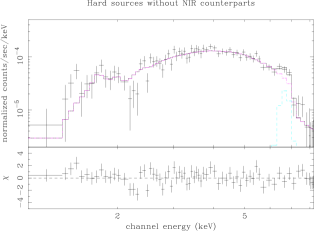
Hard X-ray sources with NIR counterparts, even though only handful, indicate a clear narrow iron emission line at 6.67 keV from helium-like ions and a flat continuum spectrum. This is a signature of a high temperature thermal plasma, expected from quiescent cataclysmic variables. On the other hand, the hard X-ray sources without NIR counterparts are brighter, and they show rather complex iron features which look like broad lines or edges. The X-ray brightness and complex iron feature supports the idea that these hard X-ray sources without NIR counterparts are background AGNs.
References
- (1) Bamba, A., Ueno, M., Koyama, K. Yamauchi, S. 2001, PASJ, 53, L21
- (2) Ebisawa, K., Maeda, Y., Kaneda, H. and Yamauchi, S. 2001, Science, 293, 1633
- (3) Ebisawa, K. et al. 2004, in preparation
- (4) Giacconi, R. et al. 2001, ApJ, 551, 624
- (5) Sugizaki, M. et al. 2001, ApJS, 134, 77
- (6) Ueda, Y. et al. 1999, ApJ, 518, 656
- (7) Ueno, M., Bamba, A., Koyama, K. and Ebisawa, K. 2003, ApJ, 588, 338