Prompt and afterglow X–ray emission from the X–Ray Flash of 2002 April 27
We report on the X–ray observations of the X–ray flash (XRF) which occurred on 2002 April 27, three days before BeppoSAX was switched off. The event was detected with the BeppoSAX Wide Field Cameras but not with the Gamma ray Burst Monitor. A follow-up observation with the BeppoSAX Narrow Field Instruments was soon performed and a candidate afterglow source was discovered. We present the results obtained. We also include the results obtained from the observations of the XRF field with the Chandra X–ray satellite. The spectral analysis of the prompt emission shows that the peak energy of the spectrum is lower than 5.5 keV, with negligible spectral evolution. The X–ray afterglow spectrum is consistent with a power law model with photon index of , while the 2–10 keV flux fades as a power law with a decay index . Both these indices are typical of GRBs. A very marginal excess at 4.5–5 keV is found in the afterglow spectrum measured by BeppoSAX . As for many GRBs, the extrapolation of the 2–10 keV fading law back to the time of the prompt emission is consistent with the X–ray flux measured during the second part of the event. We estimate a possible range of values of the redshift and discuss our results in the light of current models of XRFs.
Key Words.:
gamma-rays: bursts — X–rays: observations — X–rays: general1 Introduction
Among the Fast X–ray Transients (FXTs) detected by the BeppoSAX Wide Field Cameras (WFC, 2–28 keV, Jager et al. (1997)) on–board the BeppoSAX satellite (Boella et al. 1997a ) in six years of operation, there have been more than 20 events (Heise et al. (2003)) whose temporal and spectral properties resemble those of the X–ray counterparts of Gamma–Ray Bursts (GRBs), but were not detected by the Gamma–Ray Burst Monitor (GRBM, 40–700 keV, Frontera et al. (1997)). They are called X–Ray Flashes (XRFs). The classification as XRF is commonly extended to GRB–like events detected by HETE–2 showing no signal above 30 keV in the FREGATE instrument (e.g. Barraud et al. (2003)). Distinctive features of XRFs with respect to the other FXTs are their shorter duration (from a few tens to a few hundreds of seconds), their light curves, their non–thermal and quickly evolving spectra, and their isotropic distribution in the sky (e.g. Heise et al. (2003)). The origin of these events is a matter of debate: either they have a nature completely different from GRBs or they are very X–ray rich GRBs, too soft to be detected by the utilized gamma–ray instruments. The second interpretation seems to be more consistent with the data. In fact, the extrapolation to higher photon energies of the WFC spectra of these events indicates that for all but two XRFs the expected signal in the 40–700 keV energy band is below the GRBM sensitivity threshold (Heise et al. (2003)). Also, an inspection of the CGRO/BATSE light curves in the 25–50 keV and 50–100 keV energy bands resulted in a positive detection (5 ) for 9 out of 10 XRFs observed with the WFCs (Kippen et al. (2003)). The one remaining case may very well be a thermonuclear flash on a Galactic neutron star (Cornellisse et al. (2002)). The spectral analysis of a sample of 35 XRFs detected by HETE-2 (Barraud et al. (2003)) further supports the interpretation of XRFs as very soft GRBs, with peak energies of the spectra which can be as low as a few keV, and with peak fluxes or fluences much higher in X–rays than in gamma–rays. Various explanations of the X–ray richness of these events have been proposed, for example fireballs with low Lorentz factors due to a high baryon loading (e.g. Dermer (1999); Huang et al. (2002)), very high redshift GRBs (5) (e.g. Heise et al. (2003)), collimated GRBs seen at large off axis angles (e.g. Yamazaki et al. (2002)).
The increasing number of XRF observations with HETE-2 is providing important information for the clarification of the phenomenon. The assumption of high redshift GRBs does not seem to be confirmed by the data. The detection of X–ray afterglow emission from XRF 011030 with Chandra (Harrison et al. (2001)) was followed by the discovery of a fading radio counterpart (Taylor et al. (2001)) and of a blue host galaxy possibly located at z3.5 (Bloom et al. (2003)). The follow–up observation of XRF 030723 (Prigozhin et al. (2003)), led to the discovery of optical (Fox et al. (2003)) and X–ray (Butler et al. (2003)) afterglow counterparts. The spectra of the optical transient (OT) of this event suggest a redshift lower than 2.3 (Fynbo et al. (2004)). The claim of an optical and radio counterpart of XRF 020903 (Berger et al. (2002); Soderberg et al. (2002, 2003)) and its possible association with a SN event at is debated: based on inspections of the available optical and radio data of the field, Gal–Yam et al. (2002) suggest that the variable object could be a radio–loud AGN.
In this paper, we present and discuss the prompt and delayed emission properties of XRF 020427 observed with the BeppoSAX /WFC and GRBM instruments and followed-up with both BeppoSAX and Chandra satellites.
| Instrument | Band | Seconds from | Exposure | Source counts | Average 2–10 flux(a) |
| (keV) | XRF onset | (s) | ( ) | ||
| BeppoSAX /WFC | 2–28 | 0–60 | 60 | 4774329 | (9.70.7)10-9 |
| BeppoSAX /MECS | 1.6–10 | 40320–55080 | 6834 | 419 | (4.20.9)10-13 |
| BeppoSAX /MECS | 1.6–10 | 197640–218520 | 8044 | 24(b) | 2.110-13(b) |
| Chandra /ACIS–S(c) | 0.3–7 | 770503–786408 | 13741 | 558 | (1.10.2)10-14 |
| Chandra /ACIS–S(c) | 0.3–7 | 1453875–1470117 | 14568 | 236 | (4.41.2)10-15 |
-
(a)
Values computed by assuming the best fit spectral models (see Table 2 and text)
-
(b)
3 upper limits.
-
(c)
The values here reported refer to CXOU J220928.2–651932 and were derived from the Chandra public data archive (see also Sect. 3).
2 Observations
XRF 020427 was detected by BeppoSAX /WFC unit 2 on 2002 April 27, at 03:48:40 UT with no signal from the GRBM (Fig. 1). Simultaneously, a sudden ionospheric disturbance lasting 60 s with an amplitude (and therefore ionizing flux) comparable to that measured on 1998 August 27 from the giant flare from SGR1900+14 (Fishman et al. (2002)). It is not clear whether the disturbance on 2002 April 27 is associated with the XRF, but if it is the XRF it should also have had a very intense flux below 2 keV. Unfortunately, there are no soft X–ray measurements available. XRF 020427 was localized with an uncertainty of 3’ (at 99% confidence). It was classified as an X–ray Flash rather than a Galactic X–ray burst because it failed to exhibit spectral softening during the decay, is relatively far from the Galactic plane (44.2∘), and is not coincident with a known Galactic X–ray source (in ’t Zand et al. (2002)). Two Target Of Opportunity (TOO) observations of the WFC error circle were performed with the BeppoSAX / Medium Energy Concentrator Spectrometer (MECS, 1.6–10 keV, Boella et al. 1997b ). None of the other Narrow Field Instruments were switched on. The TOOs lasted from 11.2 to 15.3 hrs and from 54.9 to 60.7 hrs after the XRF. A previously unknown X–ray source was detected, designated 1SAX J2209.3–6519, at , 1.1’ away from the centroid of the WFC error circle (Amati et al. (2002)). Given that the flux of the source decreased by a factor of 2 from the first to the second TOO, it was identified as the likely X–ray afterglow of XRF 020427.
Chandra observed XRF 020427 on 2002 May 6 and 14 with ACIS–S (0.3–10 keV,
Garmire et al. (2003)) at the focal plane and with no grating.
Three previously unknown sources were detected within the MECS–determined error circle
of radius 1′ of which one (CXOU J220928.2–651932) faded
substantially from the first to the second observation (Fox (2002)).
One previously unknown radio source lying inside the MECS error circle was
detected at 8.7 GHz with the Australian radio telescope ATCA (Wieringa et al. (2002)),
but none of the three Chandra sources had a position coincident
with that of this radio source. Optical observations with
HST on 2002 June 10 and with the
VLT one day later showed that the
Chandra source lies on the edge of a 1.5′′ large galaxy with V magnitude
belonging to a group
of three blue galaxies (Castro–Tirado et al. (2002); Fruchter et al. (2002)). Based on a combined
analysis of the HST and Chandra images, Bloom et al. (2003) infer an
upper limit for the redshift of 3.5. This limit was fine–tuned
to 2.3 with Gemini South observations (Van Dokkum & Bloom (2003)).
A summary of all X–ray observations of XRF 020427 is reported
in Table 1.
We performed the BeppoSAX data analysis by using
standard reduction techniques and software (see Jager et al. (1997) for the WFC,
Amati et al. (1999) for the GRBM and
Boella et al. 1997b for the MECS).
For the spectral analysis of the MECS data we used an image extraction radius
of 3′ and the standard background spectrum.
The public Chandra data were reduced by using standard CIAO 2.2.1 procedures.
The spectral analysis was performed by
using XSPEC version 11.2 (Arnaud (1996)).
The quoted errors and limits are given at a 90% confidence level, except where
otherwise noted.

3 Results
3.1 Prompt emission
The light curve of XRF 020427 in the 2–28 keV energy band is shown in Fig. 1 together with the simultaneous GRBM ratemeters in the 40–700 keV energy band. The X–ray event exhibits two pulses and a smooth decay with a 60 s duration, which is typical of long GRBs. No signal is detected in gamma–rays. However an excess in the counts at a confidence level of appears when we compare the total 40–700 keV counts measured during the X–ray event with the background level.
The 2–28 average spectrum of XRF 020427 is shown in Fig. 2. It is well described (/dof = 9.6/26) by a simple power law absorbed by the average Galactic hydrogen column density along the XRF direction ( cm-2), derived from radio maps (Dickey and Lockman (1990)), and with photon index = . The extrapolation of this model to higher energies is consistent with the 3 upper limit to the 40–700 keV event intensity for 2.05. By fitting the WFC data with the Band function (Band et al. (1993)) with frozen to and the other spectral parameters (, and normalization) free to vary, we get and , with an upper limit of 5.5 keV to the peak energy Ep of the spectrum. The same result on is obtained by fixing at lower values and requiring the GRBM 3 upper limit to be satisfied. No spectral evolution during the event is seen in time resolved spectra.
From the spectral results, we derive 1 s peak fluxes,
and
, and fluences,
and , which
lie in the range found for GRBs detected with the WFCs and GRBM
(Frontera et al. 2000b ; Amati et al. (2002)).
Assuming the spectral model which best fits the WFC data,
we also derive from the GRBM data
3 upper limits
to the 1 s peak fluxes and fluences in gamma–rays: , ,
,
.
From the X–ray values and the GRBM upper limits we derive
the following lower limits to the commonly used indicators of the
event X–ray richness (e.g. Feroci et al. (2001); Kippen et al. (2003)):
,
,
,
,
,
.
3.2 Afterglow source detection
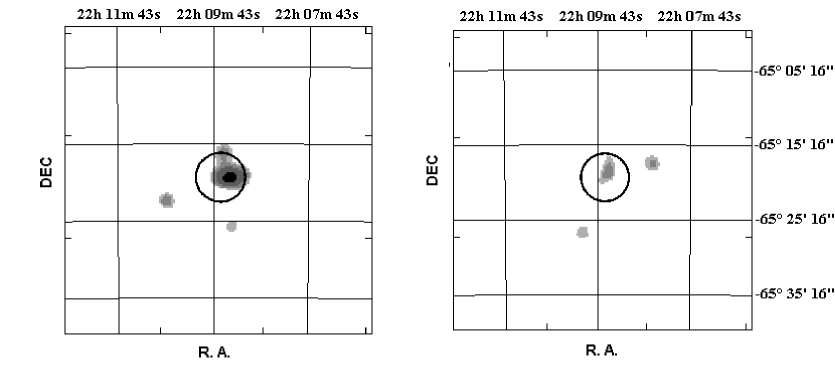
The MECS images accumulated over the two BeppoSAX TOOs in the 1.4–10 keV energy range are shown in Fig. 3. The X–ray afterglow source (1SAX J2209.3–6519) is clearly visible in the image for the first TOO at an intensity of (5.91.3)10-3 cts/s (1.4–10 keV) whereas no significant signal is detected in the second TOO above a 3 upper limit of 3.010-3 cts/s. This implies a fading by a factor from the epoch of the first TOO to that of the second one.
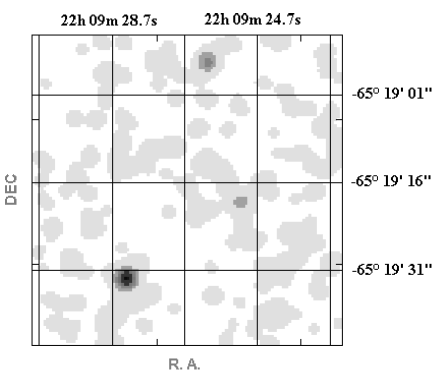
As also reported by Fox (2002), the analysis of the Chandra images reveals three sources inside the MECS error circle, the brightest of which, CXOU J220928.2–651932, shows a decay by a factor 2.5 from the first to the second Chandra observation. In Fig. 4 we show the ACIS–S image accumulated over the first Chandra TOO. From the sum of their X–ray fluxes (810-14 ) we can state that the other two sources do not significantly contaminate the X–ray flux measurement with the MECS of the afterglow source. The total photon count and flux measured during each TOO are reported in Table 1 along with those of the prompt emission.
3.3 Afterglow spectrum
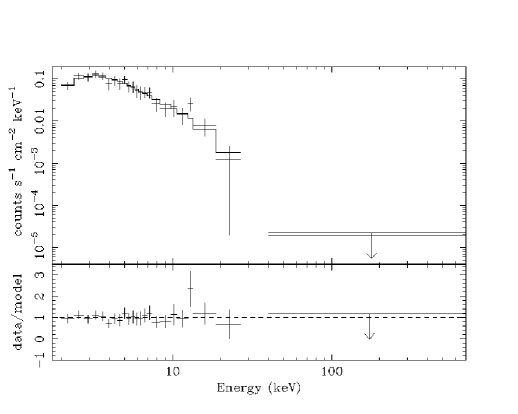
The MECS TOO 1 and ACIS TOO 1 spectra are shown in Figs. 5
and 7, respectively. As can be seen from
Fig. 5, the low statistics do not allow more than 3 bins
with a sufficient number of counts/bin to allow the use of
the statistics.
The fit of this spectrum with an absorbed ( cm-2)
power law (see Table 2)
is only marginally
acceptable (/dof = 5.1/1, null hypothesis probability, NHP, = 0.02),
which could be due to either an excess count in the second energy bin
(3.8–5 keV) or to a shortage count in the first bin (1.6–3.8 keV).
Assuming the latter possibility, we performed a number of
fits with the column density fixed at different values and the
power law parameters free to vary. The result was that the best
description of the data (/dof = 1.1/1) is obtained with N cm-2 and photon index . We note that such an
high value of has never been observed in GRBs or XRFs
(e.g. Frontera (2003))
and it would be very difficult to find a physical interpretation for it.
Moreover, the high value of NH, which
could be due, e.g., to a very dense environment surrounding the source,
is largely inconsistent with that inferred from the WFC spectral measurements of
the prompt emission (see Sect. 3.1).
If, alternatively, we try to fit the excess in the second bin with a Gaussian,
the centroid of this is at
keV. (However, this can be interpreted with extreme caution).
We evaluated the chance probability of this result by means of numerical
simulations. We simulated 1000 spectra by folding an
absorbed power law photon spectrum (, )
with the MECS response function and adding Poisson noise. We also took
into account the MECS background. Each simulated spectrum was rebinned
exactly like the measured spectrum (3 bins). We found that in 11 cases out of
1000 the fit with an absorbed power law gave a ,
corresponding to a chance probability of 0.011 that the observed excess in the
second bin is due to chance.
By increasing the number of spectral bins the MECS TOO 1 spectrum
has the shape shown in Fig. 6, which
actually shows that the excess is concentrated around 4.5–5 keV. By
subdividing the MECS TOO 1 observation in two parts, it turns out that the
feature is observed only in the first part. Also, it is found in both spectra
of the MECS telescope units, thus excluding that it is due to the instability
of one of the detectors.
Fig. 7 shows the ACIS TOO 1 spectrum. No special feature is apparent, even if the fit with a power law absorbed by the average Galactic column density (see Table 2) is not completely satisfactory (, NHP=0.09). Leaving free, we obtain a better fit (), with a best fit value of higher than but poorly constrained. The photon index value is consistent with that derived from the spectral analysis of the first BeppoSAX / MECS observation. Also, the best fit parameters of the power law model for the prompt emission spectrum (Sect. 3.1 and Table 2) are consistent, within statistical uncertainties, with those derived for the afterglow emission.
| Observation | NH | ||
|---|---|---|---|
| (1021 ) | |||
| prompt emission | [0.29] | 2.22 | 7.4/8 |
| (second pulse) | |||
| MECS TOO 1 | [0.29] | 2.0 | 5.1/1 |
| ACIS–S TOO 1 | [0.29] | 1.5 | 4.7/2 |
3.4 Afterglow time behavior
The 2–10 keV light curve of the X–ray afterglow is shown in Fig. 8. The figure also shows the time profile of the prompt emission in three time bins and the WFC flux upper limits to the XRF emission from 100 to 1000 s after the event onset, derived assuming the spectral model which best fits the average spectrum of the prompt emission.
The three points corresponding to MECS TOO 1 and ACIS–S data are well fit by a power law () with a decay index =1.30. In addition, the back extrapolation of the afterglow decay law to the time of the prompt emission is consistent with the last two WFC points, corresponding to the second pulse of the prompt emission, and with the WFC upper limits. Even though we cannot exclude other possibilities, this extrapolation is consistent with the indication, found for several GRBs (e.g. Frontera et al. 2000b), that the afterglow emission starts during the late part of the prompt emission. By including in the fit the two WFC points, we obtain =1.33.


4 Discussion
The nature of XRFs is still an open issue. As discussed in Sect. 1, even if the evidence is mounting that XRFs are a sub-class of GRBs, it is still debated whether observational properties (mainly X–ray richness and peak energies of the order of a few keV or less) are due to intrinsic properties of the fireball (e.g. very low fireball bulk Lorentz factors due to high baryon loading), to a very large distance (z5), or to collimated GRBs seen at large off axis angles.
XRF 020427 offers us the opportunity to fill in some details about the XRF class properties and constrain models of X–ray flashes. Indeed, this is the first XRF for which a joint study of the prompt and X–ray afterglow emission, up to about 17 days after the main event, is presented. We discuss below the main distinguishing features of XRF 020427 and their theoretical implications.
4.1 Common and distinguishing features of XRF 020427 with respect to GRBs
The lower limit (1.2) to the ratio between the 2–28 keV and 40–700 keV fluences is significantly higher than the average value found for normal GRBs (e.g. Feroci et al. (2001); Barraud et al. (2003)), but it is lower than the values (2.8–3.5) found for the BeppoSAX most X–ray rich GRBs, namely GRB 981226 (Frontera et al. 2000a ), GRB 990704 (Feroci et al. (2001)) and GRB 000615 (Maiorano et al. (2003)). Still, XRF 020427 shows a much softer prompt emission spectrum than these events, with keV (see Sect. 3.1). Also an association with the simultaneous ionospheric disturbance (see Sect. 2) favors a very low . The upper limit is consistent with the low–energy tail of the distribution found for a sample including both GRBs and XRFs (Kippen et al. (2003)), but, as it happens for very few XRFs (Kippen et al. (2003)), it is inconsistent with the distribution of GRBs as a function of their duration.
XRF 020427 shows X–ray afterglow emission, like most (90%) of the accurately localized and followed–up GRBs, including the most X–ray rich (Frontera et al. 2000a ; Feroci et al. (2001); Maiorano et al. (2003)). Remarkably, the spectral and temporal properties of the XRF afterglow are similar to those of GRBs. The power law photon index, even though poorly determined (), is not in contradiction with the mean value found for GRBs (1.930.35, Frontera (2003)). The power law decay index = 1.30 is nearly coincident with the average value found for GRBs (1.330.33, Frontera (2003)), and the back extrapolation of the decay law to the time of the primary event is consistent with the late part of the prompt emission, as found for many GRBs (e.g. Frontera et al. 2000b ).
Both the (extrapolated) 2–10 keV fluence of the afterglow in the time interval from 60 s to 106s ( ) and its ratio () to that of the prompt emission in the same energy band are in the range of values found for GRBs (Frontera et al. 2000b ). Nevertheless, the lower limit to the ratio (1.13) between the 2–10 keV afterglow fluence and the gamma–ray (40–700 keV) fluence of the prompt emission is much greater than the values typically found for GRBs, which range from few percent to 30% (e.g. Frontera et al. 2000b ). This could indicate that XRFs are events in which fireball internal shocks, thought to be responsible for most of the GRB prompt emission, are poorly efficient, whereas the external shock(s) generating the afterglow emission work with the same efficiency as for normal GRBs.

4.2 Redshift and energetics of XRF 020427
As discussed in Sect. 2, a redshift upper limit of 2.3 has been estimated for the candidate host galaxy of XRF 020427 (Van Dokkum & Bloom (2003)). From the X–ray data we derive further redshift constraints for this XRF event.
A possible estimate derives from the relationship for GRBs between the intrinsic peak energy of the spectrum, (not to be confused with the observed peak energy ), and the isotropically radiated energy, Erad, (Amati et al. (2002)). This relationship may very well apply to XRFs, as exemplified by XRF 020903 and XRF 030723, if the estimates of their redshift are true (Lamb et al. (2003)). From the derived upper limit to the observed peak energy, keV (see Sect. 3.1), the vs. relation is satisfied for z0.1–0.2, with erg.
Also from the peak luminosity versus variability correlation found by Vetere et al. (2003) we can derive a redshift estimate. Using a sample of GRBs simultaneously detected by the BeppoSAX WFC and GRBM with known redshifts, Vetere et al. (2003) found that the gamma–ray (40–700 keV) peak luminosity, Lγ, is related to the X–ray (2–28 keV) light curve variability, VX, according to L, similar to the correlation found by Reichart et al. (2001) for the peak luminosity – gamma–ray variability Vγ (L). For XRF 020427, we evaluated VX following Vetere et al. (2003), and we derived the gamma–ray (40–700 keV) peak flux from the measured 2–28 keV peak flux assuming the average spectrum derived in Sect. 3.1. The redshift values which satisfy the Lγ vs. VX relation are in the range 0.3–0.9.
Assuming the highest redshift upper limit (), we get the following upper limits to and : keV and erg, where was evaluated following the method described by Amati et al. (2002), assuming as spectral shape a Band law (Band et al. (1993)) with , keV and (see Sect. 3.1) and a flat Friedman-Robertson–Walker cosmological model with km s-1 Mpc-1, , (e.g. Carroll et al. (1992)).
4.3 Testing the off axis jet scenario
From the redshift upper limits derived above it follows that the extreme softness of XRF 020427 is not a redshift effect. A possible explanation is that XRF 020427 involves a collimated jet seen at large off axis angle, as proposed by various authors (e.g. Granot et al. (2002); Rossi et al. (2002); Yamazaki et al. (2002)).
Assuming a uniform jet with half opening angle and Lorentz factor , it can be shown that the value of measured at a viewing angle with respect to the jet axis is constant if but decreases by a factor for (e.g. Yamazaki et al. (2002)). In structured jet scenarios (e.g. Rossi et al. (2002)), is a function of also for in a way that depends on the beam profile assumed. Assuming a uniform jet emission, from the derived upper limit of the observed peak energy and the above formula we get , if XRF 020427 is a normal GRB with an on axis value of 200 keV, a typical Lorentz factor of 150 (Frontera et al. 2000b ), and a redshift inferred above.
However the off axis jet models foresee that, for large off axis observers (i.e., for ) the afterglow light curve should be characterized by a sharp (case of a uniform jet) or smooth (case of a structured jet) rise, a peak and a subsequent power law decay (e.g. Granot et al. (2002); Rossi et al. (2002)). This behavior is not found in our data: the afterglow flux monotonically decays as a power law from the second half of the prompt emission, 25 s from the event onset, up to the end of the second Chandra TOO, 17 days after the event onset. The only possibility to meet the expectations of these models is that the afterglow peak is achieved during the second pulse of the prompt emission. However, for viewing angles greater than the lower limit estimated above, the peak is expected to occur at much later times (e.g. Granot et al. (2002); Rossi et al. (2002); Dalal et al. (2002)). Thus, the interpretation of the X–ray data in terms of an off axis observation of XRF 020427 is difficult.
If we abandon the off axis hypothesis, we can set a lower limit to the afterglow light curve break time days by assuming that the decay is indeed monotonic from the prompt emission up to the end of the second Chandra TOO. By using the relation hr (Sari et al. (1999)) and assuming n = 1 cm-3 and z0.9 (as discussed above), which implies 0.5, we derive a lower limit to the jet opening angle of . We note that higher values of would increase the lower limit to . The value of is expected to be about 1–10 cm-3 for events occurring within a galaxy outside star forming regions and, in principle, could be as high as 105–106 cm-3 for events occurring in dense star forming regions (e.g. Bottcher et al. (1999); Ghisellini et al. (1999)). However, the estimated values of for several GRBs never exceed 50 cm-3 (e.g. Panaitescu & Kumar (2001)). In addition, the lack of evidence of a NH higher than the average galactic one along the line of sight, the absence of a break in the afterglow light curve, which is expected in case of an early transition from relativistic to sub–relativistic expansion due to a very dense circum–burst material (e.g. Huang et al. (1998); Dai & Lu (1999); in ’t Zand et al. (2001)), and the blue color of the host galaxy favor the hypothesis of a low or moderate density of the medium surrounding XRF 020427. Thus, is a reasonable assumption.
4.4 Testing the fireball baryon loading
Given that there is no evidence supporting the observation of a narrow relativistic jet seen from large viewing angles with respect to the jet axis, other scenarios need to be investigated.
In internal shock models, it is found (e.g. Zhang & Mészáros (2002); Mochkovitch et al. (2003)) that a low value of is the consequence of a clean fireball with a high , because in this case the shocks are expected to be less efficient due to the lower contrast of the Lorentz factor between two colliding shells and to the greater distances from the central engine, and thus lower magnetic field, at which the shocks occur.
In the external shock scenario, a natural way to obtain a low value of Ep is a dirty fireball, i.e. a fireball with a higher baryon loading and thus a lower Lorentz factor with respect to normal GRBs (e.g. Dermer (1999)). In this scenario is positively correlated with .
Assuming that the second pulse of the XRF is the peak of the afterglow flux, one can derive the Lorentz factor from the afterglow rise time (with respect to the GRB onset), , the number density, , of the ambient medium and the afterglow energy, , released in the shock, according to Sari & Piran (1999), . Taking into account that ranges from to erg, depending on in the range from 0.1 to 0.9 (see Sect. 4.2) and s (corresponding to the second pulse), we get . This value is of the same order of magnitude as normal GRBs (e.g. Frontera et al. 2000b) and favors the hypothesis that the prompt emission is generated by internal shocks in a clean fireball. In this computation we assumed = 1, which is a reasonable value for this source as discussed in Sect. 4.3 . We note that assuming a value of as high as 100 would reduce by a factor of 2 the estimated lower limit to .
5 Conclusions
Up to very recently, the study of XRFs and their comparison with GRBs was based on the prompt emission only (e.g. Heise et al. 2003, Kippen et al. 2003). In this paper we presented for the first time a detailed and joint analysis of the prompt and afterglow X–ray emission of an X–Ray Flash (XRF 020427). The prompt event emission was observed with the BeppoSAX WFC and GRBM, while the afterglow emission was measured with the BeppoSAX MECS and Chandra ACIS instruments.
The prompt emission spectral analysis shows that XRF 020427 belongs to the class of very soft events ( keV). The spectral hardness and the duration of the event are inconsistent with the correlation found between these two quantities for normal and X–ray rich GRBs.
The X–ray afterglow intensity, spectrum and temporal decay are similar to those of normal GRBs. Also, the extrapolation of the afterglow decay law back to the time of the primary event is consistent with the flux of the late prompt emission, as commonly found for normal GRBs (Frontera et al. 2000). A marginally significant excess on the continuum was found at keV in the MECS spectrum of the afterglow source during the first BeppoSAX observation.
The XRF properties do not seem a consequence of a high GRB redshift. By assuming that the relationships between intrinsic peak energy and total radiated energy (Amati et al. (2002)) and between peak luminosity and X–ray variability (Vetere et al. (2003)) found for normal GRBs hold also for XRFs, we find 0.9. These estimates further constrain the upper limit of inferred for the host galaxy redshift.
We have investigated possible scenarios to interpret the derived XRF emission properties. Assuming a homogeneous off axis jet model (e.g. Granot et al. (2002)), the measured peak energy of the spectrum of the prompt emission could be interpreted as due to a large off axis viewing angle of the jet (at least larger than the jet opening angle ). However the afterglow light curve shows a monotonic decay from the prompt emission up to 17 days after the event onset, in contrast to the predictions of this model (e.g. Granot et al. (2002)).
Also a highly baryon loaded fireball scenario appears problematic given the high lower limit for the Lorentz factor, in contrast to the predictions of this model (, e.g., Dermer (1999); Huang et al. (2002)) even by assuming a medium density substantially higher than typically observed for GRBs. Instead, the very low value of the peak energy and the high lower limit for point to a clean fireball with high Lorentz factor, in which the XRF is produced by internal shocks with a very low efficiency due to the small contrast of between colliding shells (e.g. Mochkovitch et al. (2003)).
Acknowledgements.
This research was partly supported by the Italian Space Agency (ASI). We wish to thank the teams of the BeppoSAX Operative Control Center and Scientific Data Center for their efficient and enthusiastic support to the GRB alert program. We also thank the Chandra Data Archive Operations Group for their very useful work. Finally, we thank Ryo Yamazaki for useful discussion and Franco Giovannelli for the thorough critical reading of the paper and useful comments and suggestions.References
- Amati et al. (1999) Amati, L., Frontera, F., Costa, E., et al. 1999, A&AS, 138, 403
- Amati et al. (2002) Amati, L., Frontera, F., Tavani, M., et al. 2002, A&A, 390, 81
- Arnaud (1996) Arnaud, K.A. 1996, in Astronomical Data Analysis Software and Systems V, eds. Jacoby J. and Barnes J., ASP Conf. Series, 101, 17
- Band et al. (1993) Band, D., Matteson, J, Ford, L., et al. 1993, ApJ, 413, 281
- Barraud et al. (2003) Barraud, C., Olive, J.-F., Lestrade, J.P., et al. 2003, A&A, 400, 1021
- Berger et al. (2002) Berger, E., Kulkarni, S.R., Frail, D.A., et al. 2002, GCN Circ., No. 1555
- Bloom et al. (2003) Bloom, J.S., Fox, D., Van Dokkum, P.G., et al. 2003, ApJ, submitted (astro-ph/0303514)
- (8) Boella, G., Butler, R.C., Perola, G.C., et al. 1997, A&AS, 122, 299
- (9) Boella, G., Chiappetti, L., Conti, G., et al. 1997, A&AS, 122, 327
- Bottcher et al. (1999) Bottcher, M., Dermer, C.D., Crider, A.W., & Liang, E.P. 1999, A&A, 343, 111
- Butler et al. (2003) Butler, N., Ford, P., Ricker, G., et al. 2003, GCN Circ., No. 2328
- Carroll et al. (1992) Carroll, S.M., Press, W.H., & Turner, E.L. 1992, ARA&A, 30, 499
- Castro–Tirado et al. (2002) Castro–Tirado, A.J., Gorosabel, J., Sanchez–Fernandez, et al. 2002, GCN Circ., No. 1439
- Cornellisse et al. (2002) Cornelisse, R., Verbunt, F., in ’t Zand, J.J.M., et al. 2002, A&A, 392, 885
- Dai & Lu (1999) Dai, Z.G., & Lu, T. 1999, ApJ, 519, L155
- Dalal et al. (2002) Dalal, N., Griest, K. & Pruet, J. 2002, ApJ, 564, 209
- Dermer (1999) Dermer, C.D., Chang, J. & Bottcher, M. 1999, ApJ, 513, 656
- Dickey and Lockman (1990) Dickey J.M., & Lockman F.J. 1990, ARA&A, 28, 215
- Van Dokkum & Bloom (2003) Van Dokkum, P.G., & Bloom, J.S. 2003, GCN Circ., No. 2380
- Feroci et al. (2001) Feroci, M., Antonelli, L.A., Soffitta, P., et al. 2001, A&A, 378, 441
- Fishman et al. (2002) Fishman, G.J., Woods, P.M., Hossfield, C., & Anderson, L. 2002, GCN Circ., No. 1394
- Fox (2002) Fox, D.W. 2003, GCN Circ., No. 1392
- Fox et al. (2003) Fox, D.W., Kaplan, D.L., Cenko, B., et al. 2003, GCN Circ., No. 2323
- Frontera et al. (1997) Frontera, F., Costa, E., Dal Fiume, D., et al. 1997, A&AS, 122, 357
- (25) Frontera, F., Antonelli, L.A., Amati, L., et al. 2000a, ApJ, 540, 697
- (26) Frontera, F., Amati, L., Costa, E. et al. 2000b, ApJS, 127, 59
- Frontera (2003) Frontera, F., 2003, in: ”Supernovae and Gamma-Ray Bursters”, edited by K. W. Weiler, Lecture Notes in Physics 598 (Springer, Berlin Heidelberg), p. 317
- Fruchter et al. (2002) Fruchter, A.S., Rhoads, J., Burud, I., et al. 2002, GCN Circ., No. 1440
- Fynbo et al. (2004) Fynbo, J.P.U., Sollerman, J., Hjorth, J., et al. 2004, ApJ, 609, 962
- Gal–Yam (2002) Gal–Yam, A. 2002, GCN Circ., No. 1556
- Garmire et al. (2003) Garmire, J.P., Bautz, M.W., Ford, P.G., Nousek, J.A., & Ricker, G.R., et al. 2003, SPIE Conf. Proc., 4851, 28
- Ghisellini et al. (1999) Ghisellini, G., Haardt, F., Campana, L., Lazzati, D., & Covino, S. et al. 1999, ApJ, 517, 168
- Granot et al. (2002) Granot, J., Panaitescu, A., Kumar, P., & Woosley, S.E., et al. 1999, ApJ, 570, L61
- Harrison et al. (2001) Harrison, F.A., Yost, S., Fox, D.W., et al. 2001, GCN Circ., No. 1143
- Heise et al. (2003) Heise, J., n ’t Zand, J., Kippen, M., & Woods, P. et al. 2003, AIP Conf. Proc., 662, 229
- Huang et al. (1998) Huang, Y.F., Dai, Z.G., & Lu, T. 1998, A&A, 336, L69
- Huang et al. (2002) Huang, Y.F., Dai, Z.G., & Lu, T. 2002, MNRAS, 332, 735
- Kippen et al. (2003) Kippen, R.M., Woods, P.M., Heise, J., et al. 2003, AIP Conf. Proc., 662, 244
- Jager et al. (1997) Jager, R., Mels, W.A., Brinkman, A.C., et al. 1997, A&AS, 125, 557
- Lamb et al. (2003) Lamb, D.Q., et al. 2003, ApJ, submitted
- Maiorano et al. (2003) Maiorano, E., Masetti, N., Palazzi, E., et al. 2003, to be published in Gamma–Ray Bursts in the Afterglow Era - Third Workshop, eds. L. Piro, F. Frontera, N. Masetti, M. Feroci (astro–ph/0302022)
- Mochkovitch et al. (2003) Mochkovitch, R., Daigne, F., Barraud, C., Atteia, J.L. 2003, to be published in Gamma–Ray Bursts in the Afterglow Era - Third Workshop, eds. L. Piro, F. Frontera, N. Masetti, M. Feroci
- Panaitescu & Kumar (2001) Panaitescu, A., & Kumar, P. 2001, ApJ, 560, 49
- Prigozhin et al. (2003) Prigozhin, G., Butler, N., Crew, G., et al. 2003, GCN Circ., No. 2313
- Reichart et al. (2001) Reichart, D.E., Lamb, D.Q., Fenimnore, E.E., et al. 2001, ApJ, 552, 57
- Ricker et al. (2002) Ricker, G., Atteia, J.L., Kawai, N., et al. 2002, GCN Circ., No. 1530
- Rossi et al. (2002) Rossi, E., Lazzati, D., & Rees, M.J. 2002, MNRAS, 332, 735
- Sari et al. (1999) Sari, R., Piran, T., & Halpern, J.P. 1999, ApJ, 519, L17
- (49) Sari, R., & Piran, T. 1999, ApJ, 520, 641
- Soderberg et al. (2002) Soderberg, A.M., Price, P.A., Fox, D.W., et al. 2002, GCN Circ., No. 1554
- Soderberg et al. (2003) Soderberg, A.M., Kulkarni, S.R., Berger, E., et al. 2002, ApJ, in press
- Taylor et al. (2001) Taylor, G.B., Frail, D.A., Kulkarni, S.R., et al. 2001, GCN Circ., No. 1136
- Vetere et al. (2003) Vetere, L., Soffitta, P. & Costa, E. 2003, to be published in Gamma–Ray Bursts in the Afterglow Era - Third Workshop, eds. L. Piro, F. Frontera, N. Masetti, M. Feroci
- Wieringa et al. (2002) Wieringa, H.H., Berger, E., Fox, D.W., & Frail, D., et al. 2002, GCN Circ., No. 1390
- Yamazaki et al. (2002) Yamazaki, R., Yoka, K.S., & Nakamura, T. 2002, ApJ, 571, L31
- in ’t Zand et al. (2001) in ’t Zand, J., Kuiper, L., Amati, L., et al. 2001, ApJ, 559, 710
- in ’t Zand et al. (2002) in ’t Zand, J., Reali, F., Granata, s., Lowes, P., & Piro, L., et al. 2002, GCN Circ., No. 1383
- Zhang & Mészáros (2002) Zhang, B., & Mészáros, P. 2002, ApJ, 581, 1236