Origin of the soft excess in X-ray pulsars
Abstract
The spectra of many X-ray pulsars show, in addition to a power law, a low-energy component that has often been modeled as a blackbody with 0.1 keV. However the physical origin of this soft excess has remained a mystery. We examine a sample of well-studied, bright X-ray pulsars, which have been observed using ROSAT, ASCA, Ginga, RXTE, BeppoSAX, Chandra, and XMM-Newton. In particular, we consider the Magellanic Cloud pulsars SMC X-1, LMC X-4, XTE J0111.2–7317, and RX J0059.2–7138 and the Galactic sources Her X-1, 4U 1626–67, Cen X-3, and Vela X-1. We show that the soft excess is a very common if not ubiquitous feature intrinsic to X-ray pulsars. We evaluate several possible mechanisms for the soft emission, using theoretical arguments as well as observational clues such as spectral shapes, eclipses, pulsations of the soft component, and superorbital modulation of the source flux. We find that reprocessing of hard X-rays from the neutron star by the inner region of the accretion disk is the only process that can explain the soft excess in all the pulsars with ergs s-1. Other mechanisms, such as emission from diffuse gas in the system, are important in less luminous objects.
Subject headings:
pulsars: general, X-rays: binaries, stars: neutron, accretion, accretion disks1. Introduction
X-ray binary pulsars (XBPs) have provided a fruitful laboratory for high-energy astrophysics since their discovery in the 1970’s (for a review see Nagase, 1989). Many XBPs have been observed extensively, and are useful for studying a variety of astrophysical processes, including accretion onto compact objects, binary interactions, and the effects of strong magnetic fields.
In recent years, studies of XBPs with orbiting observatories such as ROSAT, ASCA, Ginga, RXTE, BeppoSAX, Chandra, and XMM-Newton have allowed for closer scrutiny of the relevant physics. In particular, most bright XBPs outside the Galaxy (for which soft X-rays are not heavily absorbed by Galactic gas) have shown a marked soft excess in their X-ray spectra above the standard power-law model (Nagase, 2002). Authors have proposed a variety of simple models to describe this soft excess, but there has been considerable debate over the origin of this feature in a number of sources. For example, the soft component in LMC X-4 has been modeled as a thermal bremsstrahlung-shaped fan beam (Woo et al., 1996), power-law emission from the upper accretion column (Paul et al., 2002), diffuse bremsstrahlung emission, and/or reprocessing by accreting material at the magnetosphere (La Barbera et al., 2001). In this paper we seek to narrow these candidate mechanisms for the soft excess, by examining the physical processes in light of a wide range of observations.
The Galactic XBP Hercules X-1 (catalog ) has a well-studied soft excess that can be explained by reprocessing of hard X-rays by the inner edge of the accretion disk (Endo et al., 2000; Ramsay et al., 2002). At the moment Her X-1 is the XBP for which the soft excess is best observed and understood, and we will use it to help guide our study of other sources.
Because the Galaxy’s disk contains X-ray–absorbing gas, the soft excess is not easy to observe in most Galactic XBPs. This emission is best seen in the Magellenic Clouds, at high Galactic latitude where there is not much low-energy absorption. The bright XBPs in these nearby galaxies are generally more luminous than those in the Milky Way and are close enough to obtain good spectra with a high signal-to-noise ratio. In a survey of ASCA observations of the SMC, Yokogawa et al. (2003) found 30 XBPs, of which three have X-ray luminosities large enough to extract good spectra. All three of these sources (SMC X-1 (catalog ), RX J0059.2–7138 (catalog ), and XTE J0111.2–7317 (catalog )) show a clear soft excess feature in the spectrum. The one comparably bright XBP in the LMC (LMC X-4) also shows a soft excess. All four of these sources have ergs s-1.
4U 1626–67 (catalog ), Centaurus X-3 (catalog ), and Vela X-1 (catalog ) in the Galaxy, and EXO 053109–6609.2 and A 0538–66 in the LMC also show soft excess features (Angelini et al., 1995; Burderi et al., 2000; Haberl, 1994; Haberl et al., 2003; Mavromatakis & Haberl, 1993). In addition, a recent survey of the SMC with XMM has revealed soft components in several lower luminosity pulsars (Sasaki et al., 2003). In § 2 we summarize observational studies of the XBPs mentioned above, and in § 3 we examine how common the soft excess feature is in the total population of XBPs and introduce possible mechanisms for its origin. In §§ 4–7 we evaluate these possibilities in terms of both theory and observations. In § 8 we discuss the implications of the results and future work, and in § 9 we summarize our results.
| Her X-1aaTypical ranges of values for spectral parameters, compiled from fits using BeppoSAX (dal Fiume et al., 1998), ASCA (Endo et al., 2000), and XMM (Ramsay et al., 2002). Quoted errors for all sources are at 90% confidence. | SMC X-1bbROSAT/Ginga (Woo et al., 1995), ASCA (Paul et al., 2002). | LMC X-4ccROSAT/Ginga (Woo et al., 1996), BeppoSAX (La Barbera et al., 2001; Naik & Paul, 2004). | XTE J0111.2–7317ddASCA (Yokogawa et al., 2000). | RX J0059.2–7138eeROSAT/ASCA (Kohno et al., 2000). | 4U 1626–67ffBeppoSAX (Orlandini et al., 1998b). | Cen X-3ggBeppoSAX (Burderi et al., 2000). | Vela X-1hhROSAT (Haberl et al., 1994), BeppoSAX (Orlandini et al., 1998a), RXTE (Kreykenbohm et al., 2002) | |
|---|---|---|---|---|---|---|---|---|
| Location | Galaxy | SMC | LMC | SMC | SMC | Galaxy | Galaxy | Galaxy |
| Companion | A star | B0 | O7 III-IV | Be | Be | low-mass | O6–O8 | B0.5Ib |
| Distance (kpc) | 5 | 65 | 50 | 65 | 65 | unknown | 8 | 1.9 |
| Transient? | no | no | no | yes | yes | no | no | no |
| (d) | 1.7 | 3.9 | 1.4 | 0.03 | 2.1 | 8.96 | ||
| (s) | 1.24 | 0.7 | 13.5 | 30.95 | 2.76 | 7.7 | 4.8 | 283 |
| (d) | 35 | 40-60 | 30 | |||||
| (ergs s-1) | ||||||||
| 0.04 | 0.036 | 0.064 | 0.10 | 0.35 | 0.03 | 0.5 | 0.01 | |
| Soft pulses? | yes | yes | yes | yes | no | no | yes | no |
| ( cm-2) | 0.05, 100iiThe two values for indicate interstellar absorption and partially covering absorption instrinsic to the source. | 2–5 | 0.5 | 0.42– | , 150iiThe two values for indicate interstellar absorption and partially covering absorption instrinsic to the source. | |||
| 0.9–1.2 | 0.9 | 0.5–0.7 | 1.4 | |||||
| (keV) | 24 | 6 | 16–18 | |||||
| (keV) | 15 | 15–35 | 18–35 | |||||
| (keV) | 6.5 | 6.5 | 6.4 | 6.4 | 6.4 | |||
| (keV) | 24, 55 | |||||||
| Soft excess model typesjjSpectral models used for the soft excess are: BB–blackbody, TB–thermal bremsstrahlung, SPL–soft power law or broken power law, MEK–MEKAL thin-thermal model, COM–COMPST Comptonization model, LE–broad low-energy line emission, lines–resolved individual emission lines. Commas indicate separate fits, plus signs indicate fits with two components. | BB, BB+LE | BB, TB, SPL | BB, BB+TB, COM, SPL | SPL | MEK, SPL | BB | BB | TB, lines |
| (keV) | 0.09–0.12 | 0.15–0.18 | 0.15 | |||||
| (keV) | (TB) | (COM) | 0.37 (MEK) | |||||
| plus (keV) | 0.03–0.17, 0.5–0.8 | 0.4– | ||||||
| Low-E line energies (keV) | 0.95 | 0.9, 1.9 | 1.05 |
2. Observational background
Here we review a number of observations of XBPs with a soft excess. Orbital and spectral parameters for each source are compiled in Table 1.
2.1. Her X-1
Her X-1 was one of the first known X-ray pulsars (Tananbaum et al., 1972) and is one of the few with a low-mass companion. It has a pulse period of 1.24 s and an orbital period of 1.7 days. The system is at high inclination, and the A7 companion star, with a mass of 2 , eclipses the pulsar every orbital period (Middleditch & Nelson, 1976). In addition there is a 35–day cycle in the X-ray intensity, consisting of “main-on” and “short-on” states separated by two “low” states in which the X-ray flux drops by several orders of magnitude (Jones & Forman, 1976). This modulation is believed to be due to a tilted precessing accretion disk that periodically blocks the central X-ray source (see Scott & Leahy, 1999, for a review). Given a distance of 5 kpc, Her X-1 has ergs s-1.
The spectrum of Her X-1 has been extensively studied, and is generally fitted with a cutoff power law with , a blackbody with keV, and often broad–line emission at 1 keV. There is also iron emission at 6.5 keV and a cyclotron feature at 40 keV (dal Fiume et al., 1998). The energy of the (fundamental) cyclotron line is related to the field by
where is the gravitational redshift (i.e., Coburn et al., 2002). For surface emission from a neutron star with km and , we have (Coburn et al., 2002). Usually neither nor is well constrained, so for simplicity we take G in this paper. Thus, Her X-1 has G.
The pulsations of the soft component are generally smoother than and out of phase with the hard component (McCray et al., 1982; Endo et al., 2000). This phase offset varies over the superorbital period (Ramsay et al., 2002), supporting the idea that the soft excess is emitted by the precessing accretion disk. We discuss this process in detail in § 7.
2.2. The luminous Magellanic Cloud XBPs
SMC X-1 is a luminous, eclipsing, high-mass XBP system. It was first identified as a point source in Uhuru observations by Leong et al. (1971). Eclipses were discovered by Schreier et al. (1972a) and X-ray pulsations by Lucke et al. (1976). The optical counterpart is Sk 160, a B0 I supergiant (Webster et al., 1972; Liller, 1973). The orbit is close to circular, with orbital period 3.9 days and pulse period 0.7 s. The source has a high ergs s-1. As in Her X-1 there are large, quasi-periodic variations of an 60 day period between high and low states of the X-ray flux, attributed to blocking by a precessing disk (Gruber & Rothschild, 1984). These variations are stable, and the period of the cycles oscillates from 50 to 60 days (Wojdowski et al., 1998). This oscillation is itself periodic on the order of years (Clarkson et al., 2003). The spectrum of SMC X-1 is usually fitted as a cutoff power law with , an iron line at 6.4 keV, and a soft component modeled as a broken power law, thermal bremsstrahlung, or a blackbody with keV. Paul et al. (2002) fitted four different models to the soft component and found that all gave satisfactory fits. Similarly to Her X-1, they found that the soft component pulses roughly sinusoidally, out of phase with the sharper-peaked power law.
LMC X-4 is a high-mass XBP very similar to SMC X-1, and was also discovered by Uhuru observations (Giacconi et al., 1972). Its companion is an 0 III-IV star (Sanduleak & Philip, 1977). It is eclipsing (Li et al., 1978; White, 1978) and has a pulse period of 13.5 s (Kelley et al., 1983) and an orbital period of 1.4 days. LMC X-4 also has a stable superorbital period of 30 days, again attributed to a precessing disk (Lang et al., 1981). About once per day the source shows flares lasting 20–45 minutes during which the X-ray flux increases by up to 20 times (e.g., Levine et al., 1991). Like SMC X-1, the high-state spectrum is fitted by a cutoff power law (), with a soft component modeled in a variety of ways suggesting different emission mechanisms. In the low state, the power law hardens to (Naik & Paul, 2002). There are iron emission at keV and a cyclotron feature at 100 keV (La Barbera et al., 2001) giving G. Similar to SMC X-1, the soft component pulses more smoothly than the hard component and is perhaps out of phase with it (Woo et al., 1996; Paul et al., 2002). For both SMC X-1 and LMC X-4, Paul et al. (2002) argue that the soft component is likely not thermal in origin and is best described by power-law emission from the upper accretion column.
XTE J0111.2–7317 is a bright, transient XBP in the SMC with a probable Be star companion. It was discovered in 1998 November, simultaneously by RXTE (Chakrabarty et al., 1998) and BATSE (Wilson & Finger, 1998), and has a pulse period of 30.95 s. The source showed two outbursts of 20 and 40 days in duration, and the pulsar was spinning up with a very short timescale of yr (Yokogawa et al., 2000). The likely Be companion may be embedded in an H II region (Coe et al., 2003, 2000). Given a distance of 65 kpc to the SMC, the source had a 0.7–10 keV luminosity of ergs s-1. The ASCA spectrum is an inverse, broken power law with iron emission at 6.4 keV, along with a soft component that was modeled as a broken power law, thermal bremsstrahlung, or blackbody (Yokogawa et al., 2000). Variations in the soft X-ray band indicate that the soft component is pulsing.
RX J0059.2–7138 is another bright transient Be/XBP in the SMC. It was discovered as a serendipitous source in a short pointing of ROSAT (Hughes, 1994). The ROSAT plus ASCA spectrum has luminosity ergs s-1, and the hard component is fitted by a cutoff power law with (Kohno et al., 2000). The soft component, for which , was fitted using either a soft broken power law in addition to the hard power law or a thin-thermal emission model (MEKAL; Mewe et al., 1986) with keV. Fitting this model required a very low value for overall metal abundance in the emitting gas ( ), but with a highly enhanced oxygen abundance in the absorbing column ( ). Unlike the four sources discussed above, its soft component does not pulsate.
2.3. Other pulsars with a soft excess
We know of three other well-studied XBPs that show a soft excess. 4U 1626–67, like Her X-1, is one of the few XBPs with a low-mass companion. X-ray pulsations with period 7.7 s were first detected by SAS 3 (Rappaport et al., 1977), and a faint, blue optical counterpart was identified by McClintock et al. (1977). There is an unusually short orbital period of 41.4 minutes (Middleditch et al., 1981), which rules out a hydrogen-burning main sequence star for the companion. In 1990 June the steady spin-up of the source suddenly changed to a spin-down state that continues to the present. The spectrum has repeatedly been fitted with power law () plus blackbody ( keV) and emission–line features at 1 keV (Angelini et al., 1995; Owens et al., 1997; Orlandini et al., 1998b; Schulz et al., 2001). The pulse fraction is much lower for soft than hard X-rays (Owens et al., 1997), suggesting that the soft component is not pulsing. Orlandini et al. (1998b) discovered a cyclotron absorption feature at 35 keV, implying that G. They found the broadband (0.1–200 keV) X-ray luminosity to be ergs s-1) . The distance is not well constrained, so it is difficult to make reliable conclusions about the physical processes in this source.
There is also evidence for a soft excess in Cen X-3. It is a high-mass XPB, with pulse period of 4.8 s and orbital period of 2.1 days (Schreier et al., 1972b), and the O-type companion is estimated to be at a distance of 8 kpc (Krzeminski, 1974). The hard continuum has a typical cutoff power-law shape, with iron line emission at 6.5 keV (Nagase et al., 1992; Burderi et al., 2000) and a cyclotron line feature at 30 keV (Santangelo et al., 1998; Burderi et al., 2000; Coburn et al., 2002), giving G. Using BeppoSAX data, Burderi et al. (2000) found a bright pulsating soft excess with a blackbody shape ( keV). In this observation Cen X-3 had a large ergs s-1.
Vela X-1 also shows a soft excess. It has a long pulse period of 283 s (McClintock et al., 1976) and an orbital period of 8.96 days (Forman et al., 1973). The power-law spectrum has –1.7 (Sako et al., 1999; Choi et al., 1996) and the distance is 1.9 kpc (Sadakane et al., 1985), indicating ergs s-1. There are cyclotron features at 24 and 55 keV (Kreykenbohm et al., 2002; Kretschmar et al., 1996), indicating G. The ROSAT spectrum showed a soft, non-pulsing thermal bremsstrahlung component with keV, attributed to shock-heated optically thin emission by the strong stellar wind (Haberl, 1994). This was similar to the high-mass X-ray binary 4U 1700–37, which had a remarkably similar ROSAT soft excess spectrum (Haberl et al., 1994). However, high-resolution grating spectroscopy of these sources with Chandra showed that in eclipse there were emission lines that likely came from material that was not collisionally excited but was photoionized by the X-rays from the neutron star (Schulz et al., 2002; Boroson et al., 2003). We discuss collisionally heated and photoionized gas emission in §§ 5–6, respectively.
There are two additional transient Be/XBPs in the LMC for which a spectrally-fitted soft excess has been seen. EXO 053109–6609.2 (catalog ) was the brightest source in a survey of the LMC by Haberl et al. (2003), who estimated ergs s-1. They fitted the soft component as thin-thermal (MEKAL) emission with reduced abundances (0.29 ) of elements heavier than oxygen. A 0538–66 (catalog ) was seen in two outbursts with ROSAT (Mavromatakis & Haberl, 1993), when the source had – ergs s-1. They fitted the spectra with a power law, , a soft blackbody, keV, and a thermal bremsstrahlung, , although the spectra have a relatively low number of counts so there may be considerable uncertainty in these parameters. The authors speculate that the blackbody component may be emitted from near the radius of the neutron star, while the bremsstrahlung component may be powered by collisional heating of the stellar wind. Although we mention EXO 053109–6609.2 and A 0538–66 here, they have little spectral information in soft X-rays, so we do not discuss them in detail.
3. Ubiquity of the soft excess
| Source | Flux (ergs cm-2 s-1) | Energy range (keV)aaEnergy range over which the flux is defined | ( cm-2) | Mission | Reference |
|---|---|---|---|---|---|
| Soft excess observed | |||||
| Her X-1 | 0.3–10 | 0.005 | XMM | 1 | |
| SMC X-1 | 0.7–10 | 0.5 | ASCA | 2 | |
| LMC X-4 | 0.7–10 | 0.057 | ASCA | 3 | |
| XTE 0111.2–7317 | 0.7–10 | 0.18 | ASCA | 4 | |
| RX J0059.2–7138 | 0.2–2 | 0.088 | ROSAT | 5 | |
| 4U 1626–67 | 0.5–10 | 0.5 | Chandra | 6 | |
| Cen X-3 | 2.0–10 | 1.95 | BeppoSAX | 7 | |
| Vela X-1 | 2.0–10 | 0.86 | BeppoSAX | 8 | |
| EXO 053109–6609.2 | 0.2–10 | 0.69 | XMM | 9 | |
| A 0538–66 | 0.1–2.4 | 0.08 | ROSAT | 10 | |
| Soft excess not observed | |||||
| GRO J1744–28 | 2.0–10 | 5 | ASCA | 11 | |
| GX 1+4 | 2.0–20 | 20 | ASCA | 12 | |
| OAO 1657–415 | 2.0–10 | 12 | BeppoSAX | 13 | |
| 4U 1145–619 | 0.2–2 | 0.3 | EXOSAT | 14 | |
| 4U 1907+09 | 2.0–10 | 1.9 | ASCA | 15 | |
| GX 301–2 | bolometric | 20 | ASCA | 16 | |
| 2S 1417–624 | 2.0–10 | 1.7 | Einstein | 17 | |
| GRO J1008–57 | 0.1–2.4 | 1.3 | ROSAT | 18 | |
| 4U 1145–619 | 0.2–2 | 0.3 | EXOSAT | 19 | |
| X Persei | 0.1–10 | 0.13 | BeppoSAX | 20 |
References. — (1) Ramsay et al. 2002; (2) Paul et al. 2002; (3) Paul et al. 2002; (4) Yokogawa et al. 2000; (5) Hughes 1994; (6) Schulz et al. 2001; (7) Burderi et al. 2000; (8) Orlandini et al. 1998a; (9) Haberl et al. 2003; (10) Mavromatakis & Haberl 1993; (11) Nishiuchi et al. 1999; (12) Kotani et al. 1999; (13) Orlandini et al. 1999; (14) Mereghetti et al. 1987; (15) Roberts et al. 2001; (16) Endo et al. 2002; (17) Grindlay et al. 1984; (18) Petre & Gehrels 1994; (19) Mereghetti et al. 1987; (20) di Salvo et al. 1998.
In this section we address whether the soft excess is a universal feature of XBPs. All the brightest sources with low absorption show this feature, so it is natural to suspect that it may be present also in other XBPs but not be detected because of either low flux or high absorbing column. In Table 2 we show spectrally-determined values and the unabsorbed fluxes for a number of known XBPs. The sample is taken from Table 1 in Bildsten et al. (1997), plus EXO 053109–6609.2. We have included only sources for which there are observations with sensitivity at the energies of the soft excess less than 2 keV. The fluxes are defined in different bands in the range 0.1–20 keV, so there is some error (factors of a few or so) in the relative fluxes from these sources, although this does not affect the overall pattern observed.
The sources in the sample are plotted as a function of flux and in Fig. 1. The XBPs with a known soft excess are shown as open stars; those without as solid squares. It is clear that the brighter systems with less absorption are far more likely to show a soft excess, and that no sources with high absorption ( cm-2) show this feature. There is an apparent boundary between the sources that show a soft excess and those that do not, suggesting that the observability of this feature depends on flux and .
Marked with an asterisk is the Be/XBP X Persei, which has a markedly different soft excess from the other sources. Coburn et al. (2001) modeled this component as a blackbody with keV, which is an order of magnitude higher than the typical temperature. X Per is very nearby ( kpc) and under-luminous ( ergs s-1) (di Salvo et al., 1998), and the authors attributed the soft component to blackbody emission from the accreting polar cap.


We modeled the detectability of the soft excess at various fluxes and by performing fits to simulated data. The response of the ROSAT PSPC detector (Pfeffermann & Briel, 1986) is used, because many XBPs have been observed with this detector and because it is sensitive in the soft X-ray band. Using XSPEC (Arnaud, 1996), we created simulated PSPC spectra of a source with a spectrum like that of SMC X-1 (, keV, and ), and varied and the overall unabsorbed flux in the 0.2–3 keV band. The simulated exposure time was 25 ks, and counting statistics were included. We also included a typical background spectrum, taken from the PSPC observation of SMC X-1 from 1991 October. This background has a surface brightness in the PSPC band (0.1–2.4 keV) of counts s-1 arcmin-2, which is similar to those found for Cen X-3, LMC X-4, and Her X-1. More details on PSPC observations of these sources are given in § 4.1.
Next, we determined whether each spectrum, after background subtraction, could be fitted with an absorbed power law without a soft excess component. For the fits we took initial values of and and overall normalization from the simulated data, and allowed all these parameters to vary. We recorded for the best fit to each simulation. For low , we conclude that a power law spectrum satisfactorily fits the simulated data and so the soft excess is not detectable. For high the soft excess is detectable.
The fit results are plotted in Fig. 2, along with the XBPs from Fig. 1. Contours of , 1.5, and 2 are shown. For low flux and high (lower right), varies somewhat randomly between 0.8 and 1.2; for clarity, these contours are not shown. We find that the soft excess is detectable in sources with high flux and low , and undetectable for low flux and high . The steep contours of , which indicate the boundary of detectability, are close to and similar in shape to the actual boundary seen in observations. This suggests that many sources with low flux or high do in fact have a soft component but that this feature has not been observed because of selection effects. We conclude that the soft excess is probably a very common intrinsic feature of XBPs.
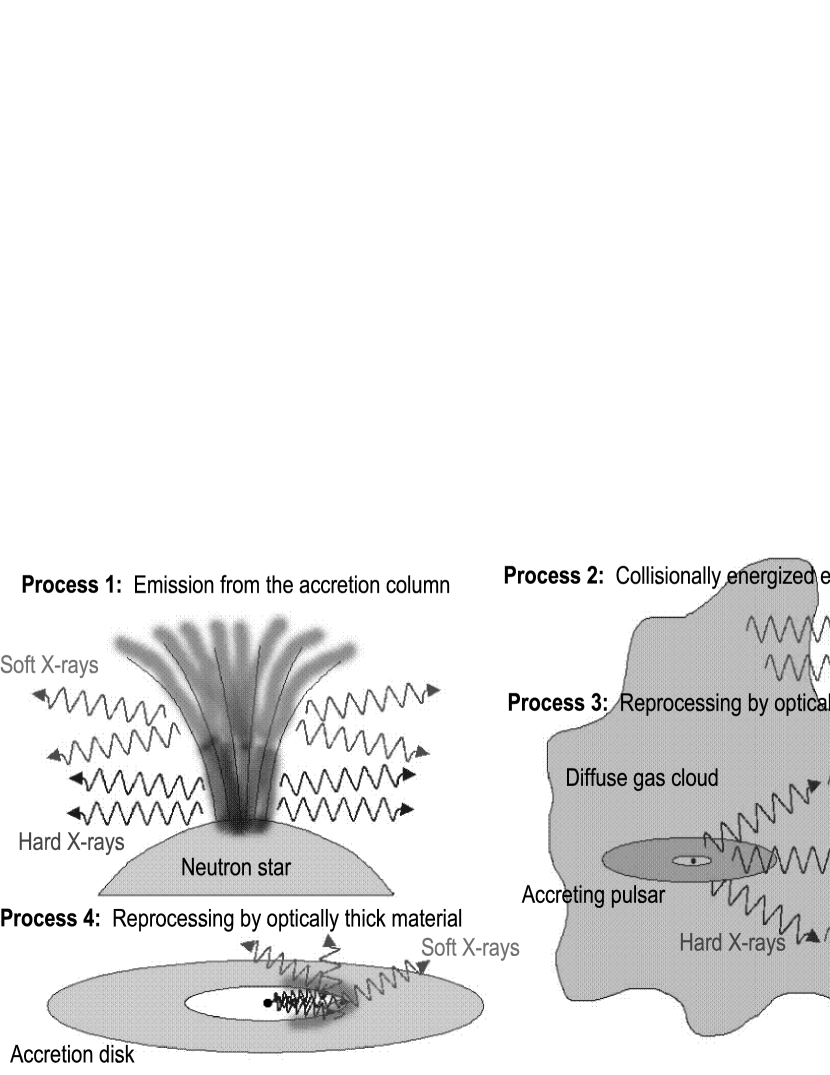
As discussed in § 2, observations of the soft excess in XBPs have been modeled in a variety of ways, many of which require different emission processes. Given the similarities of many of the observed soft components and the apparent ubiquity of this feature, it is likely that it has a common origin in many sources. Possible mechanisms can be separated into four main types:
-
1.
emission from the accretion column,
-
2.
thermal emission from collisionally energized, diffuse gas around the neutron star,
-
3.
reprocessing of the hard (power law) X-rays by diffuse material around the neutron star, and
-
4.
reprocessing by optically thick, dense material around the neutron star.
In the following sections, we consider these four scenarios and examine them in light of observational data and the physics of the relevant emission. Simple schematics of the various models are shown in Fig. 3. For a model to be viable it must satisfy two constraints:
-
1.
the energy balance of the system must be able to produce the observed soft luminosity and
-
2.
the spectrum, pulsation properties, and other observed features must be consistent with model predictions.
4. Emission from the accretion column
It is natural to suspect that the soft component originates in the same region as the hard component, that is, in the column of accreting gas. Low-luminosity soft emission from the polar cap may exist in X Per (di Salvo et al., 1998), and the more luminous soft components in SMC X-1, LMC X-4, and XTE J0111.2–7317 have been modeled by non-thermal broken power-law emission from the accretion column (Yokogawa et al., 2000; Paul et al., 2002). This model predicts soft pulses, because emission is confined to a small region that rotates with the neutron star.
4.1. Brightness temperatures of accretion columns
In XBPs the accreting material flows along magnetic field lines from the magnetosphere, at radius , to the surface of the neutron star at . To estimate the surface area of the accretion column, we follow § 6.3 of Frank et al. (2002). We assume that the magnetic field is a dipole that is tilted by an angle with respect to the accretion disk, and that only field lines that pass through the disk outside accrete. It is straightforward to show that all the accreting field lines intersect the neutron star inside an angle from the pole, where
Thus the radius of the accreting polar cap is
assuming . For the XBPs we consider, cm so for cm, . If we picture the accretion column as a cylinder with height , the surface area of the column is
Here is simply the surface area of the accretion column as a fraction of the neutron star’s surface area, with .
For high , this small area implies a very high temperature for the emitting gas. The minimum temperature for material radiating a spectral luminosity in a given band is the brightness temperature , which is the temperature of a blackbody that would produce the same . For an emitting area ,
The value of for different energy ranges sets a lower limit on the temperature of the gas emitting at those energies.
| Source | Date/Duration (ks) | ( cm-2) | |
|---|---|---|---|
| Her X-1 | 1993 Aug | 5 | 0.003 |
| SMC X-1 | 1991 Oct | 17 | 0.36 |
| LMC X-4 | 1991 Oct–Nov | 33 | 0.05 |
| RX J0059.2–7138 | 1993 May | 5 | 0.04 |
| Cen X-3 | 1992 Jan | 9 | 2 |
| Vela X-1 | 1992 Nov | 17 | 0.5 |
We used data from the ROSAT PSPC observations for Her X-1, SMC X-1 LMC X-4, and Cen X-3, as well as RX J0059.2–7138 and Vela X-1, which we include for comparison even though their lack of soft pulsations would appear to rule out accretion column emission. Data on these observations are given in Table 3. The PSPC is a proportional counter detector with response at low energies, from 0.1 to 2.4 keV, and with spectral resolution (Pfeffermann & Briel, 1986). We obtained the data from the NASA HEASARC archive and used the standard event-screening criteria. We extracted the source and background spectra from circular and annular regions centered on the source. In the case of RX J0059.2–7138, a nearby supersoft source (1E 0056.8–7154) was excluded from the selection regions, as described in Kohno et al. (2000).
We assume that all the observed flux in the spectrum comes from a column of area and determine as a function of energy. We use energy bins corresponding to the PSPC resolution and fit each bin with a power law of constant energy (photon ), modified by typical values of (shown in Table 3). Each XSPEC fit gives the normalization of the power-law (in photons cm-2 s-1 keV-1 at 1 keV) and its error. The energy flux in each bin (from to ) is then
Given distances listed in Table 1, we calculate the luminosities and then in each bin. To obtain a lower limit on , we use the lower limit on .
The isotropic luminosity observed in a given bin is
and the luminosity emitted from the accretion column in that bin is

Letting , and using , we have
We solve this numerically to find . In the Rayleigh-Jeans limit this gives, for , km, and in keV, and , the luminosity in the bin in ergs s-1,
For each source we plot the values of , given , in Fig. 4. Vela X-1 and Cen X-3 are highly absorbed below 0.5 keV, so we do not calculate for those energies.
As expected, is higher for more luminous sources. For low energies, we find that for SMC X-1, LMC X-4, and RX J0059.2–7138, the observed flux gives K, even for a relatively large accretion column area (). At higher energies, we have K (and, remarkably, K for SMC X-1). These values represent the minimum possible temperatures of the gas emitting at these energies. Are these temperatures consistent with models of accretion columns? In general, such models have been separated into two types, depending on the shock mechanism that decelerates the gas as it approaches the neutron star’s surface. The shock can be dominated by gas pressure (for low systems) or by radiation pressure (for ergs s-1). The latter models are applicable for the luminous XBPs. This type of accretion column consists of a mound of subsonic, settling material below a radiation-dominated shock front (Becker, 1998). Burnard et al. (1991) modeled the dynamics and emission properties of the accretion mounds, and found that temperatures in the mound vary from K at the outer boundary to K at large optical depths.
Burnard et al. (1991) note that the accretion mound emission is Compton-scattered by the overlying shock, which could increase . In principle, if the gas free-falls all the way to the neutron star’s surface and is stopped in a thin shock, then temperatures of K are possible (Shapiro & Teukolsky, 1983). However, we expect that collisions in the column would slow the gas, and it is expected that a radiative shock is not perfectly thin but has width approximately equal to the radius of the polar cap (Becker, 1998). Therefore we expect the shock temperature to be lower. It is difficult to see how Comptonization by a real shock could produce the very high soft fluxes observed.
This result raises the interesting, puzzling question of how, for SMC X-1, even the hard emission above 1.5 keV could be produced by the accretion column. For a large column size , the K is hotter than models predict. This suggests that either the column is larger in extent (i.e. ) or it is more energetic ( K) than predicted. This question is worth investigating in future work.

4.2. Comparison with cyclo-synchrotron spectra
Even if accretion column temperatures are very high, it is difficult to produce the observed soft spectral shapes. For high K, blackbody or thermal bremsstrahlung emission would produce the majority of the flux at energies keV, which is inconsistent with observations. One possible way out is to note that, in the large magnetic field of the accretion column, the dominant emission process is likely to be cyclo-synchrotron radiation. If this radiation is thermal, the peak of the emission can be at much lower energies than . The shape of this spectrum has been calculated in rigorous detail by Mahadevan et al. (1996), who show that it is a function of , where
is the (non-redshifted) cyclotron energy. Therefore, the energy range of cyclo-synchrotron emission depends largely on . We plot the calculated spectra from Mahadevan et al. (1996) in Fig. 5.
At K, which is smaller than the minimum that we obtained for the luminous XBPs at low energies, the spectrum peaks at . A typical soft component in the luminous XBPs has the peak of at keV. For cyclo-synchrotron emission to peak at this energy, we require that
implying that G. For a dipole field with surface strength G,
implying that the emission must come from a radius . This is much larger than the expected size of the accretion column, and the gas cannot attain such a high temperature so far from the neutron star.
It is difficult to conceive of any other emission mechanism that could produce a high soft luminosity from a small area and yet have the spectrum cut off at the energies observed. We conclude that in the luminous XBPs (SMC X-1, LMC X-4, RX J0059.2–7138, XTE J0111.2–7317, and Cen X-3), the soft component must be emitted from a region larger than the surface of the neutron star.
5. Emission by a collisionally energized cloud
A large, diffuse cloud of gas around the neutron star would have the size needed to produce the high and might be powered by collisional energy. Such emission may exist in Vela X-1 and 4U 1700–37 (Schulz et al., 2002; Boroson et al., 2003), and perhaps also in RX J0101.3–7211 and AX J0103–722, which were observed in the XMM survey of the SMC by Sasaki et al. (2003). These sources have ergs s-1, and were fitted with a power law plus an optically thin thermal emission model (MEKAL) with keV.
Collisional heating is expected in XBP systems; a detailed hydrodynamic simulation of LMC X-4 by Boroson et al. (2001) found shocks and wake structures that could heat the gas and cause optically thin X-ray emission (Fransson & Fabian, 1980). Fitting a thin thermal emission model to data from SMC X-1 and LMC X-4, Paul et al. (2002) found that the observed high requires , which for typical gas density cm-3 implies a very large emission region of cm. The same is true for XTE J0111.2–7317 and RX J0059.2–7138, which have similar soft spectra.
The large emission region immediately rules out this process for sources with a soft component with short pulsations, such as SMC X-1 and XTE J0111.2–7317. A pulse period of about a few seconds is much shorter than the light-crossing time of such a large cloud, and so the cloud’s emission could not pulsate. For SMC X-1 and LMC X-4, the size of the emitting region is also constrained by the drop of the soft flux during eclipses (Vrtilek et al., 2001; Boroson et al., 2001). The eclipse light curves for SMC X-1 and LMC X-4 (e.g., Woo et al., 1995; La Barbera et al., 2001) show that the soft flux falls with a timescale of the total eclipse duration. Thus, cm. Such arguments rule out collisionally energized emission for SMC X-1, LMC X-4, and XTE J0111.2–7317, but the process may still be important in RX J0059.2–7138, which shows neither eclipses nor pulsation at soft energies.
In XBPs the main input of kinetic energy is from a wind, simply , where is the wind velocity, typically 2000 km s-1. Mass loss rates from the star and from the irradiated accretion disk are typically yr-1, giving ergs s-1. Such emission can easily power the soft components of lower luminosity XBPs such as Vela X-1. However, it is possible for the more luminous soft excess of RX J0059.2–7138 only if there is a very vigorous wind for which all the kinetic energy is converted to soft X-rays. This is unlikely.
In addition, diffuse thermal emission in RX J0059.2–7138 should show line emission from metals. In their MEKAL fit to the ASCA spectrum, Kohno et al. (2000) obtain an extremely low , which fits best because it greatly reduces the flux of most X-ray lines. While the metallicity of the SMC is expected to be low, this value is unrealistic. It is more likely that the non-detection of lines is due to optically thick (blackbody-like) emission, which we discuss in § 7.
We conclude that collisionally energized diffuse emission can power the soft excess only in systems with ergs s-1. This may explain part of the soft components in Vela X-1 and 4U 1700–37, but in RX J0059.2–7138 the soft excess is too luminous for this process. With high spectral resolution observations, it is possible to easily identify this type of emission by the presence of X-ray emission lines. In addition there should be other spectral signatures from diffuse gas around XBPs, because of photoionization of the gas by the central X-ray source. We discuss this process in the next section.
6. Reprocessing by a diffuse cloud
It is possible that the soft flux arises from reprocessing of the hard X-rays by a diffuse cloud of gas around the neutron star. Such a cloud must absorb and re-radiate a fraction of the incident hard luminosity equal to and must produce an output spectrum like those observed in XBPs. Because of the high in these systems, the gas is highly photoionized by the X-ray flux. Emission from such a gas may contribute to the soft excess in Vela X-1 and 4U 1700–37 (Boroson et al., 2003; Schulz et al., 2002). The XSTAR code is designed to calculate the detailed structure of photoionized gas, and has been used extensively to model the circumstellar environments in XBPs. For details on the code and its applications, see Kallman & Bautista (2001).
XSTAR works by determining the temperature, ionization and excitation structure of a spherical gas cloud illuminated by a central point source of X-rays. It calculates the absorption by the gas due to photoionization and Compton heating and the emission from the gas through recombination, free-free emission, and atomic line emission. In the case of an optically thin low-density ( cm-3) gas, the structure is a function simply of the ionization parameter , where is the luminosity of the central source, is the number density of the gas, and is the distance from the source (Tarter et al., 1969).
XSTAR has been used by Wojdowski et al. (2000) and Boroson et al. (2001) to compare the observed eclipse spectra from SMC X-1 and LMC X-4 with hydrodynamic simulations. Vrtilek et al. (2001) used XSTAR to analyze relatively low-luminosity ( ergs s-1) photoionized line emission from SMC X-1 seen in Chandra ACIS spectra. In eclipse and in the low state (when the neutron star was blocked by the disk), they found lines that correspond to XSTAR simulations with . Vrtilek et al. (2001) found that at a radius of cm from the neutron star, these values for indicate a gas density of cm-3.
For most of the XBPs with ergs s-1, we do not expect a diffuse cloud to be the source of the soft excess as discussed in § 5. However, such a scenario is possible in RX J0059.2–7138, which does not show soft pulsations or eclipses, and so we test the possiblity that optically thin reprocessing is the main source of the soft excess in this system. We have used the latest version of XSTAR, version 2.1k, to simulate the photoionized gas in this source.
6.1. XSTAR input
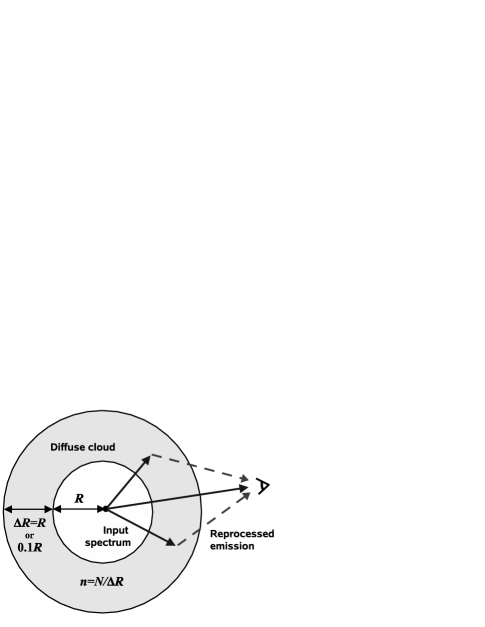
Because our models must reprocess a substantial fraction of the incident X-ray flux, we required that the intervening gas subtend a large solid angle around the central source. We thus modeled the reprocessing by spherical shells of gas centered on the neutron star. For a cloud of radial extent less than cm, column densities higher than cm-2 imply densities higher than cm-3, for which we cannot parameterize our models simply in terms of .
Instead, we constructed a series of models of gas in spherical shells with varying radius and column density (Fig. 6). Because the gas density in the system falls off with radius, the largest clouds of constant density should have thickness comparable to the scale length, or . We therefore ran models with and to explore the effects of higher density parcels.
| 9.0 | 24.0 | 15.0 | 4.7–5.4 | 7.6–7.6 | 7.6–7.6 | 7.6–7.6 | |||
| 10.0 | 24.0 | 14.0 | 3.7–4.4 | 6.9–7.5 | 7.0–7.5 | 6.9–7.5 | 0.014 | ||
| 11.0 | 23.5 | 12.5 | 3.2–3.9 | 4.6–7.2 | 0.045 | 4.6–7.2 | 0.099 | 6.4–7.2 | 0.018 |
| 11.0 | 24.0 | 13.0 | 2.7–3.4 | 4.7–6.5 | 0.14 | 4.5–5.6 | 0.022 | 6.2–6.6 | 0.14 |
| 11.5 | 23.5 | 12.0 | 2.7–3.4 | 4.6–6.4 | 0.087 | 4.3–5.1 | 0.040 | 5.2–6.6 | 0.099 |
| 12.0 | 23.0 | 11.0 | 2.7–3.4 | 5.4–6.5 | 4.8bbModel run with constant temperature throughout cloud. | 6.2–6.6 | 0.022 | ||
| 11.0 | 24.0 | 14.0 | 2.3–2.4 | 4.5–5.1 | 0.21 | 4.5–4.9 | 0.045 | 4.4–5.8 | 0.41 |
| 11.5 | 23.5 | 13.0 | 2.3–2.4 | 4.8bbModel run with constant temperature throughout cloud. | 0.14 | 4.7bbModel run with constant temperature throughout cloud. | 0.044 | 4.6bbModel run with constant temperature throughout cloud. | 0.26 |
| 12.0 | 23.0 | 13.0 | 2.3–2.4 | 4.8bbModel run with constant temperature throughout cloud. | 0.061 | 4.5bbModel run with constant temperature throughout cloud. | 0.051 | 4.6bbModel run with constant temperature throughout cloud. | 0.14 |
For the input spectrum we used an exponentially cutoff power law that matches the hard component of RX J0059.2–7138 as fitted by Kohno et al. (2000). The spectrum has luminosity ergs s-1, , keV, and keV. For gas composition we used a standard SMC value of (Welty, 2001), as well as and 1.
There are large turbulent velocities in the gas around the neutron star, so we modified the standard XSTAR code to include these effects in the line opacity. For each model we set the turbulent velocities equal to the Keplerian velocity,
for a neutron star mass of . This decreases the line opacities by a factor of where is the atomic mass.

We ran models with radii from cm (the expected radius of the inner disk) to cm (a few times the size of the binary system during outburst which is ). Most of the reprocessing column should be contained within this radius. Close to the neutron star, the accretion flow can create large gas densities and columns cm-2 or greater. At , the wind from the Be star is expected to blow away the surrounding interstellar medium so that the gas density is determined mainly by the star’s mass loss. For a spherical wind,
where is the molecular weight, 1.4. For M☉ yr-1 and km s-1, we have upper limits in our models of and cm-2, for and cm, respectively. We note that while large densities may be possible at smaller radii, we did not run models with cm-2 because the effects of Compton scattering are not explicitly included in XSTAR. We discuss Compton-thick reprocessing in the next section.
In most models, we allowed XSTAR to vary the temperature in each subshell to minimize heating minus cooling as it stepped outward through the cloud. However, for some runs at large radii ( cm), the model encountered problems converging on the temperature. In these cases we set the entire cloud to be at the single temperature that minimized heating minus cooling over the entire cloud.
6.2. XSTAR results

Outputs of sample model runs are given in Table 4. Because a simple power law fits the hard end of the spectrum well, there is likely to be little absorbing gas in the system directly along the line of sight, so the observed spectrum is the sum of the input hard power law plus the reprocessed emission from surrounding gas. Samples of these spectra are shown in Fig. 7.
We find that none of the models are able to reproduce the observed emission from RX J0059.2–7138. In models in which (that is, for small radii) there is virtually no reprocessing for any column density, because the gas temperature is very high ( K), all the atoms in the gas are completely ionized, and therefore, the opacity to photoionziation interactions is low. Reprocessing inside this radius requires densities much higher than those that are possible to model using XSTAR. This approaches dense, optically thick reprocessing, which is discussed in the next section.
For larger cm (and thus smaller ), the spectrum is markedly altered by the photoionized gas, as shown in Fig. 7. Some of the hard X-rays are absorbed through ionization and re-emitted as softer photons through recombination, bremsstrahlung, or line emission. For each model, we calculate , the ratio of the total luminosity emitted outward by the gas to the total input luminosity. For most models , and at most 50% of the reprocessed emission emerges in soft X-rays (0.1–2 keV). There are a few cases for the shells that have , but in these only 10%–20% of the emission emerges in soft X-rays, with most coming in the EUV. In addition, the spectral shape of the soft emission does not match observations. There is little bremsstrahlung continuum, and the radiative recombination and atomic lines produce spectra with discrete features and insufficient flux at 1 keV.
To show this quantitatively, we used the output XSTAR spectra to create table models in XSPEC and fitted these models to the observed spectrum of RX J0059.2–7138. We took data from the ASCA GIS2 observation of 1993 May (Kohno et al., 2000) from the HEASARC archive. We used the standard event-screening criteria and extracted the source and background spectra from regions similar to those shown in Fig. 1 of Kohno et al. (2000). We fitted the data in the range 0.7–7 keV.
For each XSTAR run, the model consisted of the input power law spectrum plus the outward emitted spectrum, modified by typical interstellar cm-2. We fitted these models to the data, allowing the relative luminosities of the input and emitted component to vary between 0.01 and 100 times that calculated by XSTAR (indicating more or less reprocessing gas than in our model shells). The models fitted, all having and most having . In general, the reprocessed spectra have discrete line features and too little flux at 1 keV. In addition, most spectra are underluminous; for the model with the best fit (, cm, cm-2, and ), the condition requires an outward luminosity 90 times that output by XSTAR.
To allow for reprocessing by gas at several different radii and densities, we also performed spectral fits with multiple models simultaneously. For each we included the emitted spectra from the six models with the most luminous emission in soft X-rays (0.1–2 keV) plus the input power law. We allowed the normalization of each emitted spectrum and the input power law to vary, and the results are shown in Fig. 8. Even when combining emission from several sets of gas parameters, there remains a decrement at low energies, which is not significantly affected by changing . As shown in § 4, this required soft flux could not simply be part of the emission from the neutron star because of the high temperatures required.
Of course, the photoionized gas in XBP systems is far more complex than we have modeled here, containing shocks, wakes, and other density gradients, and in the case of Be stars, a circumstellar disk. We have not considered small regions of very dense gas ( cm-3) at large radii, such as those present in simulations of SMC X-1 (Blondin & Woo, 1995) and suggested by the lines seen by Vrtilek et al. (2001). We note, however, that such dense regions subtend a small angle to the neutron star and so do not contribute significantly to the reprocessed flux. There also could be variations in the shape of the photoionizing spectrum seen by different parcels of gas, which would affect the photoionization emission in complex ways that would require a much more detailed study to model completely. Thus, it is in principle possible that a particular configuration might produce the soft spectrum seen in RX J0059.2–7138. However, our analysis suggests that in general photoionized emission is too weak and would have an incorrect spectral shape. In RX J0059.2–7138, as in the other luminous XBPs, the soft excess most likely has a different origin.
6.3. Higher optical depths
Because XSTAR does not include Comptonization, our models have not covered the case of Compton-thick ( cm-2) gas at radii close to the neutron star where high densities may be present. Ross (1979) models this regime with code that explicitly calculates the radiative transfer in Compton-thick gas. The models show that for cm, high densities ( cm-3), and ergs s-1, there is still some decrement from a blackbody shape at X-ray energies, even for high Thomson optical depths –5. In this regime there are strong emission features of oxygen and silicon at 0.8–1.2 keV, which are not seen in the soft excess of most XBPs but may correspond to the 1 keV emission lines found in Her X-1. This suggests that close into the neutron star, where we expect high gas densities, the gas must have high Thomson optical depths to produce the blackbody-shaped spectrum of the soft excess. We discuss this regime in the next section.
7. Reprocessing by optically thick material
Reprocessing might occur in gas that is completely optically thick, with . Such material is naturally expected to reside in the accretion disk, for example, and when illuminated with hard X-rays it re-radiates in a blackbody-like spectrum. If the surface area of this region is of the appropriate size, it can reproduce the observed temperatures and luminosities. The exact geometry of the accreting material is unknown, but for simplicity we use the phrase “reprocessing by the inner disk” to refer to all shapes (shells, warped surfaces, etc.) of optically thick gas at the disk’s inner edge.
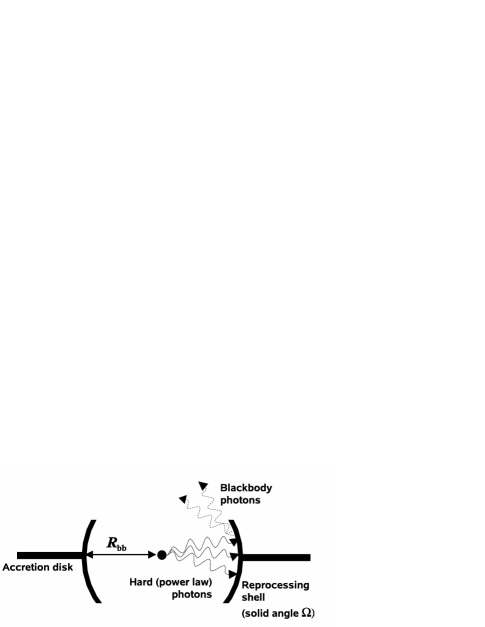
To begin we consider a thick partial spherical shell centered on the neutron star, subtending a solid angle at the X-ray source (see Fig. 9). Any photons that strike this gas are absorbed and reprocessed, so that for isotropic emission,
If the radius of this shell is , the reprocessing region has an area
For isotropic blackbody radiation,
Thus we have
This differs from some estimates for , which assume all the soft luminosity is radiated from a full sphere at . Our formula is more appropriate if the blackbody comes from reprocessing by a partially-covering, disk-like structure. For typical ergs s-1 and keV, we obtain cm. This value is close to the typical radius of the magnetosphere for the luminous XBPs, suggesting that the reprocessing gas may be at the inner edge of the accretion disk.
7.1. Her X-1 and Cen X-3
There is evidence for the above picture in Her X-1 and Cen X-3. In Her X-1, the 35-day periodicity is attributed to the blocking of the central neutron star by a precessing disk (e.g., Gerend & Boynton, 1976). Detailed geometric models for the disk have been used to explain phenomena such as X-ray dips (Shakura et al., 1999) and varying pulse profiles (Scott et al., 2000). The anomalous low states observed in 1983, 1993, and 1999 in which the source remained in the low state for several 35-day periods, have also convincingly been shown to be due to occultation by the disk (Coburn et al., 2000; Manchanda, 2003).
Observations suggest that this blocking disk reprocesses the hard X-rays to produce the soft excess. Endo et al. (2000) performed pulse-phase resolved spectroscopy on ASCA data taken during the main-on state (). As described in § 2, they found that the soft blackbody component and line emission features pulsed 230∘ out of phase from the narrow power-law pulses, an offset seen earlier by McCray et al. (1982). The authors proposed that the tilted inner accretion disk absorbs the hard X-rays as the pulsar points away from the line of sight, giving rise to the blackbody and lines, which are emitted back toward the observer out of phase with the hard pulses. For the spectral parameters found by Endo et al. (2000), cm. They showed that the cooling timescale of the irradiated gas is a small fraction of a second, so it is possible for the reprocessed soft X-rays to pulse along with the hard component.
Ramsay et al. (2002) analyzed observations with XMM taken at (close to main-on), 0.26 (low state), and 0.60 (short-on state). They examined how the phase shift between the soft excess and hard component varies with . They found that the profiles have phase offsets that vary from at to at and at . They argued that this continuous change in offset is expected from reprocessing by a tilted precessing disk.
For Her X-1, the range of observed values –0.16 keV and ergs s-1 gives – cm. An estimate of the magnetospheric radius (Frank et al., 2002) is
where is the standard radius. Here is the mass of the neutron star in , is its radius in cm, is the X-ray luminosity in ergs s-1, and is the neutron star surface magnetic field in G. For Her X-1 ( and ), cm. Scott et al. (2000) calculate using several other models (i.e. Finger et al., 1996; Kiraly & Meszaros, 1988; Aly, 1980) and find they all give – cm. Thus, is larger than by as much as a factor of 4 or more. We discuss possible explanations for this discrepancy in the next subsection.
In Cen X-3, the soft excess is less well studied but is again consistent with reprocessing by the disk. Burderi et al. (2000) found a bright soft excess in the BeppoSAX spectrum, with keV and containing 58% of the total unabsorbed flux. With ergs s-1, we have cm, while gives cm. As in Her X-1, the blackbody and iron line are likely produced by reprocessing at the magnetosphere. Kohmura et al. (2001) tested this picture by examining aperiodic oscillations of the X-ray flux and measuring the time delay of the iron lines with respect to the other bands. They found a systematic time delay of ms, which implies a light-travel distance of cm. This distance is comparable to and and so supports the interpretation of disk reprocessing.
7.2. SMC X-1 and LMC X-4
Although SMC X-1 and LMC X-4 are more luminous than Her X-1, they all show remarkable similarities including a sinusoidal soft pulse profile, and a long-term periodicity, which is also attributed to a blocking, precessing disk. These similarities indicate that optically thick reprocessing may be the source of the soft excess in these systems as well.
Given the temperatures and luminosities for SMC X-1 and LMC X-4 from Paul et al. (2002, see Table 1) we find and cm, respectively. For LMC X-4 , indicates cm. This gives , compared with – for Her X-1, depending on the value for , and 1.5 for Cen X-3. The values for and are shown for comparison in Table 5.
In SMC X-1, no cyclotron feature has been detected, so there is no magnetic field estimate. For SMC X-1 to have , as in Her X-1 and LMC X-4, would require . Such a high magnetic field would give a cyclotron line at 200 keV and so may be difficult to detect with current instruments. However, Makishima et al. (1999) suggest that the relatively low spectral cutoff energy (6 keV) in SMC X-1 may indicate a smaller magnetic field than Her X-1, so the question is still open. Another estimate for the inner edge of the accretion disk is the corotation radius
which is the radius at which the Keplerian angular velocity of the disk is equal to , the angular velocity of the neutron star. For SMC X-1, cm, which is equal to .
Paul et al. (2002) argue that because of discrepancies between and , disk reprocessing may not be at work in the luminous XBPs. However, Her X-1 and Cen X-3 show substantial evidence for reprocessing by the disk, yet have markedly different ratios between and . It is therefore difficult to base conclusions on the exact values obtained for and . This uncertainty exists for several reasons, some of which are treated in detail by Scott et al. (2000). First, there may be errors in our estimate of , largely because the standard models for the magnetospheric radius are incomplete. The interaction of the accretion disk with the magnetic field is poorly understood, but certainly a high rate of mass flow from the disk onto the magnetic field lines has some effect on the field (e.g., Agapitou & Papaloizou, 2000; Aly & Kuijpers, 1990). Whether this makes larger or smaller is uncertain. It may also be that the inner edge of the disk does not actually reside at the radius that we define as the magnetosphere, but that some gas exists inside this radius. Again, such a process is not fully understood and warrants more investigation.
| Her X-1 | Cen X-3 | LMC X-4 | Vela X-1 | |
|---|---|---|---|---|
| (1038 ergs s-1) | 0.2 | 1.0 | 1.2 | 0.01 |
| ( G) | 4 | 3.5 | 10 | 2.4 |
| (keV) | 0.16, 0.1 | 0.11 | 0.17 | 0.2 |
| (108 cm) | 0.49, 1.2 | 2.3 | 1.1 | 0.07 |
| (108 cm) | 2.9 | 1.5 | 2.9 | 4.5 |
| 0.2, 0.4 | 1.5 | 0.4 | 0.01 |
Even if the standard formulae are accurate and the accretion disk really is truncated at , there are uncertainties in the parameters that are used to calculate . is taken from measurements of a cyclotron feature that may arise not in the main dipole field but in a region of stronger or weaker field near the accretion flow. Since , a 25% error in the field strength would cause a 15% error in . There is also uncertainty in due to errors in the distance to the source, uncertainty in the spectral parameters, and variation of the source with time. Since , a 25% error in would cause a 7% error in . There are also uncertainties in the masses and radii of neutron stars. Masses of solitary pulsars seem to be tightly peaked around 1.4 (Thorsett & Chakrabarty, 1999), but for accreting pulsars the masses may be greater. For example, from radial velocities of the companion to Vela X-1, Quaintrell et al. (2003) obtain . Since , such a mass variation would correspond to an increase in of 10%. Estimates of vary from 0.7 to 1.6 cm, which can vary by another 20%. The overall effect of these uncertainties is to create substantial uncertainty in which may be as high as 30% or greater.
There may also be errors in our estimate of . The spectrum of the reprocessing material is almost certainly not a single-temperature blackbody. A hot disk coronona could Compton-scatter some of the blackbody photons, giving an observed higher than the true blackbody temperature and causing an underestimate of . On the other hand, the reprocessing surface may be tilted with respect to the hard X-ray flux, which would increase the emitting area at a given radius and thus decrease . Viewing angle effects due to non-isotropic emission could also be important.
Given these uncertainties, the correspondence between and to a factor of 2 or so suggests that reprocessing by the inner disk can explain the spectra of LMC X-4 and SMC X-1. Such a model arises naturally from the geometry of these sources, and, unlike the other processes we have considered, it reproduces the pulsations and high luminosities of the soft component.
7.3. RX J0059.2–7138 and XTE J0111.2–7317
Transient Be/XBP systems are expected to form accretion disks (Hayasaki & Okazaki, 2004), so inner disk reprocessing might occur. In RX J0059.2–7138 and XTE J0111.2–7317, there is no magnetic field measurement, so estimates of are difficult. A typical value of for XBPs () gives cm for XTE J0111.2–7317. This is of order the cm obtained from the ASCA spectrum by Yokogawa et al. (2000). RX J0059.2–7138 has a similar luminosity and spectrum, and so may also have disk reprocessing. As in SMC X-1 and LMC X-4, this is the only mechanism that can produce the spectral shape and high in these systems.
A puzzle is the lack of pulsations in the soft component of RX J0059.2–7138. One explanation is that, unlike Her X-1, SMC X-1, and LMC X-4, the disk may be at low inclination. In this case, the whole reprocessing region would present roughly the same angle to the observer, so we would see a brightly emitting disk at all phases in the pulsation. Another possibility is that electron scattering from a large disk wind or corona, of size cm, could wash out the pulsations in the soft component.
7.4. Vela X-1 and 4U 1626–67
In Vela X-1, reprocessing by the disk is not the main source of the soft excess. Given ergs s-1 and , we obtain cm. Although a blackbody fit has not been performed to the Vela X-1 soft component, we note that Paul et al. (2002) were able to fit both blackbody and bremsstrahlung models to SMC X-1 and LMC X-4 spectra, giving and 0.18 keV, and and 0.5 keV, respectively. For Vela X-1, keV, so we assume an equivalent keV. This gives cm, or , which is extremely small. In other words, Vela X-1 is not luminous enough to produce a reprocessed blackbody soft component at keV and over an area . On the other hand, because of the relatively low luminosity, the soft component is well explained by emission from diffuse gas excited by collisions and photoionization, as discussed in §§ 5–6, respectively.
The situation in 4U 1626–67 is difficult to evaluate because the distance to the source, and thus , is poorly constrained. The different possibilities for a Roche lobe-filling companion to 4U 1626–67 imply different distances: 1 kpc for a 0.02 white dwarf, 3 kpc for a 0.08 partially degenerate, hydrogen-depleted star, and 36 kpc for a 0.6 helium burning star (Chakrabarty, 1998). Chakrabarty (1998) found that optical photometry is consistent with emission coming mostly from an X-ray heated disk, which implies a distance in the range of 5 kpc kpc.
Orlandini et al. (1998a) find that for a blackbody soft excess, the radius of the emitting region is km. For kpc and thus ergs s-1, this region is the size of the neutron star, so soft excess may be thermal emission from the star’s surface. To evaluate the possibility of reprocessing by the disk, we take , keV, and and find that is of order cm only at kpc. This is an unphysically large distance. We conclude that disk reprocessing is not at work in this system.
7.5. Pulsations from disk reprocessing
To conclude this section, we show that soft pulses can arise from disk reprocessing in the luminous XBPs. Following the calculation of Endo et al. (2000), the total thermal energy of the soft emitting region is simply the volume of the region times its thermal energy density
where is the penetration depth of hard X-rays into the heated region. We assume that most X-rays penetrate no more than a few Compton depths, so that cm-2. For typical , , and K, we have erg. The cooling timescale is simply , which for ergs s-1 gives s. As in Her X-1, this is much shorter than the pulsation period, so soft pulses should be possible for this reprocessing mechanism.
8. Discussion
We have found that only a few of the models that have been proposed can successfully account for the observed soft excess in XBPs. In addition, the origin of the soft excess depends strongly on the luminosity of the source. For systems with high ergs s-1 (SMC X-1, LMC X-4, RX J0059.2–7138, XTE J0111.2–7317, and Cen X-3), the soft excess can be explained only by reprocessing of the hard X-rays by optically thick accreting material. However, for systems with ergs s-1, the soft excess is emitted by diffuse gas through collisional heating or photoionization (Vela X-1, RX J0101.3–7211, and AX J0103–722), or is possibly thermal emission from the neutron star’s surface (4U 1626–67, X Per).
The more luminous XBPs probably also emit soft X-rays from a diffuse cloud and from the surface of the neutron star, but these components are dominated by the flux from the power law and from disk reprocessing. On the other hand, in lower systems we do not expect disk reprocessing to be important, since for blackbody emission at , we have . Since , this gives . Thus for lower the temperature of the disk moves toward the EUV and out of the soft X-ray band.
For XBPs with moderate ergs s-1, it appears possible to have disk reprocessing (Her X-1), emission by diffuse gas (EXO 053109–6609.2), or possibly both (A 0538–66). We thus have something of a continuum, in which the soft excess from more luminous XBPs comes primarily from disk reprocessing, while in less luminous ones it originates in optically thin emission or thermal emission from the neutron star’s surface.
In addition to these general conclusions, this work raises a number of puzzling questions. One is the apparently high brightness temperature of the power-law component in SMC X-1 (§ 4.1). This may suggest that the accretion column is hotter or larger in extent than models predict. For Vela X-1, the question remains whether the soft excess emission is powered mainly by photoionization or collisional energy sources (§§ 5–6). In RX J0059.2–7138, where disk reprocessing is likely at work, the complete absence of soft pulsations (§ 7.3) is also worth further investigation.
It is important to examine the lack of exact correlation between and in the sources where we believe reprocessing by the accretion disk is at work. We have discussed a number of uncertainties in these calculations in § 7.2, but this problem warrants further study. For example, a thorough investigation of non-blackbody effects in the disk reprocessing can help reduce uncertainty in . Radiative transfer in an obliquely illuminated model disk has been treated by Psaltis (2002), and the structure and line emission of an illuminated disk atmosphere has been modeled in detail (Jimenez-Garate et al., 2001, 2002). Using such models to analyze the soft emission from XBPs can help diagnose the gas conditions near the disk’s inner edge.
There remains the question of how the accreting material, which is expected to be in a geometrically thin disk, is able to subtend a substantial solid angle to the central neutron star. Interactions with the magnetic field are likely to be key in this process. For example, Spruit & Taam (1990) have shown analytically that accreting matter can be tied to the magnetic field in equilibrium positions off the midplane of the disk, near its inner edge. Numerical, three-dimensional magnetohydrodynamic simulations of accretion onto rotating magnetized stars (Romanova et al., 2003, 2002) show structures including funnel flows and dense “rings” that develop near . These may be the sites of the X-ray reprocessing, and the soft excess emission may provide constraints on the properties of such structures.
We can also use the soft excess to study warping and precession of the disk, particularly in Her X-1, SMC X-1, and LMC X-4. A warping instability in a centrally-illuminated disk was found theoretically by Pringle (1996) and has been explored in a number of studies (e.g., Wijers & Pringle, 1999; Lai, 1999; Maloney & Begelman, 1997) that also predict the disk’s precession. As Ramsay et al. (2002) have done in the case of Her X-1, it would be interesting to examine SMC X-1 and LMC X-4 and see how the reprocessing region on the disk moves as the disk precesses.
9. Summary
In this paper we have reviewed a number of observations of the soft excess in X-ray pulsarsand explored the origin of this feature. We find the following:
-
1.
The soft excess is a very common, if not ubiquitous feature of emission from XBPs. Observations of XBPs that have not shown a soft excess are most often limited by low flux, high absorbing column, or insufficient soft sensitivity.
-
2.
For luminous ( ergs s-1) sources, the soft components have high luminosities and soft spectral shapes that can only be explained by reprocessing of hard X-rays from the neutron star by optically thick, accreting material, most likely near the inner edge of the accretion disk.
-
3.
For less luminous ( ergs s-1) sources, the soft excess is due to other processes, such as emission by photoionized or collisionally heated diffuse gas, or thermal emission from the surface of the neutron star. In these sources the soft component cannot come from reprocessing by the accretion disk.
-
4.
XBPs of intermediate luminosity ( ergs s-1) show either or both of these types of emission.
-
5.
Future observations of soft excess will allow us to explore aspects of XBPs such as the properties of circumstellar gas, interaction of accreting matter and the magnetic field, and warping and precession of the accretion disk.
References
- Agapitou & Papaloizou (2000) Agapitou, V. & Papaloizou, J. C. B. 2000, MNRAS, 317, 273
- Aly (1980) Aly, J. J. 1980, A&A, 86, 192
- Aly & Kuijpers (1990) Aly, J. J. & Kuijpers, J. 1990, A&A, 227, 473
- Angelini et al. (1995) Angelini, L., White, N. E., Nagase, F., Kallman, T. R., Yoshida, A., Takeshima, T., Becker, C., & Paerels, F. 1995, ApJ, 449, L41+
- Arnaud (1996) Arnaud, K. A. 1996, in ASP Conf. Ser. 101: Astronomical Data Analysis Software and Systems V, 17–+
- Becker (1998) Becker, P. A. 1998, ApJ, 498, 790
- Bildsten et al. (1997) Bildsten, L., Chakrabarty, D., Chiu, J., Finger, M. H., Koh, D. T., Nelson, R. W., Prince, T. A., Rubin, B. C., Scott, D. M., Stollberg, M., Vaughan, B. A., Wilson, C. A., & Wilson, R. B. 1997, ApJS, 113, 367
- Blondin & Woo (1995) Blondin, J. M. & Woo, J. W. 1995, ApJ, 445, 889
- Boroson et al. (2001) Boroson, B., Kallman, T., Blondin, J. M., & Owen, M. P. 2001, ApJ, 550, 919
- Boroson et al. (2003) Boroson, B., Vrtilek, S. D., Kallman, T., & Corcoran, M. 2003, ApJ, 592, 516
- Burderi et al. (2000) Burderi, L., Di Salvo, T., Robba, N. R., La Barbera, A., & Guainazzi, M. 2000, ApJ, 530, 429
- Burnard et al. (1991) Burnard, D. J., Arons, J., & Klein, R. I. 1991, ApJ, 367, 575
- Chakrabarty (1998) Chakrabarty, D. 1998, ApJ, 492, 342
- Chakrabarty et al. (1998) Chakrabarty, D., Levine, A. M., Clark, G. W., & Takeshima, T. 1998, in International Astronomical Union Circular, 1–+
- Choi et al. (1996) Choi, C. S., Dotani, T., Day, C. S. R., & Nagase, F. 1996, ApJ, 471, 447
- Clarkson et al. (2003) Clarkson, W. I., Charles, P. A., Coe, M. J., Laycock, S., Tout, M. D., & Wilson, C. A. 2003, MNRAS, 339, 447
- Coburn et al. (2001) Coburn, W., Heindl, W. A., Gruber, D. E., Rothschild, R. E., Staubert, R., Wilms, J., & Kreykenbohm, I. 2001, ApJ, 552, 738
- Coburn et al. (2002) Coburn, W., Heindl, W. A., Rothschild, R. E., Gruber, D. E., Kreykenbohm, I., Wilms, J., Kretschmar, P., & Staubert, R. 2002, ApJ, 580, 394
- Coburn et al. (2000) Coburn, W., Heindl, W. A., Wilms, J., Gruber, D. E., Staubert, R., Rothschild, R. E., Postnov, K. A., Shakura, N., Risse, P., Kreykenbohm, I., & Pelling, M. R. 2000, ApJ, 543, 351
- Coe et al. (2000) Coe, M. J., Haigh, N. J., & Reig, P. 2000, MNRAS, 314, 290
- Coe et al. (2003) Coe, M. J., Haigh, N. J., Wilson, C. A., & Negueruela, I. 2003, MNRAS, 344, 1075
- dal Fiume et al. (1998) dal Fiume, D., Orlandini, M., Cusumano, G., del Sordo, S., Feroci, M., Frontera, F., Oosterbroek, T., Palazzi, E., Parmar, A. N., Santangelo, A., & Segreto, A. 1998, A&A, 329, L41
- di Salvo et al. (1998) di Salvo, T., Burderi, L., Robba, N. R., & Guainazzi, M. 1998, ApJ, 509, 897
- Endo et al. (2002) Endo, T., Ishida, M., Masai, K., Kunieda, H., Inoue, H., & Nagase, F. 2002, ApJ, 574, 879
- Endo et al. (2000) Endo, T., Nagase, F., & Mihara, T. 2000, PASJ, 52, 223
- Finger et al. (1996) Finger, M. H., Wilson, R. B., & Harmon, B. A. 1996, ApJ, 459, 288
- Forman et al. (1973) Forman, W., Jones, C., Tananbaum, H., Gursky, H., Kellogg, E., & Giacconi, R. 1973, ApJ, 182, L103+
- Frank et al. (2002) Frank, J., King, A., & Raine, D. J. 2002, Accretion Power in Astrophysics: Third Edition (Cambridge University Press, 2002, 398 pp.)
- Fransson & Fabian (1980) Fransson, C. & Fabian, A. C. 1980, A&A, 87, 102
- Gerend & Boynton (1976) Gerend, D. & Boynton, P. E. 1976, ApJ, 209, 562
- Giacconi et al. (1972) Giacconi, R., Murray, S., Gursky, H., Kellogg, E., Schreier, E., & Tananbaum, H. 1972, ApJ, 178, 281
- Grindlay et al. (1984) Grindlay, J. E., Petro, L. D., & McClintock, J. E. 1984, ApJ, 276, 621
- Gruber & Rothschild (1984) Gruber, D. E. & Rothschild, R. E. 1984, ApJ, 283, 546
- Haberl (1994) Haberl, F. 1994, A&A, 288, 791
- Haberl et al. (1994) Haberl, F., Aoki, T., & Mavromatakis, F. 1994, A&A, 288, 796
- Haberl et al. (2003) Haberl, F., Dennerl, K., & Pietsch, W. 2003, A&A, 406, 471
- Hayasaki & Okazaki (2004) Hayasaki, K. & Okazaki, A. T. 2004, MNRAS, 350, 971
- Hughes (1994) Hughes, J. P. 1994, ApJ, 427, L25
- Jimenez-Garate et al. (2002) Jimenez-Garate, M. A., Raymond, J. C., & Liedahl, D. A. 2002, ApJ, 581, 1297
- Jimenez-Garate et al. (2001) Jimenez-Garate, M. A., Raymond, J. C., Liedahl, D. A., & Hailey, C. J. 2001, ApJ, 558, 448
- Jones & Forman (1976) Jones, C. & Forman, W. 1976, ApJ, 209, L131
- Kallman & Bautista (2001) Kallman, T. & Bautista, M. 2001, ApJS, 133, 221
- Kelley et al. (1983) Kelley, R. L., Jernigan, J. G., Levine, A., Petro, L. D., & Rappaport, S. 1983, ApJ, 264, 568
- Kiraly & Meszaros (1988) Kiraly, P. & Meszaros, P. 1988, ApJ, 333, 719
- Kohmura et al. (2001) Kohmura, T., Kitamoto, S., & Torii, K. 2001, ApJ, 562, 943
- Kohno et al. (2000) Kohno, M., Yokogawa, J., & Koyama, K. 2000, PASJ, 52, 299
- Kotani et al. (1999) Kotani, T., Dotani, T., Nagase, F., Greenhill, J. G., Pravdo, S. H., & Angelini, L. 1999, ApJ, 510, 369
- Kretschmar et al. (1996) Kretschmar, P., Pan, H. C., Kendziorra, E., Kunz, M., Maisack, M., Staubert, R., Pietsch, W., Truemper, J., Efremov, V., & Sunyaev, R. 1996, A&AS, 120, C175+
- Kreykenbohm et al. (2002) Kreykenbohm, I., Coburn, W., Wilms, J., Kretschmar, P., Staubert, R., Heindl, W. A., & Rothschild, R. E. 2002, A&A, 395, 129
- Krzeminski (1974) Krzeminski, W. 1974, ApJ, 192, L135
- La Barbera et al. (2001) La Barbera, A., Burderi, L., Di Salvo, T., Iaria, R., & Robba, N. R. 2001, ApJ, 553, 375
- Lai (1999) Lai, D. 1999, ApJ, 524, 1030
- Lang et al. (1981) Lang, F. L., Levine, A. M., Bautz, M., Hauskins, S., Howe, S., Primini, F. A., Lewin, W. H. G., Baity, W. A., Knight, F. K., Rotschild, R. E., & Petterson, J. A. 1981, ApJ, 246, L21
- Leong et al. (1971) Leong, C., Kellogg, E., Gursky, H., Tananbaum, H., & Giacconi, R. 1971, ApJ, 170, L67+
- Levine et al. (1991) Levine, A., Rappaport, S., Putney, A., Corbet, R., & Nagase, F. 1991, ApJ, 381, 101
- Li et al. (1978) Li, F., Rappaport, S., & Epstein, A. 1978, Nature, 271, 37
- Liller (1973) Liller, W. 1973, ApJ, 184, L37+
- Lucke et al. (1976) Lucke, R., Yentis, D., Friedman, H., Fritz, G., & Shulman, S. 1976, ApJ, 206, L25
- Mahadevan et al. (1996) Mahadevan, R., Narayan, R., & Yi, I. 1996, ApJ, 465, 327
- Makishima et al. (1999) Makishima, K., Mihara, T., Nagase, F., & Tanaka, Y. 1999, ApJ, 525, 978
- Maloney & Begelman (1997) Maloney, P. R. & Begelman, M. C. 1997, ApJ, 491, L43+
- Manchanda (2003) Manchanda, R. K. 2003, A&A, 401, 1111
- Mavromatakis & Haberl (1993) Mavromatakis, F. & Haberl, F. 1993, A&A, 274, 304
- McClintock et al. (1977) McClintock, J. E., Bradt, H. V., Doxsey, R. E., Jernigan, J. G., Canizares, C. R., & Hiltner, W. A. 1977, Nature, 270, 320
- McClintock et al. (1976) McClintock, J. E., Rappaport, S., Joss, P. C., Bradt, H., Buff, J., Clark, G. W., Hearn, D., Lewin, W. H. G., Matilsky, T., Mayer, W., & Primini, F. 1976, ApJ, 206, L99
- McCray et al. (1982) McCray, R. A., Shull, J. M., Boynton, P. E., Deeter, J. E., Holt, S. S., & White, N. E. 1982, ApJ, 262, 301
- Mereghetti et al. (1987) Mereghetti, S., Bignami, G. F., Caraveo, P. A., & Goldwurm, A. 1987, ApJ, 312, 755
- Mewe et al. (1986) Mewe, R., Lemen, J. R., & van den Oord, G. H. J. 1986, A&AS, 65, 511
- Middleditch et al. (1981) Middleditch, J., Mason, K. O., Nelson, J. E., & White, N. E. 1981, ApJ, 244, 1001
- Middleditch & Nelson (1976) Middleditch, J. & Nelson, J. 1976, ApJ, 208, 567
- Nagase (1989) Nagase, F. 1989, PASJ, 41, 1
- Nagase (2002) —. 2002, Journal of Astrophysics and Astronomy, 23, 59
- Nagase et al. (1992) Nagase, F., Corbet, R. H. D., Day, C. S. R., Inoue, H., Takeshima, T., Yoshida, K., & Mihara, T. 1992, ApJ, 396, 147
- Naik & Paul (2002) Naik, S. & Paul, B. 2002, Journal of Astrophysics and Astronomy, 23, 27
- Naik & Paul (2004) —. 2004, ApJ, 600, 351
- Nishiuchi et al. (1999) Nishiuchi, M., Koyama, K., Maeda, Y., Asai, K., Dotani, T., Inoue, H., Mitsuda, K., Nagase, F., Ueda, Y., & Kouveliotou, C. 1999, ApJ, 517, 436
- Orlandini et al. (1999) Orlandini, M., dal Fiume, D., del Sordo, S., Frontera, F., Parmar, A. N., Santangelo, A., & Segreto, A. 1999, A&A, 349, L9
- Orlandini et al. (1998a) Orlandini, M., dal Fiume, D., Frontera, F., Cusumano, G., del Sordo, S., Giarrusso, S., Piraino, S., Segreto, A., Guainazzi, M., & Piro, L. 1998a, A&A, 332, 121
- Orlandini et al. (1998b) Orlandini, M., Fiume, D. D., Frontera, F., del Sordo, S., Piraino, S., Santangelo, A., Segreto, A., Oosterbroek, T., & Parmar, A. N. 1998b, ApJ, 500, L163+
- Owens et al. (1997) Owens, A., Oosterbroek, T., & Parmar, A. N. 1997, A&A, 324, L9
- Paul et al. (2002) Paul, B., Nagase, F., Endo, T., Dotani, T., Yokogawa, J., & Nishiuchi, M. 2002, ApJ, 579, 411
- Petre & Gehrels (1994) Petre, R. & Gehrels, N. 1994, A&A, 282, L33
- Pfeffermann & Briel (1986) Pfeffermann, E. & Briel, U. G. 1986, in X-ray instrumentation in astronomy; Proceedings of the Meeting, Cannes, France, December 2-4, 1985 (A87-19722 07-35). Bellingham, WA, Society of Photo-Optical Instrumentation Engineers, 1986, p. 208-212., 208–212
- Pringle (1996) Pringle, J. E. 1996, MNRAS, 281, 357
- Psaltis (2002) Psaltis, D. 2002, ApJ, 574, 306
- Quaintrell et al. (2003) Quaintrell, H., Norton, A. J., Ash, T. D. C., Roche, P., Willems, B., Bedding, T. R., Baldry, I. K., & Fender, R. P. 2003, A&A, 401, 313
- Ramsay et al. (2002) Ramsay, G., Zane, S., Jimenez-Garate, M. A., den Herder, J., & Hailey, C. J. 2002, MNRAS, 337, 1185
- Rappaport et al. (1977) Rappaport, S., Markert, T., Li, F. K., Clark, G. W., Jernigan, J. G., & McClintock, J. E. 1977, ApJ, 217, L29
- Roberts et al. (2001) Roberts, M. S. E., Michelson, P. F., Leahy, D. A., Hall, T. A., Finley, J. P., Cominsky, L. R., & Srinivasan, R. 2001, ApJ, 555, 967
- Romanova et al. (2002) Romanova, M. M., Ustyugova, G. V., Koldoba, A. V., & Lovelace, R. V. E. 2002, ApJ, 578, 420
- Romanova et al. (2003) Romanova, M. M., Ustyugova, G. V., Koldoba, A. V., Wick, J. V., & Lovelace, R. V. E. 2003, ApJ, 595, 1009
- Ross (1979) Ross, R. R. 1979, ApJ, 233, 334
- Sadakane et al. (1985) Sadakane, K., Hirata, R., Jugaku, J., Kondo, Y., Matsuoka, M., Tanaka, Y., & Hammerschlag-Hensberge, G. 1985, ApJ, 288, 284
- Sako et al. (1999) Sako, M., Liedahl, D. A., Kahn, S. M., & Paerels, F. 1999, ApJ, 525, 921
- Sanduleak & Philip (1977) Sanduleak, N., & Philip, A. G. D. 2004, IAU Circ. 3023
- Santangelo et al. (1998) Santangelo, A., del Sordo, S., Segreto, A., dal Fiume, D., Orlandini, M., & Piraino, S. 1998, A&A, 340, L55
- Sasaki et al. (2003) Sasaki, M., Pietsch, W., & Haberl, F. 2003, A&A, 403, 901
- Schreier et al. (1972a) Schreier, E., Giacconi, R., Gursky, H., Kellogg, E., & Tananbaum, H. 1972a, ApJ, 178, L71+
- Schreier et al. (1972b) Schreier, E., Levinson, R., Gursky, H., Kellogg, E., Tananbaum, H., & Giacconi, R. 1972b, ApJ, 172, L79+
- Schulz et al. (2002) Schulz, N. S., Canizares, C. R., Lee, J. C., & Sako, M. 2002, ApJ, 564, L21
- Schulz et al. (2001) Schulz, N. S., Chakrabarty, D., Marshall, H. L., Canizares, C. R., Lee, J. C., & Houck, J. 2001, ApJ, 563, 941
- Scott & Leahy (1999) Scott, D. M. & Leahy, D. A. 1999, ApJ, 510, 974
- Scott et al. (2000) Scott, D. M., Leahy, D. A., & Wilson, R. B. 2000, ApJ, 539, 392
- Shakura et al. (1999) Shakura, N. I., Prokhorov, M. E., Postnov, K. A., & Ketsaris, N. A. 1999, A&A, 348, 917
- Shapiro & Teukolsky (1983) Shapiro, S. L. & Teukolsky, S. A. 1983, Black holes, white dwarfs, and neutron stars: The physics of compact objects (Research supported by the National Science Foundation. New York, Wiley-Interscience, 1983, 663 p.)
- Spruit & Taam (1990) Spruit, H. C. & Taam, R. E. 1990, A&A, 229, 475
- Tananbaum et al. (1972) Tananbaum, H., Gursky, H., Kellogg, E. M., Levinson, R., Schreier, E., & Giacconi, R. 1972, ApJ, 174, L143+
- Tarter et al. (1969) Tarter, C. B., Tucker, W. H., & Salpeter, E. E. 1969, ApJ, 156, 943
- Thorsett & Chakrabarty (1999) Thorsett, S. E. & Chakrabarty, D. 1999, ApJ, 512, 288
- Vrtilek et al. (2001) Vrtilek, S. D., Raymond, J. C., Boroson, B., Kallman, T., Quaintrell, H., & McCray, R. 2001, ApJ, 563, L139
- Webster et al. (1972) Webster, B. L., Martin, W. L., Feast, M. W., & Andrews, P. J. 1972, Nature Physical Science, 240, 183
- Welty (2001) Welty, D. E. 2001, ArXiv Astrophysics e-prints
- White (1978) White, N. E. 1978, Nature, 271, 38
- Wijers & Pringle (1999) Wijers, R. A. M. J. & Pringle, J. E. 1999, MNRAS, 308, 207
- Wilson & Finger (1998) Wilson, C. A. & Finger, M. H. 1998, in International Astronomical Union Circular, 2–+
- Wojdowski et al. (1998) Wojdowski, P., Clark, G. W., Levine, A. M., Woo, J. W., & Zhang, S. N. 1998, ApJ, 502, 253
- Wojdowski et al. (2000) Wojdowski, P. S., Clark, G. W., & Kallman, T. R. 2000, ApJ, 541, 963
- Woo et al. (1995) Woo, J. W., Clark, G. W., Blondin, J. M., Kallman, T. R., & Nagase, F. 1995, ApJ, 445, 896
- Woo et al. (1996) Woo, J. W., Clark, G. W., Levine, A. M., Corbet, R. H. D., & Nagase, F. 1996, ApJ, 467, 811
- Yokogawa et al. (2003) Yokogawa, J., Imanishi, K., Tsujimoto, M., Koyama, K., & Nishiuchi, M. 2003, PASJ, 55, 161
- Yokogawa et al. (2000) Yokogawa, J., Paul, B., Ozaki, M., Nagase, F., Chakrabarty, D., & Takeshima, T. 2000, ApJ, 539, 191