Abstract
We present preliminary results from high resolution () adaptive optics observations of Cygnus A. The images show a bi-conic structure strongly suggestive of an obscuring torus around a quasar nucleus. A bright () point source is found near the expected position of the nucleus. We interpret this source as the hot inner rim of the torus seen through the opening of the torus. Using high angular resolution -band spectroscopy, we measure the ratio of molecular to recombination hydrogen lines as a function of distance to the center of the putative torus. These measurements place constraints on the properties of the torus and indicate a projected diameter of pc.
keywords:
Active galaxies, infrared galaxies, adaptive optics[Dust Tori in AGN] Penetrating Dust Tori in AGN
1 Introduction
The interplay between dust and radio emission has been the subject of vigorous research in recent years. We now know that radio loud sources have a high incidence of dust in their central regions (e.g., de Koff et al. 2000) and that there are several correlations between the properties of the dust and those of the radio source. However, this same dust has hampered the study of the nuclear regions of radio galaxies, particularly since most of the high resolution imaging studies of the hosts have been carried out at optical wavelengths.
We are conducting a Keck and Lick adaptive optics (AO) imaging and spectroscopic survey of nearby radio galaxies and other AGN in the near infrared that will allow us to pierce the dust in these objects and study the nuclear regions. One of the goals of this survey is to study the obscuring dust tori (if present) in these objects. Here we present preliminary results for one of the objects in our sample, the prototype radio galaxy Cyg A. For details on the observations, see Canalizo et al. (2003, hereafter Paper I; 2004, in preparation).
2 The Torus in Cygnus A
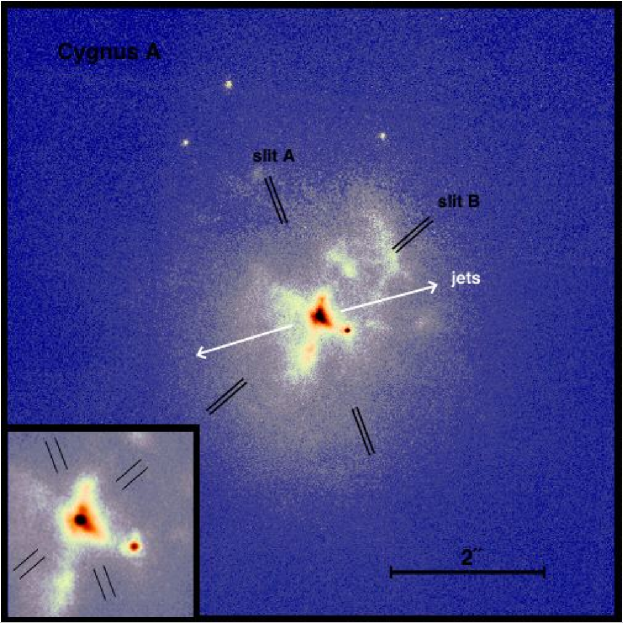
Because of its proximity () and extreme characteristics, Cyg A has played a fundamental role in the study of virtually every aspect of powerful radio galaxies. Different lines of evidence indicate that Cyg A harbors a heavily extincted quasar (e.g., Ogle et al. 1997). According to unification schemes, this quasar would be hidden by an optically and geometrically thick dust torus. Figure 1 shows a Keck NIRC2 AO image of the central region of Cyg A with a resolution of (or 50 pc for km s-1 Mpc-1). The two edge-brightened cones clearly seen in this image are strongly suggestive of a dust torus casting a shadow onto the surrounding gas. There are two unresolved sources in the central region: the ”primary”, near (but slightly off-center from) the vertex of the cones, and the ”secondary”, which appears to be the tidally stripped core of a lower mass merging galaxy (Paper I).
NICMOS observations of the primary point source show that it is highly polarized () with a polarization angle roughly perpendicular to the jets (Tadhunter et al. 2000; 1999). Overlaying these data with FOC polarization data indicates that the primary is within 0.1” of the scattering center (M. Kishimoto, personal communication). While it is tempting to associate this point source with the quasar nucleus, its flux is considerably higher than that predicted by X-ray observations. Ward et al. (1991) predict a continuum flux density at 2.2 m of erg cm-2 s-1 Å-1. Assuming a normal dust-to-gas ratio, Ueno et al. (1994) estimate from the X-ray absorption column. Combining both results, we expect a quasar continuum emission of erg cm-2 s-1 Å-1 at 2.2 m. However, we measure a 2.2 m flux of erg cm-2 s-1 Å-1. From our NIRC2 -band spectrum (see below; Fig. 2) we estimate that 36% of the total flux comes from emission lines, so the observed continuum flux density is erg cm-2 s-1 Å-1, two orders of magnitude greater than expected. It is certainly possible that the extinction may be overestimated if the mean dust grain size is larger than assumed (e.g. Maiolino et al. 2001). However, the -band spectrum of this point source (Fig. 2) does not show obvious broad lines, indicating that the broad line region is indeed at least partially hidden at these wavelengths.

A more likely interpretation for the point source is that it is the hot inner rim of the dust torus seen through the upper opening of the torus. The quasar itself is hidden behind the SE half of the torus, which is closer to us than its NW counterpart (recall that the NW jet points toward us and the SE jet away from us; see e.g., Carilli & Barthel 1996). Using observations of the 9.7 m silicate dust absorption feature toward the nucleus, Imanishi & Ueno (2000) estimate an inner radius for the torus of less than 10 pc. Since the resolution of our images is 50 pc, a torus opening of this order would certainly appear unresolved.
We obtained -band Keck AO spectroscopy at the two slit positions indicated in Fig. 1. Slit A corresponds to the NIRC2 spectrum shown in Fig. 2, with total integration of 3600 s. The slit was placed roughly perpendicular to the jets, presumably along the torus. The plate scale in the cross-dispersion direction is 0.04” pixel-1 (or 40 pc for Cyg A). Slit B corresponds to a NIRSPEC spectrum with a total integration time of 2400 s. This slit was placed as close to the axis of the jets as possible, given the constraints imposed by the AO system (Paper I). The data were binned in the cross dispersion direction to match the spatial resolution of the NIRC2 data.
Figure 3 shows, for each slit position, a plot of the flux ratio of the H2 S(1) line to Pa, as a function of the distance from the primary point source. For Slit A (left panel), the ratio is clearly lower in the region centered around the point source. The change in the ratio is unlikely to be due to extinction, since the ratio of Br to Pa remains constant over this region. A plausible explanation for this trend is that the molecular hydrogen is shielded from the continuum source on either side of the torus, leading to a higher HPa ratio. Since the torus is inclined some 30 to 60 degrees with respect to the line of sight, the emission we observe in this region actually comes from the region above the torus. Here the molecular hydrogen is no longer shielded and is thus photodissociated, so that the only emission we observe comes from the foreground; hence its ratio to Pa drops. From this plot, it may be inferred that the diameter of the torus is between 500 and 600 pc.


In the case of Slit B (Fig. 3, right panel), we are measuring HPa in the direction of the ionization cones, so that H2 is mostly photodissociated within the cones. However, in the region SE of the opening of the torus (at distance ), the ratio increases since this region is shielded by the SE half of the torus. The ratio decreases again at roughly pc, presumably beyond the shadow of the torus. The projected size of the torus would then be roughly pc. To obtain an actual diameter of the torus from this value we must take into consideration the scale height as well as the inclination angle, and the angle between the slit and the axis of the jets.
Thus, we infer a projected diameter of 600 pc for the torus in Cyg A. This value is consistent with values inferred using other methods, e.g., pc from resolution optical images (Vestergaard & Barthel 1993) and ”a few hundred parsecs” from infrared observations of the 9.7 m silicate dust absorption feature (Imanishi & Ueno 2000). Detailed modeling should allow us to obtain better estimates for the size and inclination of the torus.
Acknowledgements.
This work was supported in part under the auspices of the U.S. Department of Energy, National Nuclear Security Administration by the University of California, Lawrence Livermore National Laboratory under contract No. W-7405-Eng-48.1
References
- [1] Canalizo, G., Max, C. E., Whysong, D., Antonucci, R., Dahm, S. E. 2003, ApJ, 597, 823
- [2] Carilli, C. L., & Barthel, P. D. 1996, A&A Rev., 7, 1
- [3] de Koff, S. et al. 2000, ApJ, 129, 33
- [4] Imanishi, M., & Ueno, S. 2000, ApJ, 535, 626
- [5] Maiolino, R., Marconi, A., Salvati, M., Risaliti, G., Severgnini, P., Oliva, E., La Franca, F., Vanzi, L. 2001, A&A, 365, 28
- [6] Ogle, P., et al. 1997, ApJ, 482, L37
- [7] Tadhunter, C. N., Packham, C., Axon, D. J., Jackson, N. J., Hough, J. H., Robinson, A., Young, S., Sparks, W. 1999, ApJ, 512, 91
- [8] Tadhunter, C. N., Sparks, W., Axon, D. J., Bergeron, L., Jackson, N. J., Packham, C., Hough, J. H., Robinson, A., Young, S. 2000, MNRAS, 313, 52
- [9] Ueno, S., Koyama, K., Nishida, M., Yamauchi, S., Ward, M.J. 1994, ApJL, 431, 1
- [10] Vestergaard, M., Barthel,P.D. 1993, AJ, 105, 456
- [11] Ward, M. J., Blanco, P. R., Wilson, A. S., Nishida, M. 1991, ApJ, 382, 115