eurm10 \checkfontmsam10 \pagerange1–8
Extended Coronal Emission Lines in Active Galactic Nuclei
Abstract
VLT and NTT spectra are used to examine the nuclear and extended coronal line emission in a sample of well-known Seyfert 1 and 2 galaxies. The excellent spatial resolution obtained with VLT allowed us to map [Si vi] 1.963m and [Si vii] 2.48m on scales of up to 20 pc. Coronal line emission, extended to distances of 102 pc, is detected in some of the lines analyzed, particularly in [Fe x] 6374Å, [Fe xi] 7891Å, and [Si vii] 2.48m. Most coronal lines are strongly asymmetric towards the blue and broader than low-ionization lines. This result is particularly important for Circinus, where previous observations had failed at detecting larger widths for high-ionization lines. Photoionization models are used to investigate the physical conditions and continuum luminosities necessary to produced the observed coronal emission. We found that an ionization parameter 0.10 is necessary to reproduce the observations, although the clouds should be located at a distance 30 pc.
in Galactic Nuclei††editors: Th. Storchi Bergmann, L.C. Ho & H.R. Schmitt, eds.
1 Introduction
Coronal lines (CL) are collisionally excited forbidden transitions within low-lying levels of highly ionized species (IP100 eV). They can be formed either by a hard UV continuum (Marconi et al. 1996; Ferguson et al. 1997), a very hot collisionally ionized plasma (Viegas-Aldrovandi & Contini 1989), or a combination of both processes (Contini et al. 1998). Due to the high energies involved in their production, the detection of CL is taken as an unambiguous signature of nuclear activity and can provide clues on the UV to soft X-ray spectral energy distribution of the active nucleus (Prieto et al. 2002).
Observationally, CL are blueshifted relative to the systemic velocity of the host galaxy (V 500-800 km/s) and broader than low ionization lines (Penston et al. 1984). This has led to the idea that CL are associated to outflows (Erkens et al. 1997) and formed in a separate region (termed as coronal line region, CLR) located between the classical narrow line region (NLR) and broad line region. However, both the physical conditions of the coronal gas and the size of the emitting region are matters of strong controversy (Erkens et al. 1997; Nazarova et al. 1999). Published results usually rely on measurements made on just a few CLs and information about the size of their emitting regions, on the same target, is very scarce.
With the above in mind, the goals of this work are: (i) Observe a sample of well-known AGN in order to measure the size of the emitting region for different coronal lines; (ii) model the observe emission to obtain clues on the physical conditions of the CLR; (iii) study the kinematics of the coronal gas and compare it to that of other NLR lines.
2 Main results
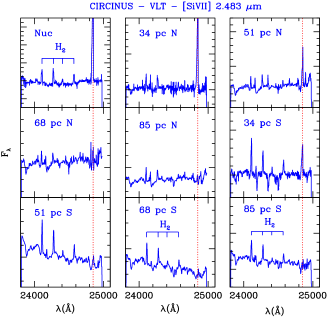
A sub-sample of the observed data, collected using VLT/ISAAC at ESO for NGC 1068 and Circinus, is presented in Figure 1. The spatial scale of the detector (0.15”/pix), combined with the good seeing during the observations (0.6”) allowed us to map gas emission at a spatial resolution down to 20 pc. The slit in both configurations was oriented north-south.
The right panel of Figure 1 shows that in Circinus the [Si vii] line extends from the unresolved nucleus (R17 pc), up to 70 pc to the north and 34 pc to the south, implying a total size of 100 pc for the [Si vii] emitting region. In contrasts, [Si vi] (not shown in the Figure 1) is limited to the central 70 pc. These values, however, are larger than those derived by Oliva et al. (1994), who estimated that the size of the CLR in Circinus was only 10 pc. Due to the better sensitivity of our data, we show that the coronal gas extends farther out from the centre than previously found. For comparison, note that the H2 lines in Figure 1 are detected in all regions where spectra were extracted.
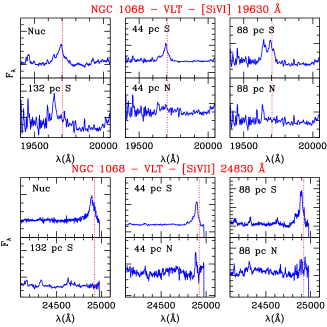
In NGC 1068, both [Si vi] and [Si vii] extends from the unresolved nucleus to 90 pc south and up to 40 pc north (bottom and upper left panels of Figure 1). These values, however, are significantly lower than that of 300 pc to the south and 200 pc to the north derived from NICMOS [Si vi] imaging of Thompson et al. (2001). Note, however, that the Thomson et al’s data may be misleading because of contamination of [Si vi] 1.963m by H2 1.957m, easily seen in Figure 1, where both lines are heavily blended. At 88 pc from the nucleus, [Si vi] 1.963m and H2 1.957m have similar strengths and at distances larger than 120 pc, only the H2 is detected.
Overall, our data show that all CL are emitted in the inner 100 pc of the active nucleus. When compared to low-ionization and molecular lines, we found that the emitting region of the latter two set of lines extends to much larger distances (R 500 pc). This result rules out the hypothesis of Ferguson et al. (1997) of a a low-density CLR extending up to 1 kpc from the active nucleus but also rules out very compact CLR with upper limits of a few parsecs.
3 Are pure photoionization driving the CL emission?
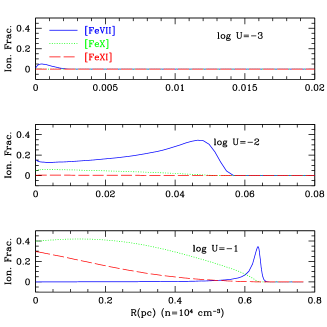
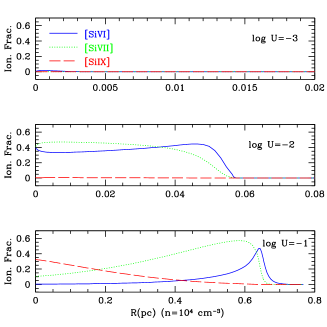
We tested the possibility of the CL being emitted from distances of up to several tens of parsecs from the central engine assuming pure photoionization. For this purpose, we run models with the AANGABA code (Gruenwald & Viegas 1992). The adopted spectral energy distribution (SED) was that suggested by Fig. 7 of Oliva et al. (1999) for Circinus. Two values of luminosities of the ionizing radiation were adopted: erg s-1 and and erg s-1, suggested by Ferguson et al. (1999) and Oliva et al. (1999), respectively. The number of ionizing photons, , provided by these the two SEDs are 2.5 s-1and 2.5 s-1. Density was varied from 102 cm-3 to 106 cm-3. Three values for the ionization parameter were employed: 10-3, 10-2 and 10-1.
Figure 2 shows the distribution of the ionic fraction of iron and silicon versus the size of the emitting cloud for the three values of employed. Note that R, equivelent to the cloud size, is measured from the side of the cloud facing the ionizing radiation to the outer edge. The value of density that best reproduces the observations is =104 cm-3, in accord to that of 0.5104 cm-3 determined for the CLR from the [Ne v] 14.3m / 24.3m line ratio with ISO (Moorwood et al. 1996).
The results show that an is necessary in order to have clouds with an ionization structure similar to that observed i.e., simultaneous presence of [Si vi], [Si vii], and [Fe vii] through [Fe xi]. In addition, for the parameters adopted, the emitting clouds must located within 8 to 30 pc from the central engine. Coronal emission located farther out from the source would requiere erg s-1. More detailed modeling of our data can be found in Rodríguez-Ardila et al. (2004, in preparation).
4 Kinematics of the coronal gas
The kinematics of the coronal gas was studied by comparing the emission line profiles of low and high excitation lines. Figure 3 show the results obtained for Circinus and NGC 3783.
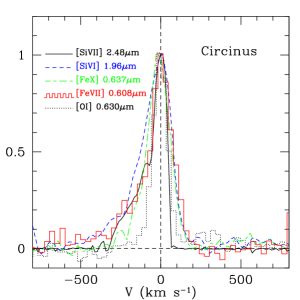
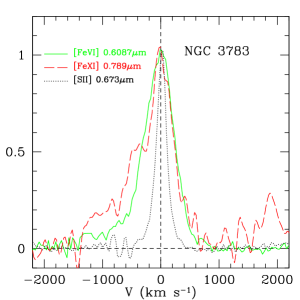
As is easily seen, the coronal lines in both objects are highly asymmetric towards the blue and broader than low-ionization lines. Previous works on Circinus (Oliva et al. 1994, 1999) had failed to detect any significant variation between the width and the IP of the forbidden lines. In fact, Moorwood et al. (1996) had reported narrower widths in high excitation lines than in lower excitation lines. The VLT/ISAAC and NTT/EMMI spectra of Figure 3 remove this ambiguity and shows the presence of coronal gas with velocities close to 500 km s-1 in Circinus. Blue asymmetric profiles are also observed in NGC 3783. Note, however, that the line profile of [Fe xi] implies radial velocities of up to 1500 km s-1, suggesting as in Circinus, that part of the gas must arise in outflows very close to the central engine. Of the six objects studied, only NGC 1068 shows no difference between the FWHM of low and high ionization lines.
5 Summary
EMMI/NTT and ISAAC/VLT spectra are used to determine the size of the CLR in a sample of well-known Seyfert 1 galaxies by means of the simultaneous observation of [Fe vii], [Fe x], [Fe xi], [Si vi] and [Si vii] lines. Our data show that all coronal lines are emitted from the unresolved nucleus to distances of up to 80 pc. We showed that the coronal emission region can arise from gas photoionized from radiation of the central engine if 0.1, 104 cm-3, solar abundances, cloud sizes of 1 pc and distances from the central source of up to 30 pc. The analysis of the coronal emission line profiles shows that they are highly asymmetric towards the blue, even in Circinus, where previous observations had measured widths of the order of 100 km s-1. For this object, we found coronal gas with velocities of up to 400 km s-1, suggesting that shocks must probably contribute to the observed emission.
References
- [Contini et al. (1998)] Contini, M., Prieto, M. A., Viegas, S. M. 1998 ApJ 505, 621–633.
- [Erkens et al. (1997)] Erkens, U., Appenzeller, I., & Wagner, S. 1997 A&A 323, 707–716.
- [Ferguson et al. (1997)] Ferguson, J. W., Korista, K. T., & Ferland, G. J. 1997 ApJS 110, 287–297.
- [Gruenwald & Viegas (1992)] Gruenwald, R. & Viegas, S. M. 1992 ApJS 78, 153–178.
- [Marconi et al. (1996)] Marconi, A., van der Werf, P. P., Moorwood, A. F. M., & Oliva, E. 1996 A&A 315, 335–342.
- [Moorwood et al. (1996)] Moorwood, A. F. M., et al. 1996 A&A 315, L109–L112.
- [Nazarova et al. (1999)] Nazarova, L. S., O’Brien, P. T., & Ward, M. J. 1999 A&A 343, 682–690.
- [Oliva et al. (1999)] Oliva, E., Marconi, A., & Moorwood, A. F. M. 1999 A&A 342, 87–100.
- [Oliva et al. (1994)] Oliva, E., Salvati, M., Moorwood, A. F. M., & Marconi, A. 1994 A&A 288, 457–465.
- [Penston et al. (1984)] Penston, M., Fosbury, R. A. E., Boksenberg, A., Ward, M. J., & Wilson, A. S. 1984 MNRAS 208, 347–364.
- [Prieto et al. (2002)] Prieto, M. A., Pérez Garcia, A. M., & Rodríguez Espinoza, J. M. 2002 MNRAS 329, 309–314.
- [Thompson et al. (2001)] Thompson, R., Chary, R.-R., Corbin, M. R, & Epps, H. 2001 ApJ 558, L97–100.
- [Viegas-Aldrovandi & Contini (1989)] Viegas-Aldrovandi, S., & Contini, M. 1989 ApJ 339, 689–699.