e-mail:nanda@astro.up.pt, 22institutetext: Observatorio Astronómico Nacional, Alfonso XII, 3, E-28014 Madrid, Spain
The structure of Onsala 1 star forming region
We present new high-sensitivity high-resolution mm-wave observations of the Onsala 1 ultra-compact HII region that bring to light the internal structure of this massive star forming cloud. The 1.2 mm continuum map obtained with the IRAM 30-m radiotelescope (11 resolution) shows a centrally peaked condensation of 1′ size (0.5 pc at the assumed distance of 1.8 kpc) which has been further investigated at higher resolution in the 3 mm continuum and in the emission lines of H13CO+ J=1–0 and SiO J=2–1 with the IRAM Plateau de Bure interferometer. The 3 mm data, with a resolution of 54, displays a unresolved continuum source at the peak of the extended 1.2 mm emission and closely associated with the ultra-compact HII region. The H13CO+ map traces the central condensation in good agreement with previous NH3 maps of Zheng et al.zheng85 (1985). However, the velocity field of this central condensation, which was previously thought to arise in a rapidly rotating structure, is better explained in terms of the dense and compact component of a bipolar outflow. This interpretation is confirmed by SiO and CO observations of the full region. In fact, our new SiO data unveils the presence of multiple (at least 4) outflows in the region. In particular, there is an important center of outflow activity in the region at about 1 north of the UCHII region. Indeed the different outflows are related to different members of the Onsala 1 cluster. The data presented here support a scenario in which the phases of massive star formation begin much later in the evolution of a cluster and/or UCHII region last for much longer than 105yrs.
Key Words.:
Stars: formation –Interstellar medium: jets and outflows – ISM: HII regions–ISM: clouds1 Introduction
Onsala 1 (ON 1) is an ultra-compact HII (UCHII) region situated in the densest part of the Onsala molecular cloud (Israel & Wootten iw83 (1983)). It is one of the most compact and isolated UCHII regions known to be associated with several signposts of massive star formation such as dense gas, high velocity gas, masers, and near-infrared sources. However, a single luminous (10 L⊙) far-infrared (FIR) point source namely IRAS20081+3132 is associated with this UCHII region. The luminosity estimated from FIR data and the centimeter(radio) emission agree well, within a factor of 100 L⊙, and indicate a spectral type of B0.3-B0.6 (MacLeod et al. macleod98 (1998)). At a spatial resolution of 0.7″-1.5″, the UCHII is detected as an unresolved source at 2 cm & 3 cm wavelengths (Kurtz et al.kurtz94 (1994)). Higher angular resolution(0.1″) observations at 1.2 cm resolve the UCHII region into an approximate shell structure of size 0.6″(Turner & Matthews tm84 (1984)). This source is placed at a distance of 1.3-6 kpc by various authors in the literature. However, a distance of less than 2 kpc is favored by most authors for many valid reasons (see e.g. MacLeod et al.macleod98 (1998); Watson et al. wat03 (2003)). We therefore adopt the near-distance of 1.8 kpc to this source for the purposes of this work.
Several masers such as OH (Ho et al. ho83 (1983)), H2O (Downes et al. dow79 (1979)), CH3OH (Menten men91 (1991)) and HCHO (MacLeod et al. macleod98 (1998)) are known to coincide with ON 1. Spatially separated blue and red shifted OH maser spots around ON 1 have been identified by Desmurs & Baudry (db98 (1998)) using VLBI techniques. Observations using dense gas and dust tracers have shown a compact, nearly circular dense core surrounding ON 1. Maps of 350m continuum emission (Mueller et al. mueller00 (2000)) and CS J=5-4 emission (Shirley et al. shir03 (2003)) show dense circular condensations around the source. Emission from transitions of CH3CN J=12-11 (Pankonin et al. pank01 (2001)) and HNCO (Zinchenko et al. zinch00 (2000)) are also found to peak on ON 1. Using VLA observations at 11″resolution in the (J,K)=(1,1) line of NH3, Zheng et al. (zheng85 (1985), hereafter ZHRS85) argued for the presence of a rapidly rotating gas condensation centered on ON 1. However, the regions of massive star formation often possess an intricate kinematic behavior involving motions of rotation, infall, and outflow, and the actual existence of a rapid gas condensation in ON 1 needed confirmation with higher resolution observations. In this paper, we present high-sensitivity high-resolution (5″) line and continuum observations which are used to investigate in detail the dense core and outflowing gas associated with ON 1.
2 Observational Data
The IRAM 30 m radiotelescope at Pico Veleta (near Granada, Spain) was used to map the 1.2 mm continuum emission from the ON 1 region in December 2000. We used the MAMBO 1 bolometer array to produce an on-the-fly map with a scanning speed of s-1, a wobbler period of 0.5 s, and a wobbler throw of . The central frequency of the detectors was 240 GHz, and the bandwidth 70 GHz. Sky dips made immediately before and after the map were used to correct for the atmospheric extinction, and a global calibration factor of 15000 counts per Jy (based on an observation of Uranus) was applied to the data. The resulting map (produced with the IRAM NIC software) has an angular resolution of .
High resolution interferometric observations of ON 1 region were carried out using the IRAM Plateau de Bure (PdB) interferometer (near Grenoble, France) in its D (5 antennas) and C (6 antennas) configurations. Observations using the compact D array configuration were carried out on the nights of 28 May 2002 and 20 July 2002 for two adjacent fields; one field centered on the ON 1 FIR point source/UCHII region and another at offset 1′north. The C array configuration observations for the same fields were obtained during the nights of 9 and 10 January 2003. Each field was a mosaic of 9 pointings arranged in a 33 matrix with a spacing of 12″ which is roughly equal to half the primary beam size. We used the SIS heterodyne receivers both at 87 GHz and 230 GHz. The 230 GHz data was mostly unusable due to summer weather conditions. Six spectral correlators were used to select three spectral lines, namely, SiO J=2–1(=86.846891 GHz), H13CO+ J=1–0 (=86.754330 GHz) and CO J=2–1 (=230.538 GHz) and two continuum bands centered at 1.2 mm and 3 mm wavelengths. The system temperature was typically 100 K at 3 mm and 400 K at 1.2 mm with a phase noise of 25∘-35∘at 3 mm and 40∘-50∘ at 1.2 mm. The D configuration provided baselines of 24m-82m while the C configuration resulted in baseline range of 48m-229m. We used the sources 2023+336 and 2013+370 as the primary phase calibrators and MWC349, 2013+370 and 3C345 for flux calibration. Synthesized clean beams at 3 mm measured 5.353.7 (PA=56∘) which represent the typical resolution of the interferometric data presented here. The resulting maps does not include any short spacing data from single dish observations and thus filter out all large scale structures.
3 Results
3.1 Continuum observations
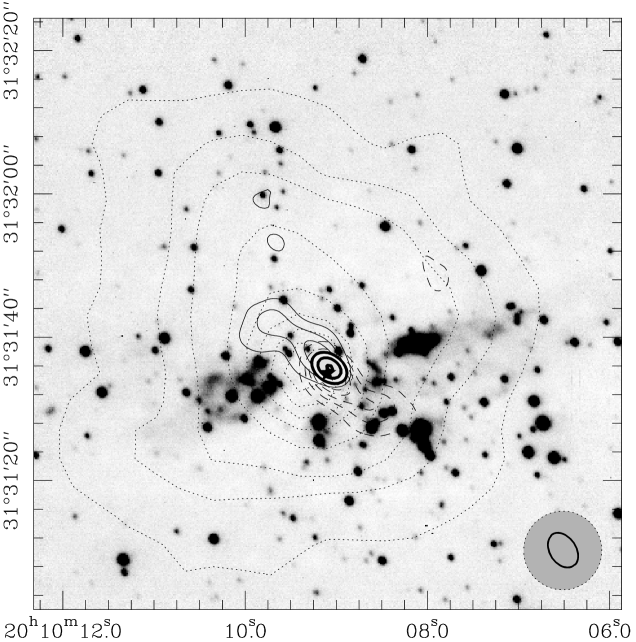
In Fig.1 we depict the results of observations that represent the dense gas and dust in the region of ON 1. The star symbol shows the coinciding position of the UCHII region, the luminous IRAS point source and all the maser spots that represent the massive young stellar object, which we shall henceforth refer to as ON 1. The 1.2 mm continuum emission is extended over a size scale of 70 and elongated in the North-East direction. The 1.2 mm continuum emission is a sensitive tracer of the warm dust and therefore indicates the dense cloud surrounding ON 1. The spatial extent and morphology of the 1.2 mm continuum map is very similar to that of 350m map (Mueller et al. mueller00 (2000)), the CS emission line maps (Shirley et al. shir03 (2003)) and also the integrated NH3 emission (ZHRS85) which has been thought to represent a rapidly rotating condensation. The source ON 1 and the surrounding embedded cluster all appear well immersed in the observed 1.2 mm emission. Therefore the 1.2 mm emission region in Fig. 1, which is representative of the condensation unveiled by all other dense gas tracers, can be considered as the dense core in which the ON 1 cluster has been forming. The 3 mm continuum emission reveals an unresolved source centered on ON 1. The interferometric observations filter out the extended emission and show the underlying small scale structure. Therefore the 3 mm continuum emission centered on ON 1 is indicative of the major condensations within the more extended clump traced by the 1.2 mm emission. However, 10m observations (Kumar et al. kum03 (2003)) reveal two closely situated sources coinciding with the unresolved 3 mm source indicating that ON 1 is likely to harbor a binary protostar.
The 1.2 mm emission maps can be used to estimate the mass of the ON 1 clump and the 3 mm continuum emission the mass of the unresolved central source(s). The black body fits to the Far-Infrared (FIR) flux density distribution of ON 1 indicates a dust temperature of 57 K (Mueller et al. mueller00 (2000)). Since the peak of the dust condensation coincides with an UCHII region, this value is likely an upper limit. If we assume a dust absorption coefficient of =0.0005 kg-1m2 (Henning et al. henning95 (1985)) and a distance of 1.8 kpc to the source, the observed 1.2 mm continuum emission represents a cloud mass of 3860M⊙ for T=50K and 5000M⊙ for T=40K. The source averaged flux density (3.6 Jy/beam) imply hydrogen column densities of 1.41024cm-2 resulting in A700 mag. The peak column density is even higher at 8.21024cm-2 implying a few thousand magnitudes of visual extinction. However, these numbers are to be treated with caution due to the presence of the UCHII region. The observed emission does not faithfully represent the temperature of the warm dust since the heating effects of the UCHII region can contribute to a majority of emission close to the peak. The 3 mm emission from the unresolved source represents a mass of 400M⊙, where we have used =6.610-5 kg-1m2. This value of is obtained by assuming a spectral emissivity index =2. There is increasing observational evidence which suggest that the value of is likely much lower (1) around massive protostellar sources (ex: Hunter et al.hun00 (2000)) . If we assume 1 then the resulting estimates of the embedded mass in the observed 3 mm emission will be lower than quoted above. In any case, the derived mass from 3 mm emission is probably an over estimate since 3 mm continuum emission is known to trace free-free emission also and may not be a good tracer of the dust alone (Downes et al. downes92 (1992)). In view of these facts we can safely assume that the enclosed mass in the unresolved central object is not greater than 300-400M⊙. Thus about 6-8% of the overall dense core mass seems to be in the form of protostellar material at the center.
3.2 H13CO+ J=1–0 Emission
In Fig. 1 solid and dashed contours show blue and red shifted H13CO+ J=1–0 emission, respectively, integrated in the velocity range V4.5 km s-1. As evident from the figure, the H13CO+ emission is centered on the source ON 1 and reveals a spatially resolved bipolar structure. The position angle (PA) of the axis of this well-collimated bipolar structure is 44∘ and roughly coincides with the elongation displayed by the 1.2 mm contours. The H13CO+ emission also coincides well with the NH3 condensation mapped by ZHRS85. The projected length of this bipolar emission is 30 corresponding to about 0.27 pc at the assumed distance of 1.8 kpc. Each lobe of this compact feature appears to consist of two distinct clumps.
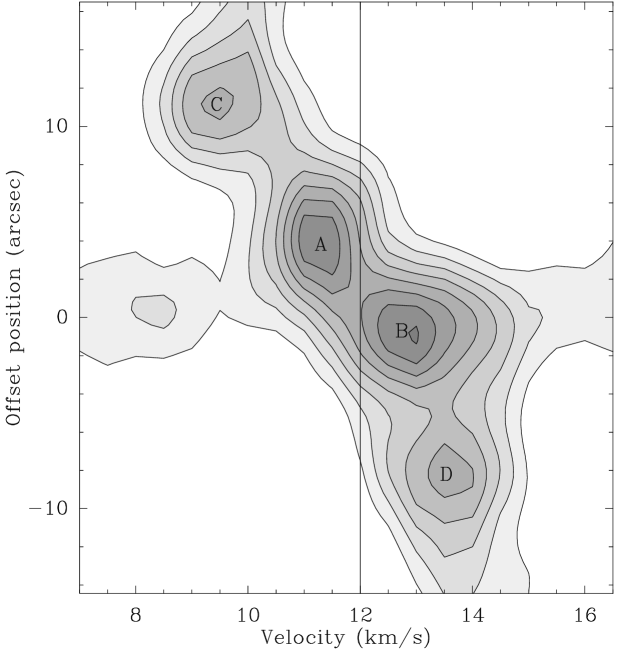
In Fig. 2 we show a velocity-position map obtained along the axis (PA44∘) of this bipolar feature which reveals a structure that is distinctly different from earlier claims of ZHRS85. The vertical line represents the systemic LSR velocity at 12 km s-1. The red-shifted southern lobe and the blue-shifted northern lobe can be seen clearly separated into two components on the PV diagram. A main component of the emission (denoted by A & B in Fig. 2) stretches to a radius of 5 and a satellite component comprising of two knots (denoted by C & D) extends to a radius of 10. These 4 clumps correspond to the clumps found on the images (Fig.1). As can be seen from Fig.2, all of the found emission is spread along a straight line on the PV-plane showing increasing velocity with increasing distance from the central position following a Hubble law. We have not subtracted the bright continuum emission from this data. The continuum emission can therefore be seen close to the source (offset = 0) extending on either side of the Vlsr, up to the limits of our observing setup with the spectrometers.
Since the H13CO+ J=1–0 emission is symmetrical both in position and velocity with respect to the central position and velocity, it is natural to conclude that such emission arises in a bipolar outflow emerging from the central object. Note that the observed kinematical structure can not be easily explained with a rotating disk. First of all, the total size of this structure (0.2 pc) is too large to be a disk and, moreover, a disk would produce just two peaks of emission in the PV diagram, not four peaks as the A,B,C, & D peaks which are actually observed in Fig. 2. The Hubble-like velocity law distribution which is observed in Fig. 2 (velocity proportional to the distance) is also very typical of young bipolar outflows. A straight line fit through all the knots shows a gradient of 30 km s-1 pc-1 at the assumed distance of 1.8 kpc. These velocity limits and the velocity gradient are similar to the values obtained from NH3 observations by ZHRS85 except that the gradient of 11 km s-1 pc-1 estimated by ZHRS85 is due to their adopted distance of 3.5 kpc. The interpretation that the H13CO+ emission arises in the compact component of a bipolar outflow is confirmed by the SiO high-velocity data shown in the following section.
Assuming standard LTE conditions, the observed H13CO+ emission can be used to compute the column densities and enclosed mass. If we assume a dipole moment of =4.08 debye (Haese & Woodshw79 (1979)) and an H13CO+/H2 ratio of 3.310-11 (Blake et al. blake87 (1987); in OMC1), the observed fluxes indicate an enclosed mass of 280M⊙-330M⊙for temperatures of 40 K-50 K. The estimated mass can be uncertain by a few hundred solar masses depending on the assumed value of H13CO+/H2 ratio and excitation temperature. In any case, the estimated H13CO+ mass is of the same order than the mass evaluated from the 3 mm continuum emission.
3.3 SiO & CO observations
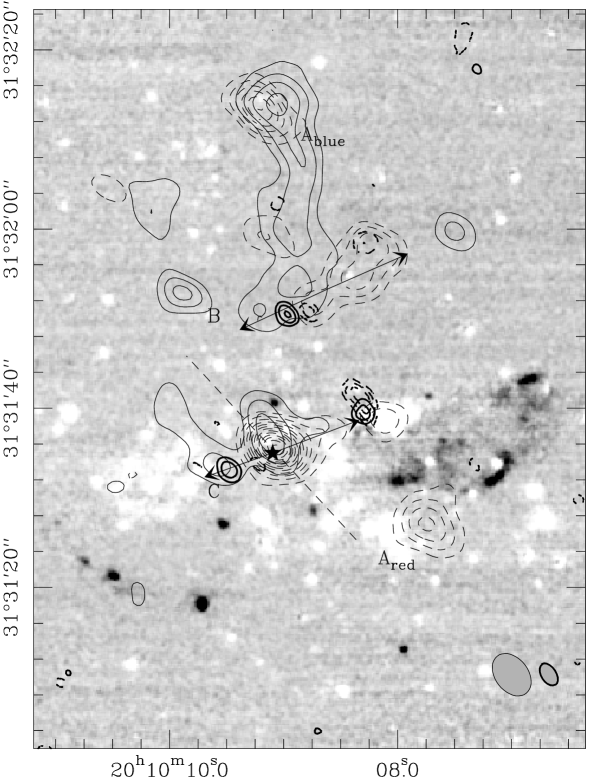
In Fig. 3 we present the results of the SiO J=2–1 and CO J=2–1 high-resolution observations in all the region around ON 1 including the north zone in which the 1.2 mm emission is significant. The SiO emission is found at velocities of V4-5km s-1, with respect to the systemic velocity, whereas the CO emission appears to extend up to V12km s-1. The CO J=2–1 data at 1.2 mm is quite poor due to summer weather conditions, but the knots shown in Fig. 3 have high signal to noise ratio (10-15). Based on complementary blue and red shifted components we can identify at least four main outflows in the region. However, we caution that these maps do not reveal most of the large scale structures in the region, since we do not have any short spacing data from single dish telescopes included in the maps.
The first outflow is seen close to the central FIR source. The most internal component of this outflow is at PA45∘ in good agreement with the H13CO+ outflow component discussed in Section 3.2. As for the H13CO+ data, the blue-shifted emission is placed at the NE of the source, while the red-shifted emission is placed at the SW. We then believe that the SiO and the H13CO+ high velocity emission is tracing the same compact bipolar outflow which is emerging from the very vicinity of the FIR object.
Most remarkably, the region placed 40 north from ON 1 FIR appears to be an important center of outflow activity: a prominent high-velocity SiO feature which is marked as Ablue in Fig. 3 stretches approximately 30 in the north-south direction forming a kind of highly-collimated jet. the red shifted counterpart to this jet-like structure is not so obvious. We think that the bright red knot (Ared) on the south can be associated with Ablue because both structures are well aligned and because there is no other equally prominent blue component in the region. If these two features Ared and Ablue were actually part of the same outflow, this would have a total size of at least 1 or 0.5 pc. We caution however that it is difficult to identify bipolar counterparts at large scale in such complex regions.
A smaller outflow denoted by shows both blue and red shifted lobes and extends to about 25 in the east-west direction. This flow is traced even by the poor quality CO data appearing as spatially separated blue and red knots. The driving source of this outflow has not been identified neither in the near-infrared nor in the mm-wave observations. The 3 noise limit of 5 mJy of our 3 mm continuum maps imply a limiting detectable mass of 5-6 M⊙. Therefore this outflow is likely driven by a low mass object.
Finally, a short east-west jet-like feature, denoted by , is emerging from the dense blob of SiO emission surrounding the ON 1 source represents another distinct bipolar outflow. Indeed, this flow is traced more prominently by the symmetrically placed CO knots in an axis that closely matches with the axis of the overall bipolar distribution of near-infrared H2 emission. It is unclear if this outflow arises from the same object than the dense and compact NE-SW outflow seen in H13CO+ and SiO, and which has been discussed above. Since the FIR object is probably a binary system (Kumar et al. kum03 (2003)), it may be not surprising to find two different outflows emanating from its vicinity.
It appears anyway that high velocity emission is spread all over the cluster forming molecular cloud. Although our observations indicate the presence of real multiple outflows, it is also likely that some of these outflows have interacted with the surrounding cluster and broken into multiple components. This may be particularly true for the east-west flow which is traced by the CO knots, a faint SiO jet and largely by the NIR H2 emission.
4 Discussion
ON 1 was described to be a rapidly rotating condensation by ZHRS85 based on NH3 observations. The higher resolution data presented here along with other dense gas and dust tracing observations indicate that the NH3 condensation described by ZHRS85 actually corresponds to an outflow. The H13CO+ observations discussed in Section 3.2 has the orientation and velocity ranges similar to the NH3 features. However, for the first time, our observations shows a spatially resolved bipolar feature whose PV diagram is typical of outflows. Perhaps the H13CO+ observations alone would not have resolved the issue if this is an outflow or a rapidly rotating envelope, particularly because of the velocity structure close to the source and the low values of 2-3km s-1. But the SiO emission which traces other outflows in the region show only slightly higher values of 4-5km s-1. The symmetrical lobes of H13CO+ emission indicate that the outflow has a small inclination angle with respect to the plane of the sky. This implies small line-of-sight velocities of the H13CO+ structure in comparison to the SiO data. Indeed all other dense gas tracers from this region such as CS (Shirley et al.shir03 (2003)), CH3CN (Pankonin et al.pank01 (2001)) and HNCO (Zinchenko et al.zinch00 (2000)) display similar V11-12km s-1and 4-5km s-1. Therefore it is clear that the H13CO+ presented here spatially resolves the NH3 data from ZHRS85 and reveal an outflow well placed in the plane of the sky and possibly slow moving. A similar example where a large scale coherent NH3 structure (Jackson et al. jackson88 (1988)) is aligned well with an outflow (Bachiller & Cernicharo bc90 (1990)) is found in the case of NGC6334I.
In the light of above results, the following scenario appears most plausible for the ON 1 region. The UCHII region ON 1 is a relatively isolated massive star forming region associated with a small embedded cluster, all of which is immersed in a molecular clump of few thousand solar masses. The vicinity of the UCHII region appears to drive at least two (the H13CO+ compact outflow, the flow traced by CO knots and H2) and likely three (SiO flow A) major outflows indicating multiple embedded sources of similar evolutionary states. While the exact driving sources for each of these flows are not clear, it is very likely that the H13CO+ flow originate from one of the two mid-infrared (10m) sources (Kumar et al. kum03 (2003)) centered on ON 1. These two mid-IR sources are neither visible at 3.8m nor distinguishable by the millimeter observations. However, given that both sources show 10m emission and are associated with an unresolved mm continuum peak, and likely drive outflows, they may be at a similar evolutionary state. Thus the ON 1 source could harbor a massive binary protostar.
The H13CO+ and SiO outflows display very low line-of sight velocities. Low values of line of sight velocities in outflows can be expected if they lie in the plane of the sky as appears to be case for H13CO+ flow. But the SiO flow does not obviously appear to be oriented in the plane of the sky therefore indicating that the low line of sight velocities are representative of the region. The outflow traced by H13CO+ does not seem to show any obvious SiO counterparts. SiO production requires violent shocks and dust grain destruction while H13CO+ outflow emission only requires the acceleration of the dense core material (commonly traced by H13CO+). Given the high density of the central regions of this symmetric clump, the outflow traced by H13CO+ is likely encountering viscous forces thus only able to accelerate the gas rather than produce violent shocks. Further, since all dense gas tracers also display similar range of low velocities such as the observed outflows, it is suggestive that the outflows are experiencing an opposing force in its passage through the very dense, cluster forming core. Since the jet/outflow experiences the viscous forces uniformly from the point of ejection, the force only makes the flow have much lower velocities in comparision to other outflows.
The presence of a surrounding embedded cluster to ON 1 UCHII region represents a low mass stellar population that could be anywhere from Class I to pre-main sequence phases. If we consider that low mass stars form in 106yrs and massive stars form in 105yrs, the simultaneous presence of two massive outflows and the central location of the luminous sources provide two alternative scenarios. Either the massive star formation began much later than low mass star formation in this cluster forming core or that the formation of massive star/UCHII region phases last for much longer than 105yrs. While Herbig (herbig62 (1962)) suggested that massive stars form preferentially late in the evolution of a cluster, Stahler (stahler85 (1985)) argued that it is indeed so due to statistical reasons. In a related context, de Pree et al. (depree95 (1995)) suggest that the life times of the UCHII regions can be much longer than a few thousand years if they form and exist in dense and warm environments. The black body fits to the FIR flux densities of several relatively isolated massive star forming regions (ex: Hunter et al.hun00 (2000); Mueller et al.mueller00 (2000); Beuther et al. beu02a (2002)) suggest high temperatures between 50-100K and densities 105cm-3 supporting the scenario predicted by de Pree et al. (depree95 (1995)). This is also true for ON 1 in view of the high estimated column densities and temperatures. However these observations can not effectively rule out the possibility that massive star formation initiated much later than the surrounding cluster of low mass stars.
The FIR and radio flux of the ON 1 source and the mass estimates from this work suggest that ON 1 is among the early B type candidate massive protostars. This source can be compared to other well studied massive protostars such as IRAS05358+3843 (Beuther et al. beu02b (2002)), IRAS18556+0136 (Fuller et al. fuller01 (2001)) or W75N (Shepherd et al. shep03 (2003)). While W75N and IRAS18566+0136 have UCHII regions, IRAS05358+3843 has none and is likely about the same age as the massive protostars such as IRAS20126+4104 (Cesaroni et al. ces99 (1999)) and IRAS23385+6053 (Fontani et al.fontani04 (2004)). Among all these, ON 1 is a neat example of a circularly symmetric molecular condensation with a centrally placed massive binary protostar which is driving multiple outflows and surrounded by a young stellar cluster.
Acknowledgements.
We gratefully acknowledge Roberto Neri and Sebastian Muller for their extremely helpful support during the reduction of the IRAM interferometric data. This work has been supported by grant POCTI/1999/FIS/34549 approved by FCT and POCTI, with funds from the European Community programme FEDER, and by Spanish MEC grant PNAYA2000-0967.References
- (1) Bachiller, R. & Cernicharo, J. 1990, A&A, 239, 276
- (2) Blake, G. A., Sutton, E. C., Masson, C. R., & Phillips, T. G. 1987, ApJ, 315, 621
- (3) Beuther, H., Schilke, P., Menten, K. M., Motte, F., Sridharan, T. K. & Wyrowski, F. 2002, ApJ, 566, 945
- (4) Beuther, H., Schilke, P., Gueth, F., McCaughrean, M., Andersen, M., Sridharan, T. K., & Menten, K. M. 2002, A&A, 387, 931
- (5) Cesaroni, R., Felli, M., Jenness, T., Neri, R., Olmi, L., Robberto, M., Testi, L., & Walmsley, M. 1999, A&A, 345, 949
- (6) de Pree, C. G., Rodriguez, L. F. & Goss, W. M. 1995, RMxAA, 31, 39
- (7) Desmurs, J. F. & Baudry, A. 1998, A&A, 340, 521
- (8) Downes, D., Genzel, R., Moran, J. M., et al. 1979, A&A, 79, 23
- (9) Downes, D., Radford, S. J. E., Guilloteau, S., Guelin, M., Greve, A. & Morris, D. 1992, A&A, 262,424
- (10) Fontani, F., Cesaroni, R., Testi, L., Walmsley, C. M., Molinari, S., Neri, R., Shepherd, D., Brand, J., Palla, F., & Zhang, Q. 2004, A&A, 414, 299
- (11) Fuller, G. A., Zijlstra, A. A., & Williams, S. J. 2001, ApJ, 555, L125
- (12) Haese, N. N., & Woods, R. C. 1979, Chem. Phys. Lett., 61, 396
- (13) Herbig, G. H., 1962, ApJ, 135, 736
- (14) Henning, Th., Michel, B., & Stognienko, R. 1995, Planet. Space Sci. (Special issue: Dust, molecules and backgrounds), 43, 1333
- (15) Ho, P. T. P., Haschick, A. D., Vogel, S. N., & Wright, M. C. H., 1983, ApJ, 265, 295
- (16) Hunter, T. R., Churchwell, E., Watson, C., Cox, P., Benford, D. J. & Roelfsema, P. R. 2000, AJ, 119, 2711
- (17) Israel, F. P., & Wootten, H. A. 1983, ApJ, 266, 580
- (18) Jackson, J. M., Ho, P. T. P. & Haschick, A. D. 1988, ApJ, 333L, 73
- (19) Kumar, M. S. N., Bachiller, R., & Davis, C. J. 2002, ApJ, 576, 313
- (20) Kumar, M. S. N., Davis, C. J. & Bachiller, R. 2003, Ap&SS, 287,191
- (21) Kurtz, S., Churchwell, E., & Wood, D. O. S. 1994, ApJS, 91, 659
- (22) MacLeod, G. C., Scalise, E., Saedt, S., Galt, J. A., & Gaylard, M. J. 1998, AJ, 116, 1897
- (23) Menten, K. 1991, ApJ, 380L, 75
- (24) Mueller, K. E., Shirley, Y. L., Evans, N. J., II & Jacobson, H. R. 2000, ApJS, 143, 469
- (25) Pankonin, V., Churchwell, E., Watson, C. & Bieging, J. H. 2001, ApJ, 558, 194
- (26) Shepherd, D., Testi. L., & Stark, D. P. 2003, ApJ, 584, 882
- (27) Shirley, Y. L., Evans, N. J., Young, K. E., Knez, C. & Jaffe, D. T. 2003, ApJS, 149, 375
- (28) Stahler, S. W., 1985, ApJ, 293, 207
- (29) Turner, B. E., & Matthews, H. E., 1984, ApJ, 277, 164
- (30) Watson, C., Araya, E., Sewilo, M., Churchwell, E., Hofner, P., & Kurtz, S. 2003, ApJ, 587, 714
- (31) Zhang, Q., Hunter, T. R., & Sridharan, T. K., 1998, ApJ, 505, L151
- (32) Zheng, X. W., Ho, P. T. P., Reid, M. J., & Schneps, M. H. 1985, ApJ, 293, 522
- (33) Zinchenko, I., Henkel, C. & Mao, R. Q. 2000, A&A, 361, 1079