Testing blend scenarios for extrasolar transiting planet candidates. I. — OGLE-TR-33: a false positive
Abstract
We report high-resolution spectroscopic follow-up observations of the faint transiting planet candidate OGLE-TR-33 (), located in the direction of the Galactic center. Small changes in the radial velocity of the star were detected that suggested initially the presence of a large planet or brown dwarf in orbit. However, further analysis revealed spectral line asymmetries that change in phase with the 1.95-day period, casting doubt on those measurements. These asymmetries make it more likely that the transit-like events in the light curve are the result of contamination from the light of an eclipsing binary along the same line of sight (referred to as a “blend”). We performed detailed simulations in which we generated synthetic light curves resulting from such blend scenarios and fitted them to the measured light curve. Guided by these fits and the inferred properties of the stars, we uncovered a second set of lines in our spectra that correspond to the primary of the eclipsing binary and explain the asymmetries. Using all the constraints from spectroscopy we were then able to construct a model that satisfies all the observations, and to characterize the three stars based on model isochrones. OGLE-TR-33 is fully consistent with being a hierarchical triple system composed of a slightly evolved F6 star (the brighter object) near the end of its main-sequence phase, and an eclipsing binary with a K7-M0 star orbiting an F4 star. The application to OGLE-TR-33 of the formalism developed to fit light curves of transit candidates illustrates the power of such simulations for predicting additional properties of the blend and for guiding further observations that may serve to confirm that scenario, thereby ruling out a planet. Tests such as this can be very important for validating faint candidates.
1 Introduction
Precise radial velocity searches around nearby, relatively bright stars have yielded more than 100 extrasolar planet detections to date, with orbital periods ranging from 2.5 days to nearly 15 years (Schneider, 2004). The discovery of transits in the case of HD 209458b (Henry et al., 2000; Charbonneau et al., 2000) made it possible for the first time to measure the radius of the planet, as well as the inclination angle that removes the spectroscopic ambiguity in the mass. This opened a new era in the study of these objects, allowing astronomers to probe into the structure and evolution of extrasolar giant planets, and leading even to the first detection of a planetary atmosphere outside the solar system (Charbonneau et al., 2002; Vidal-Madjar et al., 2003, 2004).
With the realization that a fair number of the planets found by the Doppler technique have relatively short orbital periods (a few days), which makes the detection of transits across the disk of the parent star much more likely, photometric searches for such events have become a potentially important discovery tool. Numerous searches are underway —and others have already been completed— that target a variety of stellar populations including globular clusters, open clusters, and the general field (see Horne, 2003). The search strategies of these programs are quite varied (field of view and density of stars, magnitude limit, cadence of observations, passbands, etc.), but they all aim at milli-magnitude photometric precision and frequent observations to detect small drops in brightness of a few percent with a typical duration of only a few hours.
One of these searches, the Optical Gravitational Lensing Experiment (OGLE; Udalski et al., 1992), was not originally designed to search for planets but in its latest incarnation (OGLE-III) it has turned out to be one of the most successful in finding transit candidates. A total of 64 candidates have been reported by Udalski et al. (2002a, b, 2003) in three fields in the direction of the Galactic center. In many cases the candidates display light curves strongly resembling that of HD 209458. A further 73 transit candidates were reported in three other fields in the constellation of Carina (Udalski et al., 2002c, 2003). Dozens of other candidates have been found by other teams, although only a fraction of them have actually been reported in the literature.
In general photometry alone cannot unambiguously establish whether the object responsible for the transit is a planet (less than about 13 Jupiter masses), a brown dwarf (13–80 Jupiter masses), or a more massive stellar companion. The problem is compounded by the fact that the radius is nearly constant for objects with masses between 0.001 M☉ and 0.1 M☉ (see, e.g., Oppenheimer, Kulkarni, & Stauffer, 2000). Furthermore, light curves showing transit-like events of similar depth as that produced, e.g., by a Jupiter-size planet around a solar-type star (1%) can also be produced by other astrophysical phenomena. These include grazing geometry in a regular eclipsing binary, blending of the light of an eclipsing binary with a single star that may or may not be physically associated (and which dilutes the transit depth), or an eclipse produced by a small stellar companion passing in front of a large (early-type, or giant) primary star. Therefore, careful follow-up of these candidates becomes crucial to establish their true nature, especially given that the frequency of these “false positive” detections appears to be very high (see, e.g., Latham, 2003; Konacki et al., 2003a; Brown, 2003).
In this paper we focus on the transit candidate OGLE-TR-33, from the first of the OGLE-III samples toward the bulge of the Galaxy. This same sample led recently to the confirmation of the extrasolar transiting planet around the faint () star OGLE-TR-56 (Konacki et al., 2003a; Torres et al., 2004), only the second case known at the time. OGLE-TR-33 also appeared initially to be among the very best candidates for harboring a planetary companion. It has a photometric period of 1.95 days, and a transit depth of 3.4% in the band as determined by the OGLE team. However, as we describe below, follow-up work shows this not to be a transiting planet, but instead a very interesting example of a blend configuration with an eclipsing binary in a hierarchical triple system. We use this case to illustrate the importance of examining the spectral line profiles for variable asymmetries, and we develop a technique to model the light curve in detail in order to test various blend scenarios that satisfy all observational constraints. Such models allow one to accurately characterize the properties of the contaminating eclipsing binary, and to predict other observable quantities. Techniques such as this are valuable aids for validating transit candidates, particularly faint ones, which are rapidly increasing in number as photometric surveys continue operation.
2 Spectroscopic observations
OGLE-TR-33 (, ; J2000) was originally selected as a good candidate after careful low-resolution spectroscopic reconnaissance of the entire OGLE-III bulge sample carried out in 2002 (Konacki et al., 2003b). That work was designed to reject cases with obvious stellar companions on the basis of their large radial velocity variations (tens of km s-1) or early spectral type. Only 6 of the 39 candidates in the sample subjected to this filtering survived, and were then observed at much higher spectral resolution to try to detect low-amplitude velocity variations presumably indicative of a companion of planetary mass. The high-resolution observations of OGLE-TR-33 discussed in this paper were conducted with the Keck I telescope using the HIRES instrument (Vogt et al., 1994) on 2002 July 24–27. We obtained one spectrum on each of 4 nights, with an exposure time of 30 minutes resulting in signal-to-noise ratios of 15–20 per pixel. The wavelength coverage (36 echelle orders) is approximately 385–620 nm at a resolving power of . The usual strategy for Doppler planet searches with this instrument is to use the iodine gas absorption cell as the wavelength fiducial, which makes it possible to achieve m s-1 accuracy in the radial velocities for bright stars (e.g., Butler et al., 2003). Due to the faintness of our target (), however, the decision was made not to use the iodine cell in this case in order to minimize light loss, essentially trading off precision for increased signal. For the wavelength calibration we relied on exposures of a Thorium-Argon lamp taken before and after each stellar exposure. The limit to the velocity accuracy attainable with this procedure is ultimately set by the stability of the spectrograph (see below). The echelle reductions were performed using the MAKEE package (Barlow, 2002), including scattered light correction and cosmic ray removal. Orders blueward of about 400 nm were not used due to low signal.
Radial velocities were obtained by cross-correlation using the XCSAO task (Kurtz & Mink, 1998) running under IRAF111IRAF is distributed by the National Optical Astronomy Observatories, which is operated by the Association of Universities for Research in Astronomy, Inc., under contract with the National Science Foundation.. The template used is a synthetic spectrum chosen to closely match the star (which was assumed to be of solar metallicity), and also broadened to match the resolution of the instrument. The main parameters of this template (effective temperature, , and surface gravity, ) were estimated by comparison with a high signal-to-noise spectrum made by co-adding our 4 spectra. The model atmospheres are based on ATLAS9, along with opacities and extensive line lists developed by Kurucz (1993). We have added tools to compute the radial-tangential macroturbulent velocity field broadening, as well as complex rotational broadening of spectral lines. The code has been found to perform very well for solar-type stars (spectral type F–K). We fitted a large number of metal absorption lines of different ionization and excitation stages, as well as the core and wings of the Balmer H line. The parameters we derive correspond to a mid-F star with K, and a rotational broadening of about 40 km s-1, quite typical of F stars in the field. The constraint on the surface gravity is weaker, but we estimate it is not lower than . Figure 1 shows our fit to the observed spectrum in the region of the H line.
Our radial velocities for OGLE-TR-33 are the weighted average of the 31 orders we used, and have typical uncertainties of about 0.5 km s-1, except for the weaker exposure on the first night. This is much larger than we obtained for other OGLE targets during the same run (100 m s-1; Konacki et al., 2003b), and is due to the large rotational velocity of the star.
Two stars with known planets were observed each night as velocity standards: HD 209458 and HD 179949. Because their spectroscopic orbits are known (Mazeh et al., 2000; Naef et al., 2004; Tinney et al., 2001), we used them to evaluate the stability of the instrument over the 4 nights of our run. Suitable templates based on the same models as above were computed using the stellar parameters reported for these stars in the literature. Velocity reductions of HD 209458 and HD 179949 with the standard Th-Ar technique indicate that instrumental shifts are at the level of 100 m s-1 or less (see Konacki et al., 2003a, b).
3 Photometric data
OGLE-TR-33 was monitored photometrically by the OGLE group during the 2001 and 2002 seasons. A total of 396 observations were collected by that team in the band222http://bulge.princeton.edu/ogle/., with a nominal precision of 0.003 mag. In what follows, however, we have chosen to adopt a more realistic value for the error of 0.006 mag, based on the scatter outside of eclipse. Four transit-like events have been recorded (see Figure 2), although only one is reasonably complete. The transit ephemeris that has been derived from them333See http://bulge.princeton.edu/ogle/ogle3/transits/transits.html., and which we adopt in the following, is
| (1) |
where is the number of cycles elapsed since the reference epoch. The depth of the transit as reported by the OGLE team is 3.4%, and the mean brightness of the system is , with an estimated color index of (Udalski et al., 2002a).
The light curve of OGLE-TR-33 was examined independently by Drake (2003) and Sirko & Paczyński (2003) for signs of variability outside of eclipse (reflection effects, gravity brightening, ellipsoidal variability), which would almost certainly indicate a stellar companion as opposed to a planetary-mass object. Neither study found any significant variations. Further information on the nature of the companion can be gleaned from the shape and duration of the transits themselves, as shown by Seager & Mallén-Ornelas (2003), which allow the properties of the primary star to be inferred directly. In principle this can be used to rule out planetary companions in some cases, e.g., if the stellar properties are inconsistent with those of normal stars or with other information such as the spectral type. In practice the usefulness of the test depends strongly on the precision and phase coverage of the photometry, and unfortunately for OGLE-TR-33 the ingress and the bottom of the transit are not very well covered. While the resulting parameters for the star appear roughly consistent with those of a main sequence object and would not seem to clearly rule out a planetary companion, we consider these results to be inconclusive in this case444Seager & Mallén-Ornelas (2003) have shown that the stellar mass, radius, and density can be estimated readily by careful measurement of the depth of the transit (relative change in flux, ), its total duration (), and the duration of the flat portion (), along with the knowledge of the orbital period. For OGLE-TR-33 we measure those parameters to be , , and (the latter two in phase units), although with large uncertainties due to incompleteness of the light curve. The resulting stellar mass (1.74 M☉), radius (1.56 R☉), and density () are roughly consistent with those of an F0 main sequence star (e.g., Cox, 2000), allowing in principle for the possibility that the companion is indeed a planet. There may be a slight inconsistency, however, between that spectral type and the effective temperature for the star we estimated above (6500 K), and in addition the inferred size of the companion is perhaps somewhat large for a planet (0.29 R☉, or 2.8 RJup). In view of the difficulty in estimating the light curve parameters, and the fact that the measured values are close to the limit of validity of the equations of Seager & Mallén-Ornelas (2003), we prefer to regard the above results as inconclusive..
4 Spectroscopic results
Significant changes are evident in our Keck radial velocities for OGLE-TR-33 over 4 consecutive nights, with a peak-to-peak variation of nearly 4 km s-1. As can be seen using eq.(1) the observations were all taken near the quadratures, where the velocity excursion is expected to be the largest. In Figure 3a we show those observations folded with the known ephemeris. A Keplerian orbital fit is also shown, for an assumed circular orbit as expected on theoretical grounds given the relatively short period. Since the period and epoch are known sufficiently well from the photometry, the only two remaining adjustable parameters are the velocity amplitude, , and the center-of-mass velocity, . For these we obtained km s-1 and km s-1. The amplitude is highly significant compared to its error. For an edge-on configuration such as this would appear to be, the formal mass we infer for the orbiting companion is MJup, implying it is a large planet or perhaps a brown dwarf.
With the parameters adopted for the primary star in §2, a typical radius for an F star of 1.4 R☉, and an appropriate linear limb-darkening coefficient in the band of (Claret, 2000), we fit the transit light curve using the formalism of Mandel & Agol (2002). The solution is shown in Figure 3b along with the OGLE photometry. The inclination angle derived is essentially 90°, and the inferred radius of the companion is RJup.
However, further investigation revealed spectroscopic evidence that casts serious doubt on the interpretation that the velocities we measured are the result of orbital motion of a planet or a brown dwarf. We noticed, for instance, that the velocities were quite sensitive to some of the details of how they were computed with XCSAO. Specifically, they changed systematically and significantly as a function of the fraction of the cross-correlation peak considered in computing its centroid555The standard procedure followed in XCSAO and other similar programs for computing the radial velocity is to fit a parabola to the top portion of the cross-correlation peak, above a certain fraction pkfrac of the maximum, and to use that fit to compute the centroid. The parameter pkfrac can be changed by the user, but defaults to 0.5.. The velocity variations (semi-amplitude ) seemed to increase as we included portions of the correlation peak farther out on the wings, which is a rather strong indication that the correlation peak (and therefore the mean line profile) is asymmetric. Furthermore, the asymmetry appeared to change sides in phase with the velocities. Such behavior is not expected from simple Keplerian motion of the star in its orbit. Similar disproving evidence has recently been found in at least two other cases that appeared initially to be substellar companions as well (Queloz et al., 2001; Santos et al., 2002).
In order to examine the line asymmetries in OGLE-TR-33 more closely, we computed the line bisectors (see, e.g., Gray, 1992) determined directly from the correlation function, which is representative of the average shape of a spectral line for the star. The individual correlation functions for each echelle order were added together, resulting in an average line profile with much higher signal. The line bisectors for each of our 4 nights are shown in Figure 4 on an absolute velocity scale, and with the core of the line toward the bottom. In addition to the shifts, the asymmetries (curved bisectors) are obvious and are quite large, spanning several km s-1. For comparison, the line bisectors in the Sun and similar stars (which display the well known “C” shape due to granulation) span only a few hundred m s-1. More importantly, the asymmetries in OGLE-TR-33 are seen to correlate with the phase in the orbit (see Figure 3a), an effect that cannot normally be produced solely by the orbital motion of the star.
The most obvious explanation for the changing asymmetry is the presence of another star in the system, whose spectral lines shift back and forth with the photometric period, and distort those of the primary. Note that additional information is given by the type of asymmetry observed. In this case it is “leading” asymmetry (broader wing of the line profile toward more positive velocities when the measured velocity is also positive compared to , and conversely on the other side of the orbit), as opposed to “trailing” asymmetry (see also Sabbey et al., 1995). The latter case would result, for example, from blending of the F star with another star having a constant velocity near . This can be ruled out in this case, and therefore the contamination must be from an eclipsing binary, composed perhaps of a late F or early G star (causing the line asymmetries) and an M star. The systemic velocity of this binary must be quite similar to that of the F star. The binary would be responsible for the transit-like events in the light curve, with the original depth of the eclipses being diluted by the light of the main F star. We examine this hypothesis in more detail below.
5 Testing the blend model
A fair number of the light curves for extrasolar transiting planet candidates found in various surveys have been explained before as being the result of grazing eclipses, transits by a small star in front of a large star, or blends with an eclipsing binary. Unfortunately these situations appear to be far more common than anticipated, and more common also than bona-fide transiting planets, a fact that is just now beginning to be fully appreciated and that is likely to impact design strategies for future transit searches (see Brown, 2003), even from space. Nevertheless, relatively few blend cases have been documented in detail in the literature (see Mallén-Ornelas et al., 2003; Yee et al., 2002; Latham, 2003; Charbonneau et al., 2004). In OGLE-TR-33 there is rather strong evidence that contamination may be the case as well, but we wish to go beyond qualitative explanations and test this hypothesis in a more quantitative way. Our motivation for doing this is to develop general procedures that may serve to test other cases where the evidence for a blend is more subtle, or not obvious at all. Such candidates are bound to present themselves in current or future searches, and are the most challenging to rule out. The shape and duration of the observed transits provide important constraints on possible configurations involving a contaminating eclipsing binary. Therefore we first investigate whether the OGLE-TR-33 photometry is consistent with this explanation, by simulating realistic binary light curves including dilution effects. Next we examine our spectra further for direct evidence of lines of another star, guided by the results of the simulations.
5.1 Simulating eclipsing binary light curves
Although the variety of possible eclipsing binaries with which the F star in OGLE-TR-33 could be blended may seem very large, clues from the light curve itself and also from the spectroscopy limit the range considerably. For example, the very short duration of the transits (0.07 in phase, or 3.3 hours) indicates that the eclipsing binary is well detached, as opposed to the fairly common W UMa or Algol systems. In addition, there is no evidence of a secondary eclipse, suggesting the companion is much cooler than the primary. The large asymmetries in the lines of the F star suggest that the primary of the eclipsing binary is shifting back and forth by tens of km s-1, and this would indicate that the companion is a star rather than a substellar object. Therefore we consider here only detached systems composed of main sequence stars. In order to generate synthetic light curves to be fitted to the real data we relied on the computer program EBOP (Popper & Etzel, 1981), based on the Nelson-Davis-Etzel model (Nelson & Davis, 1972; Etzel, 1981), which is adequate for well detached systems. This model accounts for the oblateness of the stars, as well as the effects of reflection, limb darkening, and gravity brightening. In the following we refer to the primary and secondary of the eclipsing binary as star 1 and star 2, while the F star OGLE-TR-33 itself (which provides “third light” and dilutes the eclipses of the binary) is referred to as star 3. The physical properties of the stars that are needed to generate a light curve are selected from model isochrones, and the two components of the binary are assumed to be on the same isochrone666The reliability of stellar evolution models and their usefulness for predicting the physical properties of stars is well supported by the strong observational constraints provided by eclipsing binaries, at least in the range from about 1 M☉ to 10 M☉. For low-mass stars of spectral type M, however, all existing evolutionary models become less realistic to some extent due to limitations in the equation of state, convection prescriptions, missing opacities, and/or the boundary conditions adopted. We discuss these limitations and their impact on the present analysis below.. Whether or not star 3 can be assumed to conform to the same isochrone as the binary will depend on whether the stellar configuration is a physical triple system. If not, the age —and even the chemical composition— can be different, and a separate isochrone is used (see below).
For each binary component the selected isochrone provides the radius (), , , and absolute magnitudes in the visual band () and in the band (). We used these to compute some of the parameters needed to generate a light curve with EBOP, which are: (the central surface brightness of the secondary in units of that of the primary), (the radius of the primary in units of the semimajor axis, ), (the ratio of the radii), (the mass ratio), and the limb-darkening coefficients in the band (linear approximation). The latter were interpolated from the tables by Claret (2000) for the and of each component. The gravity brightening coefficients were set to values appropriate for convective stars (0.32). The orbit of the binary was assumed to be circular, and the inclination angle in this particular case can be set to 90° for simplicity and also because the flat-bottomed transits in OGLE-TR-33 suggest total eclipses (although in principle the inclination can be left as an additional free parameter; see below).
The surface brightness ratio in the band was derived from the expression
| (2) |
where and are the limb-darkening coefficients for the primary and secondary, and the last term represents the ratio of the luminosities in the band in terms of the absolute magnitudes given by the isochrones (see, e.g., Kallrath & Milone, 1999).
Dilution of the depth of the binary eclipses by the light from star 3 is controlled by the “third light” parameter, , which is defined in EBOP so that the sum of the three luminosities is unity. Since the absolute magnitude of star 3 is also given by the isochrones for its adopted mass and age, third light (in the band) was computed simply as
| (3) |
For each trial combination of a primary and secondary for the eclipsing binary, and the fixed properties of star 3 (see below), a synthetic light curve can be generated and compared with the observations in a least-squares sense. In practice we explore a wide range of primary and secondary masses and search for a minimum of the sum.
The blend model described above is quite general and allows us to predict a number of properties of the eclipsing binary components that are potentially testable with the observations in hand. Given that the primary is the most likely of the two stars in the eclipsing binary to be detectable spectroscopically, one of the quantities of interest is the velocity amplitude in its orbit, in km s-1,
| (4) |
which follows directly from the masses indicated by the isochrone (in units of the solar mass) and the known period in days.
Under the assumption that star 1 is rotating synchronously with the orbital motion (a reasonable assumption given that the period is short; see Hut, 1981), the projected rotational velocity in terms of the radius from the isochrone (expressed in units of R☉) is given, in km s-1, by
| (5) |
The relevance of this quantity here is that it can affect the broadening of the spectral lines of star 1, and can make it more difficult to detect, particularly if it is faint. Although strictly speaking the inclination angle in eq.(5) is that of the spin axis, it can be safely assumed to be the same as that of the orbit, or close to 90° for all practical purposes (Hut, 1981).
Since the brightness of each star can also be predicted from the isochrone, the light ratio between star 1 and star 3 (which is in principle directly observable) is simply
| (6) |
We have expressed it here in the visual band rather than in the band because the observational constraint we have on this ratio comes from our optical spectra, which are best matched to the band.
Given that a large fraction of all field stars are in multiple systems (e.g., Duquennoy & Mayor, 1991; Tokovinin, 1997; Tokovinin & Smekhov, 2002), it may be expected that in many cases the blend configuration will correspond to a physical triple system. In other blend situations the eclipsing binary could be in the background or foreground. For convenience in such cases we parameterize the relative distance between the binary and the third star in terms of the difference in the distance moduli, , so that (where is the distance to star 3). The different distances for the binary and star 3 introduce the need to account for differential extinction, which can have a significant effect. For a given combination of three stars it will change the amount of third light, , and also the predicted light ratio . Differential extinction (e.g., in magnitudes per kpc) is a strong function of the line of sight, and is essentially an unknown quantity because of the unknown distribution of absorbing material in the Galaxy. A representative value often mentioned in the literature is 1 mag kpc-1. However, the true value is likely to be very different in any direction one may choose, since dust appears to be highly patchy not only across the sky but also in the radial direction (particularly toward the Galactic center, where the OGLE fields are located). Nevertheless, we may adopt the prescription that the total extinction up to a certain distance (in pc) is given by , where is the coefficient of differential extinction in the visual band (in mag kpc-1). We also assume for simplicity that is the same for the eclipsing binary as for star 3. Extinction therefore adds two new unknowns to the problem: the distance to star 3, and the coefficient . The distance to the binary follows from the value of .
In order to solve for the new unknowns we make use of the constraint provided by the total apparent magnitude of OGLE-TR-33 (comprised of 3 stars) in the visual and also in the band: and (the latter is derived from the color in §3). We require that the brightness of the three stars (decreased by distance from the observer and by extinction) add up to the measured values in both passbands, thus accounting for differential reddening. The combined light in the visual band is
| (7) |
where the apparent magnitudes of the three stars are
| (8a) | |||||
| (8b) | |||||
| (8c) | |||||
Similar expressions hold for the total magnitude in the band, with a differential extinction coefficient . For we adopt the relation given by Cardelli, Clayton, & Mathis (1989), (assuming )777Udalski (2003) has recently reported evidence of anomalous extinction towards the Galactic center, which would imply a somewhat different value for as well as for . We do not consider these refinements essential here, as they do not significantly change the results.. To account for the effect of extinction in the contribution from third light and in the predicted light ratio , the absolute magnitudes in eq.(3) and eq.(6) are replaced with the apparent magnitudes given in eqs.(8) and their analogs for the band.
To summarize, the parameters to be adjusted in the most general case are the masses , , and , the age of the isochrone(s), , , , and . In practice the ages and some of the other parameters may be poorly constrained, depending on the quality of the light curve, and may need to be fixed. A value for can usually be adopted based on the spectral type or estimated effective temperature of the star.
We note, finally, that once a satisfactory fit to the light curve is achieved, the formalism above makes it straightforward to generate a curve based on the same physical parameters but for a different passband. While the photometric signature from true planetary transits should be independent of wavelength (except for minor effects due to limb darkening; see Tingley, 2004), the photometric signature of a blend is in many cases color-dependent (but not always; see below), and the predicted depth as a function of wavelength can be tested observationally.
5.2 Application to OGLE-TR-33
In our initial simulations for OGLE-TR-33 we assumed the three stars form a physical triple system. This is based on the similarity between the center-of-mass velocity of the binary and of that of the main star, which we infer from the pattern of the spectral line asymmetries (§4). An isochrone was selected so as to match our estimates of the properties of star 3, which we assumed to be an unevolved main-sequence star. On the basis of its effective temperature we adopted a mass of 1.3 M☉ (Cox, 2000), solar composition, and a representative age of 2 Gyr. The isochrone was chosen from the series of models by Girardi et al. (2000)888Our choice for this application was based on the wide range of ages available, and especially the fact that the isochrones reach down to very low masses of 0.15 M☉, although as indicated in footnote 6 the predicted properties of such low mass stars are not very realistic. Of particular importance for our purposes is the fact that the predicted radii for such stars have been shown to be underestimated by as much as 10–20% (Torres & Ribas, 2002; Ribas, 2003). In order to account for these discrepancies we have chosen to apply an ad-hoc correction to the theoretical radii for low-mass stars by careful comparison of these models with accurate determinations in the eclipsing systems CM Dra, CU Cnc, YY Gem, and V818 Tau (Metcalfe et al., 1996; Torres & Ribas, 2002; Ribas, 2003). These corrections are typically 1.1–1.2, depending on mass, and they have a modest effect on the depth of the eclipses.. Although we obtained a satisfactory fit to the OGLE light curve for a binary consisting of a mid to late F star with M☉ (quite similar to star 3) eclipsed by a late M star ( M☉), some of the predicted quantities from eqs.(4)–(6) conflicted with our spectroscopic observations. In particular, we predicted in the visual band, implying that we should see a second set of absorption lines in our Keck spectra nearly as strong as those of the main star. While blending and the natural broadening of the lines of the main star () and of star 1 (expected to have a similar rotation) could make this detection slightly more difficult, it would be rather unlikely to be missed, and additionally we would expect to see a flatter-peaked cross-correlation function than we obtain. The evidence described in the next section shows that the spectroscopic light ratio is in fact much smaller (), making this scenario untenable. No reasonable change in the age of the isochrone removed this discrepancy.
Relaxing the condition that the three stars are physically associated can also yield good fits to the light curve, for example if the eclipsing binary is allowed to be in the background so that it is fainter. One such solution is obtained for a binary system about 1 kpc behind star 3, consisting of a mid or late F star ( M☉) eclipsed by an M1 star ( M☉). The predicted light ratio in this case gives a more acceptable value of . However, the probability of a chance alignment such as this with a binary that happens to have a systemic velocity very close to that of star 3 (as implied by the changing asymmetries noted in §4) seems rather small.
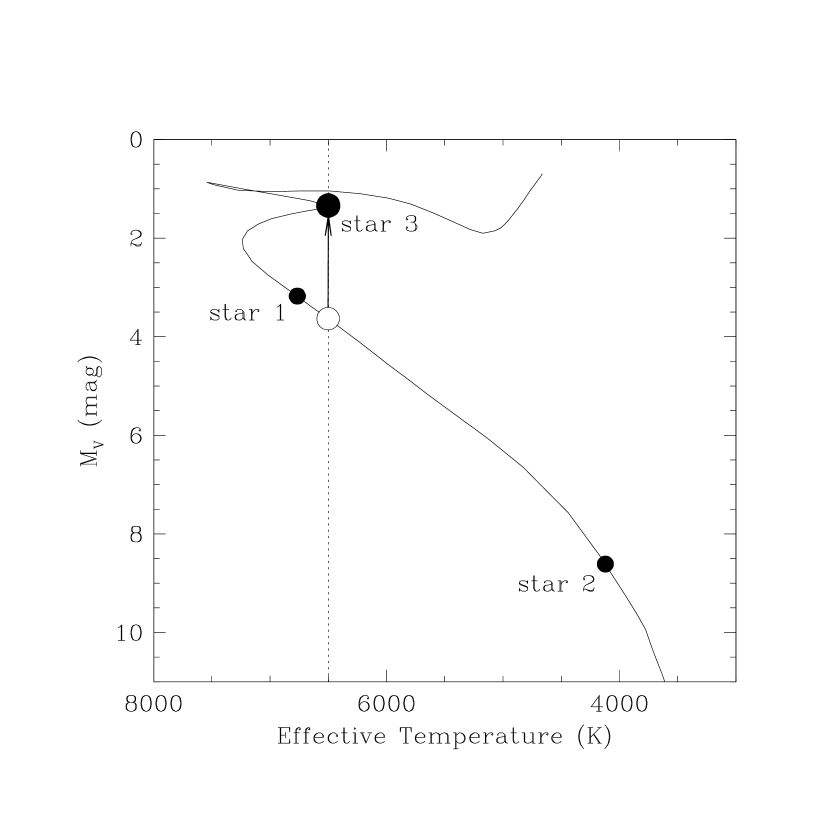
An alternate way of making the eclipsing binary significantly fainter than star 3, other than placing it in the background, is to make star 3 itself intrinsically brighter. The spectroscopic constraints from our Keck spectra only allow us to state that OGLE-TR-33 is not a giant star, but some degree of evolution is allowed by the data as long as the temperature remains close to what we estimate (6500 K). In particular, if star 3 is beyond the turnoff in the H-R diagram but still on the main sequence, near the end of the hydrogen-burning phase, it can be considerably brighter than an unevolved star with the same temperature. This situation is depicted in Figure 5, where the arrow shows that a difference in brightness of about 2 magnitudes is possible between an evolved and an unevolved F star for an isochrone corresponding to an age of (1.12 Gyr), or close to it. The evolved star is of course considerably more massive in this case (1.97 M☉ instead of 1.3 M☉, as we had assumed before), but it still has the same effective temperature.
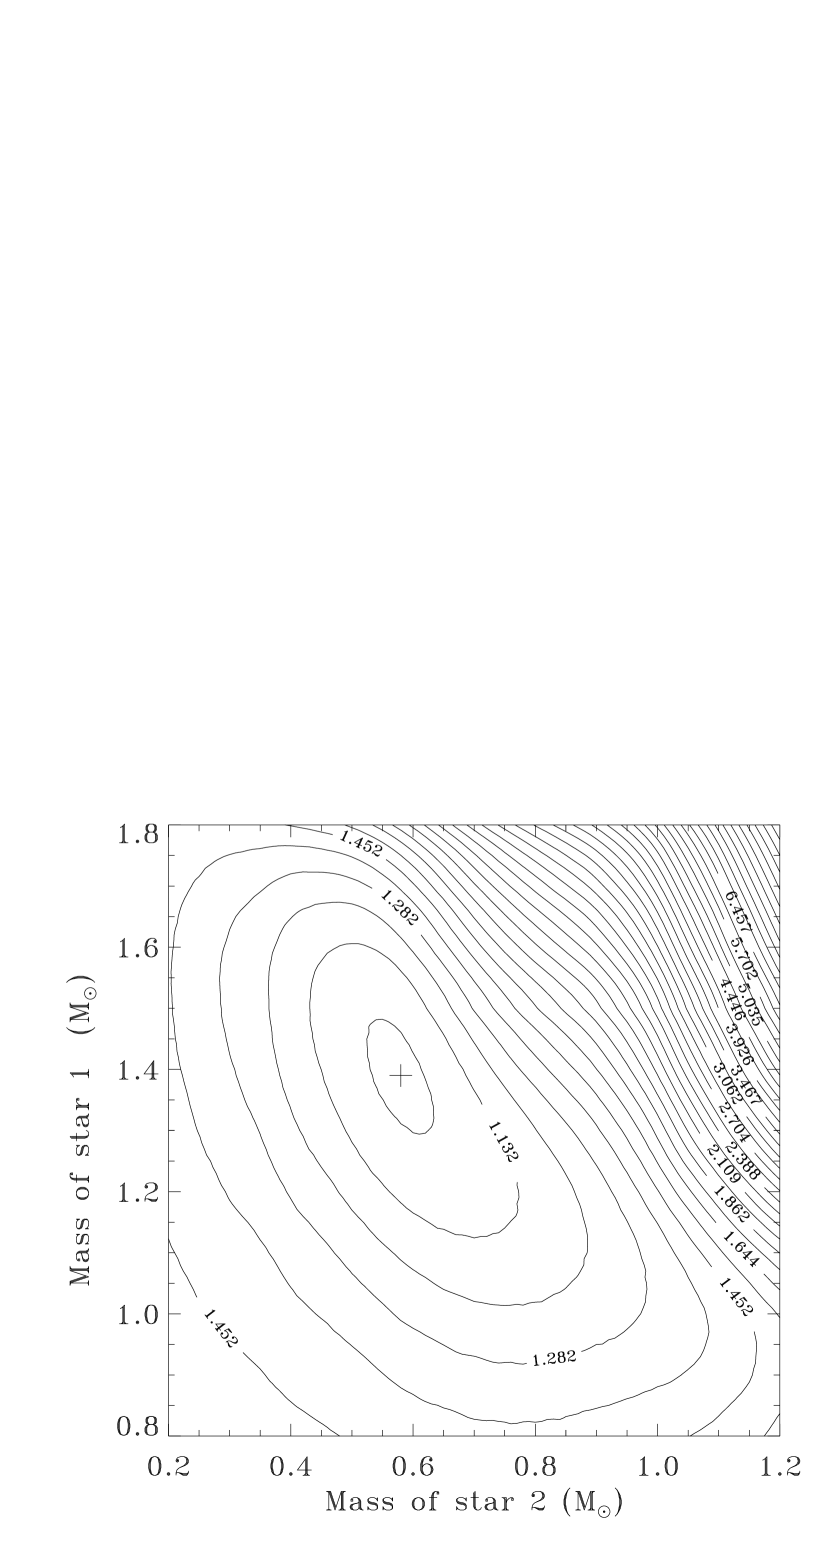
We repeated the fit to the light curve for an evolved star 3 using this isochrone, and we obtained a solution that is marginally better than before but gives a predicted light ratio in the visual band between star 1 and star 3 that is now much lower: . The surface as a function of the mass of star 1 and star 2 has a unique and well-defined minimum (see Figure 6), and the fit to the photometry is shown in Figure 7. We note that given the quality of the data this solution is just as satisfactory as the transit model fit in Figure 3, although the differences in shape are fairly obvious. The blend model predicts a very shallow secondary eclipse 0.003 mag deep, but it is undetectable with the present photometry. The resulting masses of the stars comprising the eclipsing binary are M☉ (spectral type approximately F4 V; Cox, 2000) and M☉ (K7-M0 V), and their locations on the isochrone are shown in Figure 5. Star 1 is slightly hotter than star 3, but fainter. The predicted velocity semi-amplitude and projected rotational velocity of star 1 are km s-1 and km s-1. The distance to the triple system is determined to be 3.5 kpc, and the differential extinction coefficient that fits the combined colors is mag kpc-1. Tests with a range of inclination angles indicated that the preferred value is in fact 90°. Other parameters of the fit are , , and . Star 3 contributes 85% of the light in the band.
The blend model also predicts that the eclipse depth in the band should be slightly larger than in , but by less than 0.003 mag, a difference that is probably too small to be detected with any confidence in future observations unless the measurement precision is significantly improved. The reason for this is the similarity between the colors of star 1 and star 3, both of which are F stars. Thus, in this particular case the color dependence of the eclipse depth would not be a useful diagnostic to rule out a planetary companion.
5.3 The lines of another star
The blend scenario in the preceding section has allowed us to make quantitative predictions about the primary of the eclipsing binary that can be tested with our data. We expect that if this star is visible in our spectra, it will be roughly 5 times fainter than the main star and its lines will move back and forth with semi-amplitude . Although our initial visual inspection of the spectra and cross-correlation functions did not reveal any obvious signs of double lines, in hindsight the asymmetries themselves are a clue to the presence of star 1. Given that the lines of the main star are significantly broadened by rotation ( km s-1), and that we expect the of star 1 to be about the same, the spectral lines of the two stars are likely to be heavily blended at all phases since the semi-amplitude is of the same order as the combined rotational broadening. In cases such as this traditional spectral analysis techniques are not very useful.
We re-examined our spectra using TODCOR (Zucker & Mazeh, 1994), a two-dimensional cross-correlation technique that has the ability to use a different template for each star in a composite spectrum. With TODCOR it is often possible to measure accurate velocities for both stars even when the lines are severely blended. For the main star we used the same synthetic template as before (§2), and for star 1 we generated a synthetic spectrum based on the parameters predicted by the blend model: K, , km s-1, and an assumed solar metallicity. The correlation functions for the individual echelle orders were combined together in a manner analogous to the technique introduced by Zucker et al. (2003). Due to the similarity in temperature between the two stars (corresponding approximately to spectral types F4 and F6) the light ratio was assumed to be constant with wavelength999Checks with low-resolution spectra of the appropriate temperatures indicate a change of only 10% in the flux ratio across the entire spectral window, a difference that is unimportant for our purposes..
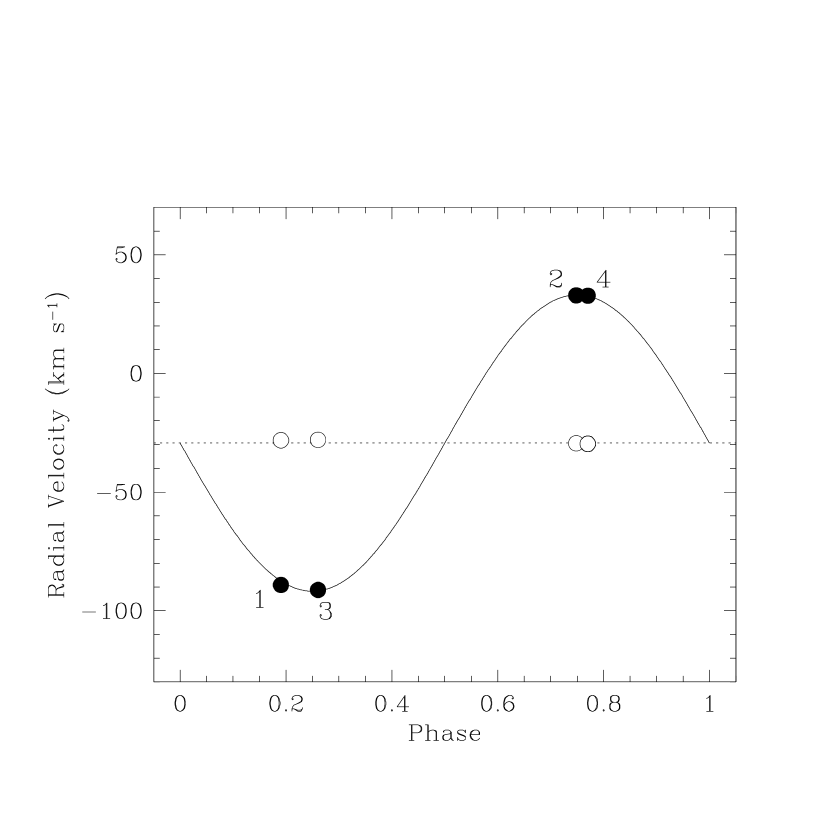
As illustrated in Figure 8 the lines of star 1 are indeed clearly present in our spectra. The top panel shows a contour plot of the two-dimensional cross-correlation surface, as a function of the velocities of star 1 and star 3. The maximum correlation is indicated by the dot, and lies along a steep ridge line that runs vertically through the diagram, which is produced by the large difference in brightness between the two stars. Cuts through this surface at fixed values for the velocities of each star are indicated by the dashed lines, and are shown in the lower two panels. The obvious peak in the lower panel is evidence that star 1 is clearly detected, and we were able to measure its velocity on all four of our spectra. The radial velocities we derive for both stars are given in Table 1. A spectroscopic orbital solution for star 1 from these velocities assuming a circular orbit and a fixed ephemeris from eq.(1) gives a semi-amplitude of 62 km s-1, which is very close to the predicted value of 63 km s-1. This orbit is shown in Figure 9. The spectroscopic light ratio (approximately in the visual band) measured with TODCOR is 0.15, also reasonably close to the prediction. The velocities for star 3, on the other hand, show much less variation than our original one-dimensional results from §4 (see also Figure 3). The rms residual from the mean is now 0.87 km s-1, compared to 2.03 km s-1 for the velocities shown in Figure 3. This is an indication that the use of TODCOR has effectively removed the distortions (asymmetries) that initially suggested a velocity variation. We note also that the weighted average of the new velocities for star 3, , is very close to the center-of-mass velocity of the orbit for star 1, which is . This is just as expected for a physical triple system.
Given the uncertainties and assumptions in the blend model, the agreement in the properties of star 1 and the overall consistency of the results is quite remarkable, and it is entirely possible that an even closer agreement could be reached by fine-tuning various parameters of the model, although we have not considered this necessary here.
6 Blending across the H-R diagram: a cautionary tale
The example of OGLE-TR-33 presents a warning about the kinds of blend scenarios that may be the most challenging to expose. As we showed in §5.2 the slightly evolved nature of the main star allows it to be significantly brighter intrinsically, and this in turn makes it easier to hide a fainter eclipsing binary in its glare that would typically be difficult to detect spectroscopically.
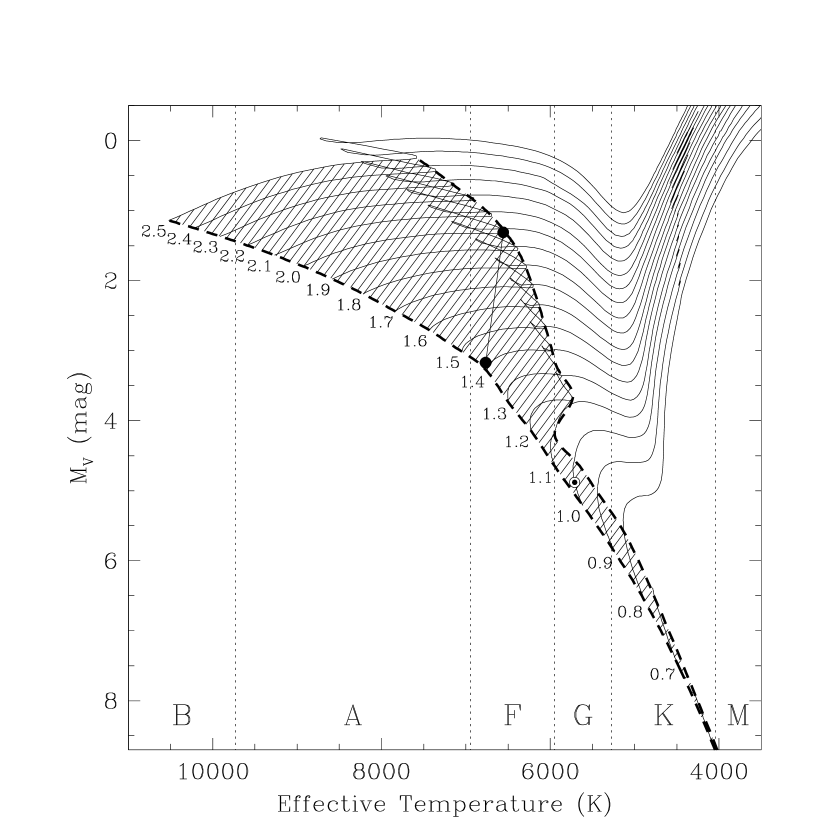
The situation is depicted more clearly in Figure 10, where we show evolutionary tracks for solar metallicity in a diagram of absolute visual magnitude as a function of effective temperature101010We have chosen for this illustration the models by Yi, Kim, & Demarque (2003) over those of Girardi et al. (2000), used earlier, merely for their higher resolution near the turnoff.. The heavy dashed lines indicate the Zero Age Main Sequence (ZAMS) on the left, and the red edge of the main sequence on the right, where stars have nearly exhausted their hydrogen fuel and are about to undergo the brief collapse phase that gives rise to the “blue hook” feature. The shaded area in between represents the full width of the main sequence band. For most stars of spectral type G and later (spectral type boundaries are indicated along the bottom of the figure) the vertical extent of this region is only half a magnitude or less. For hotter stars beginning at spectral type F, however, there is a significant widening of the main-sequence such that the vertical extent can exceed 2 magnitudes. It is precisely in this region of the H-R diagram that OGLE-TR-33 is located. Because stars here can evolve to be much brighter than unevolved stars of the same age, this leaves ample room for a fainter eclipsing binary along the same line of sight to go unnoticed. To make matters worse, F stars are typically very common in magnitude-limited samples such as OGLE-III, for the very same reason that they are brighter.
In blend cases in which star 1 and star 3 have very different effective temperatures (and colors) photometric follow-up in multiple passbands can be an efficient way to discover the false positive, since the transit depth will depend on wavelength (see, e.g., Kotredes et al., 2004). However, blends composed of stars of similar temperature will not show a significant color dependence, and once again OGLE-TR-33 is one such example. Based on the above we predict that blends with no significant color dependence to the eclipse depth may be more common than previously thought among F stars. Therefore, special care is required when investigating F stars with transit signatures, as the signs of the eclipsing binary may not be immediately obvious either in the photometry or the spectroscopy.
7 Concluding remarks
Transit searches for extrasolar planets have attracted a great deal of attention in recent years, driven by the excitement after the discovery of HD 209458, and more recently OGLE-TR-56, OGLE-TR-113, and OGLE-TR-132 (Konacki et al., 2003a; Bouchy et al., 2004; Konacki et al., 2004). Since no other examples as bright as HD 209458 () have been found to date, focus has quickly shifted to denser fields and fainter stars. As researchers involved in these searches have learned by now, candidates are relatively easy to find, but the large number of astrophysical false positives is a very serious issue particularly for these fainter targets. Blending is perhaps the most insidious of these effects, and is likely to be exacerbated in F stars because of the widening of the main sequence. The problem of finding true transiting planets around faint stars has essentially become one of ruling out that a given candidate can be anything else (“discovery by elimination”). Similar or perhaps more challenging difficulties will be faced by future space projects designed to search for even smaller planets, such as NASA’s Kepler mission.
In the preceding sections we have shown that the complete set of observations available for the transiting planet candidate OGLE-TR-33 can, in fact, be adequately explained as being the result of a fairly typical blend scenario, and therefore that the photometric signature that originally drew attention to it is very unlikely to be due to a planet crossing in front of the star. In this case the configuration is a hierarchical triple system with an age of 1 Gyr composed of an eclipsing binary (F4 V + K7-M0 V) and a slightly evolved and brighter F6 star that dilutes the light of the close pair. The self-consistent model we have constructed is able to account for all photometric and spectroscopic constraints, including the detailed morphology of the light curve (depth, duration, and shape), as well as the composite nature of the spectrum, the velocity amplitude of star 1, and its brightness relative to the main star.
Achieving this level of agreement is of course not normally the goal of follow-up observations of transit candidates. Rather, our motivation here has been to show how a detailed modeling of the light curve can provide important clues as to what other effects to look for in the data that might produce compelling evidence against the planet hypothesis.
The scenario found to reproduce the observations for this particular candidate is but one in an enormous variety of possible configurations involving an eclipsing binary and another star. Other such examples have been reported recently, e.g., by Charbonneau et al. (2004) from another search program. OGLE-TR-33 is especially interesting in that it serves to highlight how subtle the signs of a blend can be —in this case the relatively small variations in the profiles of the spectral lines. Had these variations been smaller (or our spectroscopic observations of lower quality) they might have been overlooked. The importance of careful follow-up cannot be overstated, and alternate explanations should always be examined. If a candidate with transit-like events of the right characteristics (shape, depth, duration) shows no other evidence of contamination from an eclipsing binary (spectroscopic or otherwise), can it still be a blend? This possibility must be thoroughly explored before a claim can be made with any confidence. Qualitative arguments or “back-of-the-envelope” calculations are generally insufficient, and we believe that analytical tools such as the one we have developed and applied in this paper can be extremely helpful to guide the investigation. In a forthcoming paper we will explore quantitatively the effects of blend scenarios on spectral line asymmetries and radial velocities measured by cross-correlation.
References
- Barlow (2002) Barlow, T. 2002, MAKEE Keck Observatory HIRES Data Reduction Software, see web page http://spider.ipac.caltech.edu/starf/tab/makee/
- Bouchy et al. (2004) Bouchy, F., Pont, F., Santos, N. C., Melo, C., Mayor, M., Queloz, D., & Udry, S. 2004, A&A, 421, L13
- Brown (2003) Brown, T. 2003, ApJ, 593, L125
- Butler et al. (2003) Butler, R. P., Marcy, G. W., Vogt, S. S., Fischer, D. A., Henry, G. W., Laughlin, G., & Wright, J. T. 2003, ApJ, 582, 455
- Cardelli, Clayton, & Mathis (1989) Cardelli, J. A., Clayton, G. C., & Mathis, J. S. 1989, ApJ, 345, 245
- Charbonneau et al. (2004) Charbonneau, D., Brown, T. M., Dunham, E. W., Latham, D. W., Looper, D. L., & Mandushev, G. 2004, in The Search for Other Worlds, eds. S. S. Holt & D. Deming (San Francisco: ASP), 151
- Charbonneau et al. (2000) Charbonneau, D., Brown, T. M., Latham, D. W., & Mayor, M. 2000, ApJ, 529, L45
- Charbonneau et al. (2002) Charbonneau, D., Brown, T. M., Noyes, R. W., & Gilliland, R. L. 2002, ApJ, 568, 377
- Claret (2000) Claret, A. 2000, A&A, 363, 1081
- Cox (2000) Cox, A. N. 2000, Allen’s Astrophysical Quantities, 4th edition (AIP Press, Springer: New York), p. 389
- Drake (2003) Drake, A. J. 2003, ApJ, 589, 1020
- Duquennoy & Mayor (1991) Duquennoy, A., & Mayor, M. 1991, A&A, 248, 485
- Etzel (1981) Etzel, P. B. 1981, in Photometric and Spectroscopic Binary Systems, eds. E. B. Carling and Z. Kopal (Dordrecht: Reidel), 111
- Girardi et al. (2000) Girardi, L., Bressan, A., Bertelli, G., & Chiosi, C. 2000, A&AS, 141, 371
- Gray (1992) Gray, D. F. 1992, The Observation and Analysis of Stellar Photospheres, 2nd Ed. (Cambridge: Cambridge Univ. Press), 417
- Henry et al. (2000) Henry, G. W., Marcy, G. W., Butler, R. P., & Vogt, S. S. 2000, ApJ, 529, L41
- Horne (2003) Horne, K. 2003, in Scientific Frontiers of research on Extrasolar Planets, eds. D. Deming and S. Seager (San Francisco: ASP), ASP Conf. Ser., 294, 361
- Hut (1981) Hut, P. 1981, A&A, 99, 126
- Kallrath & Milone (1999) Kallrath, J., & Milone, E. F. 1999, Eclipsing Binary Stars; Modeling and Analysis, (New York: Springer), 196
- Konacki et al. (2003a) Konacki, M., Torres, G., Jha, S., & Sasselov, D. D. 2003a, Nature, 421, 507
- Konacki et al. (2003b) Konacki, M., Torres, G., Sasselov, D. D., & Jha, S. 2003b, ApJ, 597, 1076
- Konacki et al. (2004) Konacki, M., Torres, G., Sasselov, D. D., Pietrzyński, G., Udalski, A., Jha, S., Ruiz, M. T., Gieren, W., & Minniti, D., 2004, ApJ, 609, L37
- Kotredes et al. (2004) Kotredes, L., Charbonneau, D., Looper, D. L., & O’Donovan, F. T. 2004, in The Search for Other Worlds, eds. S. S. Holt & D. Deming (San Francisco: ASP), 173
- Kurtz & Mink (1998) Kurtz, M. J., & Mink, D. J. 1998, PASP, 110, 934
- Kurucz (1993) Kurucz, R. L. 1993, ATLAS9 Stellar Atmosphere Programs and 2 km s-1 grid, CD-ROM No. 13 (Smithsonian Astrophysical Observatory, Cambridge, Massachusetts)
- Latham (2003) Latham, D. W. 2003, Scientific Frontiers in Research on Exrasolar Planets, ASP Conf. Ser. 294, eds. D. Deming & S. Seager (San Francisco: ASP), 409
- Mallén-Ornelas et al. (2003) Mallén-Ornelas, G., Seager, S., Yee, H. K. C., Minniti, D., Gladders, M. D., Mallén-Fullerton, G. M., & Brown, T. M. 2003, ApJ, 582, 1123
- Mandel & Agol (2002) Mandel, K., & Agol, E. 2002, ApJ, 580, L171
- Mazeh et al. (2000) Mazeh, T., Naef, D., Torres, G., Latham, D. W., Mayor, M., Beuzit, J.-L., Brown, T. M., Buchhave, L., Burnet, M., Carney, B. W., Charbonneau, D., Drukier, G. A., Laird, J. B., Pepe, F., Perrier, C., Queloz, D., Santos, N. C., Sivan, J.-P., Udry, S., & Zucker, S. 2000, ApJ, 532, L55
- Metcalfe et al. (1996) Metcalfe, T. S., Mathieu, R. D., Latham, D. W., Torres, G. 1996, ApJ, 456, 356
- Naef et al. (2004) Naef, D., Mayor, M., Beuzit, J. L., Perrier, C., Queloz, D., Sivan, J. P., & Udry, S. 2004, A&A, 414, 351
- Nelson & Davis (1972) Nelson, B., & Davis, W. 1972, ApJ, 174, 617
- Oppenheimer, Kulkarni, & Stauffer (2000) Oppenheimer, B. R., Kulkarni, S. R., & Stauffer, J. R. 2000, Protostars and Planets IV, eds. V. Mannings, A. P. Boss and S. S. Russell (Tucson: Univ. of Arizona Press), 1313
- Popper & Etzel (1981) Popper, D. M., & Etzel, P. B. 1981, AJ, 86, 102
- Queloz et al. (2001) Queloz, D., Henry, G. W., Sivan, J. P., Baliunas, S. L., Beuzit, J. L., Donahue, R. A., Mayor, M., Naef, D., Perrier, C., & Udry, S. 2001, A&A, 379, 279
- Ribas (2003) Ribas, I. 2003, A&A, 398, 239
- Sabbey et al. (1995) Sabbey, C. N., Sasselov, D. D., Fieldus, M. S., Lester, J. B., Venn, K. A., & Butler, R. P. Sabbey, C. N., Sasselov, D. D., Fieldus, M. S., Lester, J. B., Venn, K. A., & Butler, R. P. 1995, ApJ, 446, 250
- Santos et al. (2002) Santos, N. C., Mayor, M., Naef, D., Pepe, F., Queloz, D., Udry, S., Burnet, M., Clausen, J. V., Helt, B. E., Olsen, E. H., & Pritchard, J. D. 2002, A&A, 392, 215
- Schneider (2004) Schneider, J. 2004, The Extrasolar Planet Encyclopaedia, see web page http://www.obspm.fr/encycl/encycl.html
- Seager & Mallén-Ornelas (2003) Seager, S., & Mallén-Ornelas, G. 2003, ApJ, 585, 1038
- Sirko & Paczyński (2003) Sirko, E., & Paczyński, B. 2003, ApJ, 592, 1217
- Tingley (2004) Tingley, B. 2004, A&A, in press (astro-ph/0406201)
- Tinney et al. (2001) Tinney, C. G., Butler, R. P., Marcy, G. W., Jones, H. R. A., Penny, A. J., Vogt, S. S., Apps, K., & Henry, G. W. 2001, ApJ, 551, 507
- Tokovinin (1997) Tokovinin, A. A. 1997, Astron. Lett., 23, 727
- Tokovinin & Smekhov (2002) Tokovinin, A. A., & Smekhov, M. G. 2002, A&A, 382, 118
- Torres & Ribas (2002) Torres, G., & Ribas, I. 2002, ApJ, 567, 1140
- Torres et al. (2004) Torres, G., Konacki, M., Sasselov, D. D., & Jha, S. 2004, ApJ, in press (astro-ph/0310114)
- Udalski (2003) Udalski, A. 2003, ApJ, 590, 284
- Udalski et al. (2002a) Udalski, A., Paczyński, B., Żebruń, K., Szymański, M., Kubiak, M., Soszyński, I., Szewczyk, O., Wyrzykowski, Ł., & Pietrzyński, G. 2002a, Acta Astronomica, 52, 1
- Udalski et al. (2003) Udalski, A., Pietrzyński, G., Szymański, M., Kubiak, M., Żebruń, K., Soszyński, I., Szewczyk, O., & Wyrzykowski, Ł. 2003, Acta Astronomica, 53, 133
- Udalski et al. (2002c) Udalski, A., Szewczyk, O., Żebruń, K., Pietrzyński, G., Szymański, M., Kubiak, M., Soszyński, I., & Wyrzykowski, Ł. 2002c, Acta Astronomica, 52, 317
- Udalski et al. (1992) Udalski, A., Szymański, M., Kałuzny, J., Kubiak, M., & Mateo, M. 1992, Acta Astronomica, 42, 253
- Udalski et al. (2002b) Udalski, A., Żebruń, K., Szymański, M., Kubiak, M., Soszyński, I., Szewczyk, O., Wyrzykowski, Ł., & Pietrzyński, G. 2002b, Acta Astronomica, 52, 115
- Vidal-Madjar et al. (2003) Vidal-Madjar, A., Lecavelier des Etangs, A., Désert, J.-M., Ballester, G. E., Ferlet, R., Hébrard, G., & Mayor, M. 2003, Nature, 422, 143
- Vidal-Madjar et al. (2004) Vidal-Madjar, A., Désert, J.-M., Lecavelier des Etangs, A., Hébrard, G., Ballester, G. E., Ehrenreich, D., Ferlet, R., McConnell, J. C., Mayor, M., & Parkinson, C. D. 2004, ApJ, 604, L69
- Vogt et al. (1994) Vogt, S. S., Allen, S. L., Bigelow, B. C., Bresee, L., Brown, B., Cantrall, T., Conrad, A., Couture, M., Delaney, C., Epps, H. W., Hilyard, D., Hilyard, D. F., Horn, E., Jern, N., Kanto, D., Keane, M. J., Kibrick, R. I., Lewis, J. W., Osborne, J., Pardeilhan, G. H., Pfister, T., Ricketts, T., Robinson, L. B., Stover, R. J., Tucker, D., Ward, J., & Wei, M. Z. 1994, Proc. SPIE, 2198, 362
- Yee et al. (2002) Yee, H. K. C., Mallén-Ornelas, G., Seager, S., Gladders, M. D., Brown, T., Minniti, D., Ellison, S., & Mallén-Fullerton, G. 2002, in Astronomical Telescopes and Instrumentation, Proc. SPIE, 4834, 150
- Yi, Kim, & Demarque (2003) Yi, S. K., Kim, Y., & Demarque, P. 2003, ApJS, 144, 259
- Zucker & Mazeh (1994) Zucker, S., & Mazeh, T. 1994, ApJ, 420, 806
- Zucker et al. (2003) Zucker, S., Mazeh, T., Santos, N. C., Udry, S., & Mayor, M. 2003, A&A, 404, 775
| HJD | RV star 1 | RV star 3 |
|---|---|---|
| (2,400,000+) | () | () |
| 52480.8503 | 89.12 | 28.16 |
| 52481.9398 | 32.92 | 29.45 |
| 52482.9403 | 91.24 | 27.95 |
| 52483.9357 | 32.78 | 29.65 |