Unveiling the central parsec region of an AGN: the Circinus nucleus in the near infrared with the VLT
Abstract
VLT J- to M′-band adaptive optics observations of the Circinus Galaxy on parsec scales resolve a central bright Ks-band source with a FWHM size of 1.9 0.6 pc. This source is only visible at wavelengths longward of 1.6 m and coincides in position with the peak of the [Si VII] 2.48 m coronal line emission. With respect to the peak of the central optical emission, the source is shifted by 0.15″ (2.8 pc) to the south-east. Indeed, it defines the vertex of a fairly collimated beam which extends for 10 pc, and which is seen in both continuum light shortward of 1.6 m and in H line emission. The source also lies at the center of a 19 pc size [Si VII] ionization bicone.
Identifying this source as the nucleus of Circinus, its size is compatible with a putative parsec-scale torus. Its spectral energy distribution, characterized by a prominent narrow peak, is compatible with a dust temperature of 300 K. Hotter dust within a 1 pc radius of the center is not detected. The AGN luminosity required to heat this dust is in the range of X-ray luminosities that have been measured toward the central source. This in turn supports the existence of highly obscuring material, with column densities of cm-2, that must be located within 1 pc of the core.
1 Introduction
Circinus is the second closest AGN (4 Mpc, Freeman et al. 1977; pc ) after Centaurus A in the Southern Hemisphere. It is a SA(s)b galaxy inclined by with a Seyfert type 2 AGN at its center. Several dust lanes running north to south across the galaxy hide a large fraction of its eastern side. Probably for this reason, Circinus shows a one-sided cone of ionized gas which extends to the north-west in H and [OIII] images on kpc scales (Marconi et al. 1994), and in X-rays on smaller scales (Smith & Wilson 2001). The hard 1-100 keV X-ray spectrum indicates the presence of an obscured nucleus with N(H) cm-2 (Matt et al. 1999). The highest spatial resolution view of its central region comes from VLBI maps of H2O maser emission (Greenhill et al 2003). The H2O emission is interpreted in terms of a central edge-on Keplerian disk with inner and outer radii of 0.1 and 0.4 pc respectively, and outflowing material up to 1 pc from the center.
This paper presents near-to-diffraction limited images of the Circinus galaxy in the 1.2–5 m range observed with the adaptive optics assisted imaging-spectrograph NACO at the Very Large Telescope (VLT). Circinus was observed as part of the multi-resolution imaging program ZIDNAG (Zooming Into Dusty Nuclei of Active Galaxies) aimed at imaging the dusty tori in the closest AGN with both NACO and, subsequently, VLTI interferometric observations at 10 m and 2.2 m.
The physical scales associated with the spatial resolution of the Circinus images presented in this paper lie in the range 1.5–3 pc, and hence probe the presence and dimensions of obscuring material – the putative torus – around this type 2 AGN.
2 Observations and analysis
NACO images in broad J (1.3 m), Ks (2.2 m), L′ (3.8 m), and M′ (4.8 m) bands, and in narrow 2.42 and 2.48 m bands, were obtained with the UT4 unit telescope of the VLT in May 2003 (broad band) and March 2003 (narrow band). With the exception of the M′-band image, which was taken in chopping mode and has a reduced field of view of , all the images have a field of view of and a pixel scale of 0.027″ per pixel. The pixel scale fully samples the diffraction limit of the VLT in the Ks, L′, and M′ bands, but undersamples it at J. The wavelength of the narrow band image at 2.48 m is centered at the position of the coronal [Si VII] 2.48 m line; that at 2.42 m is an off-line image taken for continuum subtraction.
The optical wavefront sensor was used for all wavelengths. Final images were made after sky-subtracting, shifting, and co-adding a number of raw frames (about 30 in J and Ks; 170 and 90 in L′ and M′ respectively) taken at random dithered positions within a jitter box of about the central position of Circinus. The large number of raw frames and the size of the jitter width proved to be a robust procedure for generating reliable sky images from the science frames themselves without resorting to separate observations of the sky. Exposure times ranged from 3 min in J and Ks, and 5 min in L′, to 10 min in M′, and 20 min in the narrow band filters.
The resulting FWHM spatial resolutions were measured from several stars in the field of the science frames to be: in the J-band, in the Ks-band, at 2.42 m, and at 2.48 m. In the L′ and M′ bands, resolutions were derived from star images taken after the Circinus observations, being and respectively. The Strehl values achieved are difficult to asses as Circinus nucleus is extended, and the stars in the sience frame that could be used for that purpose are are inmersed in the galaxy light. Nevertheless, for orientative purposes, the Strehl measured in real time by the Adaptive Optic system are provided: 20% in J, 15% in Ks and between 40- 50% in the L- and M-band images.
For comparison purposes, WFPC2 broad-band 8140 Å (F814W, PC chip only) and H images, as well as NICMOS H-band (F160W) and 1.66 m narrow-band images were retrieved from the Hubble Space Telescope (HST) archive.
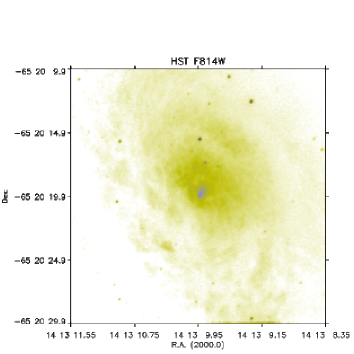
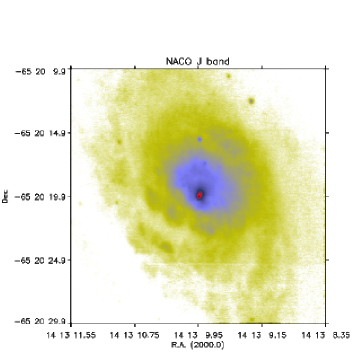
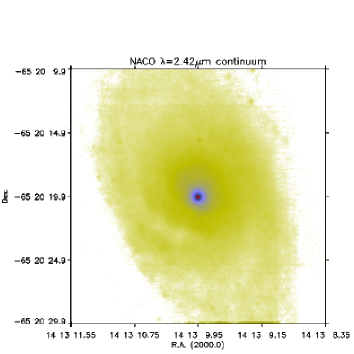
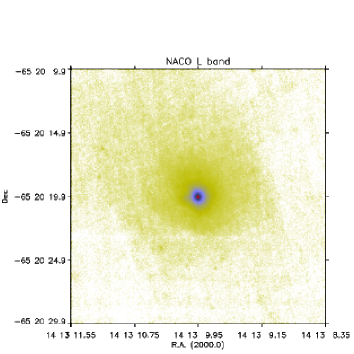
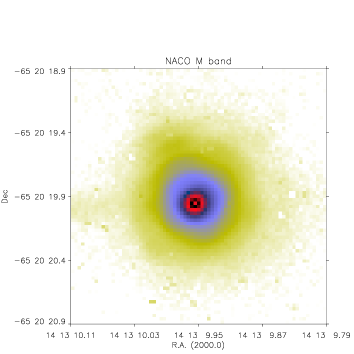
Fig. 1 presents a compilation of the most relevant images: from HST F814W to NACO M′-band, and [Si VII] 2.48 m “pure” line emission image. The H, Ks, and 2.48 m images resemble the 2.42 m image which already appears in Fig. 1 and so are not shown. The morphology of Circinus does not change at wavelengths shortward of 1.6 m. However, at longer wavelengths its eastern side, which is largely hidden by dust lanes in the F814W and J-band images, is progressively revealed. In the L′- and M′-bands, Circinus is reduced to a more compact region (total diameter ) with very faint (S/N3, 6 mag fainter than the peak) extended emission in L′. This is due to a combination of lower efficiency of the NACO camera and the natural decrease in stellar flux at these wavelengths.
3 Astrometry of the Infrared Central Source
Astrometric registration of the HST F814W and NACO images was achieved thanks to the presence of several stars common to all images. For this purpose, the F814W PC image, scale = 0.04” per pixel was rebinned to that of NACO. Based on the registration of 6–7 stars in the field, an accuracy better than pixel was reached between the F814W, J, Ks, 2.42 µm, and 2.48 µm images; and about pixels for the L′-band image, for which only one star was available. No registration was possible for the M′-band image.
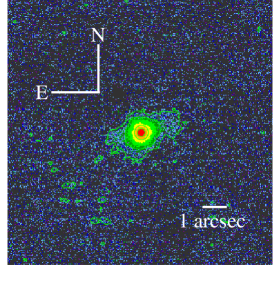
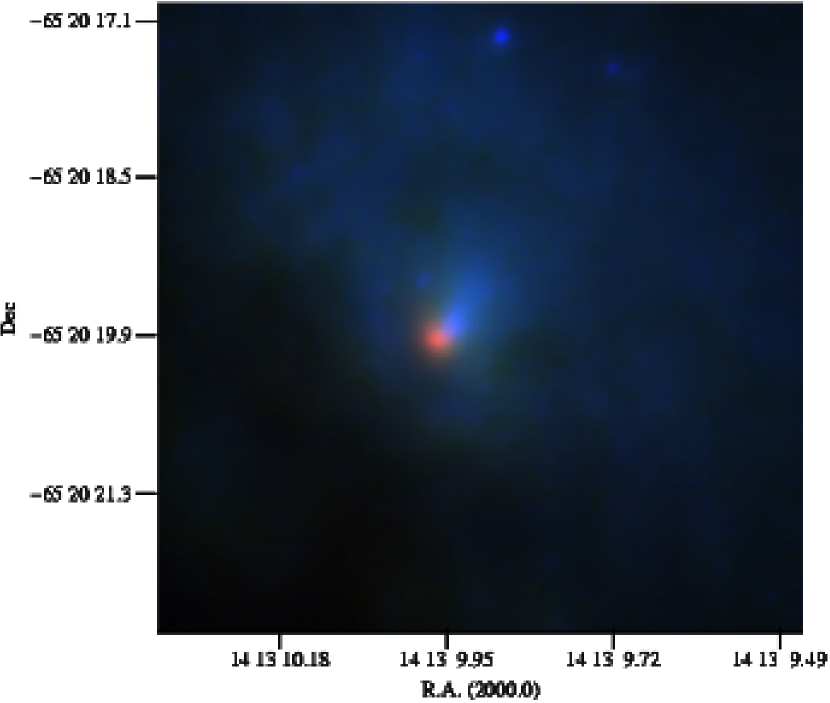
Following registration, it was found that the central peaks of the F814W and J-band image coincided spatially. Their position, however, is offset by (2.8 pc) north-west with respect to the central peak position found in all of the Ks, 2.42 µm, 2.48 m and L′images and also in the F160W image. The morphology of the central emission is very different in the two cases. The central emission in the F814W and J-band images appears diffuse and rather collimated over a distance of (10 pc) along the inner main axis of Circinus’ ionization cone (see the HST H image in Wilson et al. 2000). Close examination of the 1.66 m narrow-band “continuum” image shows a similar morphology although with less definition. On the other hand, the Ks, 2.42 µm 2.48 m and L′, images show a bright compact source just located at the (south east) apex of the collimated beam seen in the F814W and J-band images (Fig. 2).
The position of the infrared source also coincides with the peak emission of the (pure) [Si VII] 2.48 m coronal line. Furthermore, the [Si VII] 2.48 m exhibits an elongated structure – 19 pc radius – extended on both sides of the nucleus (Fig. 1). The direction of the extended emission is not exactly along the main axis of the ionization cone, but it is certainly within the cone boundaries as defined at its base, as apparent from a comparison of Figs. 1 and 3. Thus it appears that the [Si VII] 2.48 m emission, which is considerably less affected by extinction than H, unveils the counter-cone of Circinus. This result confirms the report of Maiolino et al. (2000) for counter-cone emission seen at rather low signal-to-noise in the [Si VI] 1.96 m line. Since [Si VII] 2.48 m probes Circinus’ ionizing continuum at energies of about 200 eV, and considering the symmetric morphology of the emisison, it is reasonable to conclude that the central peak of [Si VII] emission pinpoints the active nucleus in Circinus.
Appraising all the evidence above, it appears that the infrared central source detected at wavelengths longer than 1.6 µm qualifies as the true nucleus of Circinus. At this location there is no enhanced emission in the F814W or J-band images, indicating that this infrared central source is fully obscured at wavelengths m.
An attempt to establish the absolute astrometry of the infrared central source was performed on the HST F814W image (PC chip) with the USNO star catalog. Based on the HST F814W pointing alone, the position of NACO Ks-band central source is found to be (with the uncertainties given here derived solely from the relative astrometry of the two images). For the HST NICMOS F160W pointing, the position in right ascension is found the same but the declination is offset to the south by 0.44″. For several stars identified in the HST F814W image (it was not possible to locate any stars in the F160W image common to the USNO catalog), the difference between the coordinates from the HST data and those given in the USNO catalog were found to be smaller than the errors reported for the USNO stars themselves, which were typically 0.9″ on each axis. We therefore assign an uncertainty of 0.9″ to the absolute position derived using the HST F814W (PC chip) astrometry. We find thus that the position of Circinus IR source differs from the maser position derived from VLBI (Greenhill et al. 2003), which is (2000.0), by 12, that is an additional 03 beyond our assigned error. On the other hand, it is consistent with the 2MASS K-band position (quoted uncertainties are approximately 01). Thus, a clear negative shift in declination applies to all the above optical/infrared positions with respect to the VLBI one. This offset may be related to an intrinsic systematic shift between the radio and optical/infrared coordinate reference systems. But if it were real, it could indicate that the maser source does not actually pinpoint the nucleus but is instead part of the nuclear H2O outflow measured by Greenhill et al.
4 The Nature of the Infrared Central Source
The morphology of the infrared central source in Circinus is rather point-like at wavelengths longward of 1.6 µm; its FWHM, however, is larger than that of the stars measured in the same images. The size is best determined in the Ks-band and, after quadrature subtraction of the resolution beam, is found to have a FWHM ( pc). In the L′and M′ bands, the core sizes are (not deconvolved) FWHM and respectively.
In Table 1, the nuclear NACO fluxes in apertures of 019 radius are provided, an aperture chosen to be about twice the resolution achieved in the Ks-band. The core fluxes from the NICMOS H-band and ESO/TIMMI2 N-band data in apertures less than 1″ are also included. Fig. 4 (black squares) shows the corresponding infrared spectral energy distribution (SED) complemented by X-ray data from ROSAT (1 keV flux from Brinkmann et al. 1994) and BeppoSAX (the 10 KeV flux is derived from the absorption corrected nuclear luminosity, F erg s-1 from Matt et al. 1999), and by radio data at various wavelengths and in different apertures from the compilation of Contini et al. (1998). All the infrared measurements are associated with Circinus’ central infrared source except for the J-band, since the source is not detected shortwards of this wavelength. For consistency, the J-band value given is the integrated flux within an aperture of radius 019 measured at the position of the infrared source.
The radio data, although of low spatial resolution, is dominated by the Circinus nucleus (Elmouttie et al. 1995); the nuclear X-ray emission is resolved by Chandra into various point-like sources surrounding a bright source which is associated with the nucleus. These satellite sources have 2–10 keV unabsorbed luminosities in the range erg s-1 (Smith & Wilson 2001; no luminosity is provided for the nuclear source), from which we infer that the more than one order of magnitud flux by BeppoSAX originates mostly from the nuclear source.
The most prominent feature in the SED is a narrow peak at infrared wavelengths, indicative of dust emission in a narrow temperature range. This peak is well approximated by a simple modified black-body function with temperature of about 300 K (Fig. 4, continuous line) De-reddening for extinctions up to A (see below) does not really modify the dust temperature, mainly due to the steep shape of the infrared SED. Additional components of cooler dust may be present (this dust is not traced by the our data) but hotter dust is not detected: it is either not present or totally extincted. Some excess emission over the modified black-body is apparent at 2.2 m and below but that may be due to a combination of the underlying galaxy contribution and bremsstrahlung emission from cooling gas, both of which could still contribute to these small apertures. On the same Fig. 4, we show a model of the complete radio to X-ray SED using the SUMA code (Contini et al. 2004 and references therein). Briefly, this code considers the coupling effect of photoionization – from an external source, the AGN in this case – and shocks into an ensemble of clouds randomly distributed around the AGN and characterized by different physical conditions of shock velocities, pre-shock densities, preshock magnetic field, cloud geometrical thickness, and dust-to-gas ratios. As a preliminary result, we find the current nuclear SED to be characterized by shock-dominated clouds. The infrared to X-ray SED can be simultaneously fit by shock-dominated clouds with velocities km s-1 and downstream densities n cm-3. Both ranges of values are compatible with what one would expect at distances of few parsec radius from the center. Accordingly, the infrared bump is dominated by dust reradiation from clouds with those velocities while the X-ray to UV regime is dominated by bremsstrahlung. The radio is pure synchrotron radiation generated by the Fermi mechanism at the shock front. No radiation-dominated clouds appear in this model. Since they must exist, their absence is interpreted as an indication that heavy obscuration is occurring at distances of less than 1 pc from the nucleus. We note that the contribution from these high velocity clouds to the nebular spectrum is negligible, as found by Contini et al. (1998). These clouds are located very close to the center and at most will contribute to the production of coronal and HeII lines. Indeed, new high resolution spectra of optical and IR coronal lines of Circinus reveal line widths with V (Rodriguez-Ardila, Prieto & Viegas 2004) whereas the average nebular line width measured in this galaxy is only 100 . Independent evidence for the existence of high velocity clouds is provided by the maser outflow velocities of V measured at less than 0.1 pc from the center (Greenhill et al.)! Larger maser velocities may be present but a wider VLBI velocity baseline would be needed to probe them.
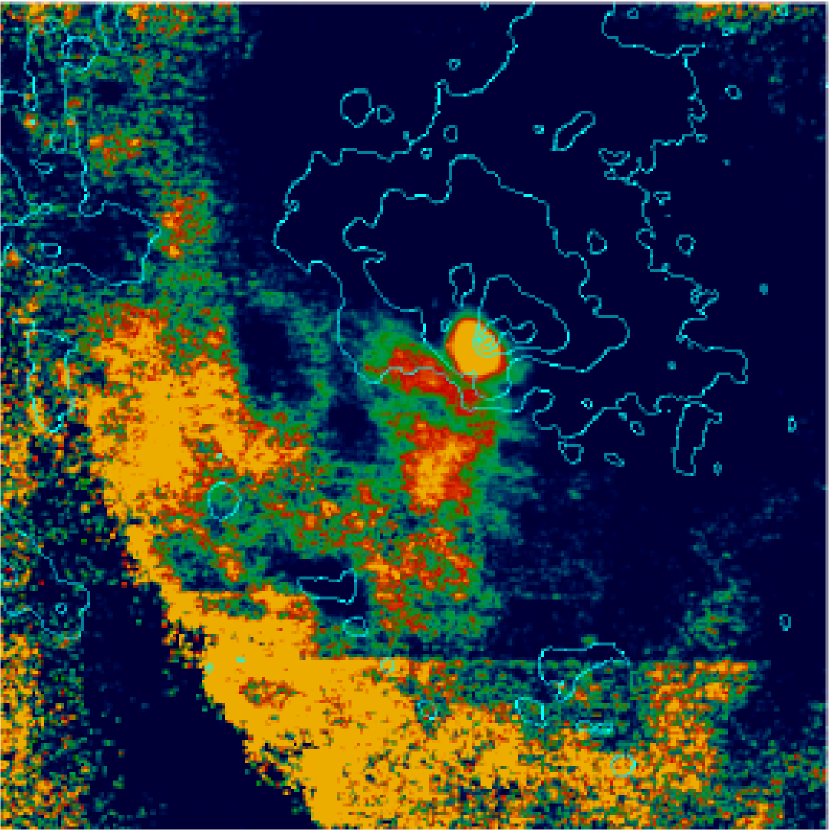
Beyond the nuclear region of Circinus, the effect of dust obscuration is best illustrated by the [J-2.42 m] color image (Fig. 3, a [J-Ks] color image shows exactly the same structure but the 2.42 m image is preferred as it includes continuum emission only). Fig. 3 shows a patchy distribution of bright and dark regions, with the brighter regions located mostly to the south-east side of the galaxy. These brighter regions correspond to stronger Ks-band emission, and spatially correlate with the darker zones seen, for example, in the F814W and J-band images (Fig. 1). Thus they most probably mark the location of cooler dust. Further comparison of the F814W and [J-2.42 m] images reveals that this cool dust follows well defined channels that seem to spiral down toward the center.
Comparison of the [J-2.42 m] colours at different points in the galaxy to average values in normal ellipticals (J-K=0.95, Giovanardi and Hunt, 1996) lead to extinction estimates in the range A–6 mag (for a foreground screen) or 6–20 mag (if the dust and stars are mixed), depending on position.
At the nucleus itself, the extinction is expected to be much higher considering the Compton thick nature of the source. Assuming a standard dust-to-gas ratio, a column density of cm-2 translates into an extinction of about 80 at 10 m, enough to dim any emission from the central source even in the infrared. Since we do in fact see a 2-pc infrared central source, this has to be subject to much less extinction. Considering its size and temperature, and assuming the emission is due to dust reprocessing of radiation from the AGN, the inferred UV luminosity to heat this source is erg s-1. This is within the range of nuclear X-ray luminosities, L– erg s-1, measured from the X-ray spectrum after correction for absorbing columns of cm-2. Thus, the infrared central source in Circinus provides independent support for the Compton thick nature of its core; it also indicates that any highly obscuring material should be located at distances less than 1 pc from the core.
We note that the SUMA modeling of the complete SED leads to a different interpretation for the origin of the infrared bump. In this case, the infrared bump is due to dust heated primarily by shocks, whereas we found above that the heating of the infrared central source is compatible with direct illumination by the AGN. While both possibilities are plausible, the current SED model is poorly constrained since it relies on insufficient information from other spectral ranges, particularly the millimeter range. For an accurate modeling to be accomplished, further X-ray, far-infrared and millimeter data with resolutions on scales of a few parsecs are needed.
5 Conclusion
The central source of Circinus at infrared wavelengths is resolved in the Ks-band as a bright compact region with size pc (FWHM). This source is only visible at wavelengths longward of 1.6 m, and it is offset by 0.15″ to the south-east of the brightest central emission seen in the J-band and HST optical images. The source is indeed located at the vertex of a rather collimated beam ( pc long) apparent at wavelengths shortward of 1.6 m. The direction and position of this collimated beam coincides precisely with the main axis of Circinus’ H ionization cone. No collimation is seen at wavelengths beyond the K-band. As scattering is more effective at shorter wavelengths, the observed feature may be nuclear light scattered by the compact dusty structure in which the Circinus nucleus seems to reside.
The source also coincides with the peak of the [Si VII] 2.48 m line emission; and with the center of a 19 pc extended [Si VII] bicone of ionized gas. On the basis of the arguments above, the infrared source that has been detected can be associated with the nucleus of Circinus.
The astrometric position of the infrared source differs by at least 03 in declination from the VLBI maser position. While this may be due to a systematic difference between the radio and optical/infrared reference frames, an alternative possibility is that the maser source is not related to the nucleus but instead to the outflowing material traced by the VLBI data.
The size of the infrared central source is compatible with a putative parsec-scale torus. Its SED can be fully accounted for by dust at about 300 K, and the required AGN luminosity to heat such dust at a distance of 1 pc from the core is in the range of luminosities derived from X-ray data. This energy balance implicitly supports the presence of column densities as high as cm-2 at the nucleus. The absorbing material has to be located at distances within 1 pc of the core and be rather inhomogeneously distributed in order that the dust at 300 K can have a direct view of the AGN. Hotter dust is not detected at distance scales of 2 pc: it is either not present or is heavily extincted. Additional cooler gas may certainly be present, probably distributed at slightly larger radial scales. This cold dust is not sampled by our data, but interferometric data at millimeter wavelengths should in the future probe this regime.
Within a 200 pc radius of the central source in Circinus, the extinction derived from color maps is inhomogeneous, with A–6 depending on position. Close to the central source, higher extinctions of A (for a foreground screen) or A (if the dust and stars are mixed) are found.
References
- (1) Rodriguez-Ardila, Prieto & Viegas 2004, in “The Interplay among Black Holes,Stars and ISM in Galactic Nuclei, Proceedings IAU Symposium No. 222 in press.
- (2) Brinkmann, W., Sibert, J & Boller, Th. 1994, A&A 281, 355
- Contini, Viegas & Prieto (2003) Contini, M, Viegas, S.M. & Prieto, M.A. 2004, MNRAS 348, 1065
- (4) Contini, M, Viegas, S.M. & Prieto, M.A. 1998, ApJ 505, 621
- (5) Elmouttie, M., Haynes, R., Jones, K., Ehle, M., Beck, R. & Wielebinski, R. 1995, MNRAS 275, L53
- (6) Freeman, K.C., Karlsson, B., Linga, G., Burrell, J. F., van Woerden, H. & Goss W. M. 1977, A&A 55, 445
- (7) Giovanardi, C., Hunt, L. K. 1996, AJ, 111, 1086
- Greenhill et al. (2003) Greenhill et al. 2003, ApJ 582, L11
- (9) Heijligers, H., 2003, private communication
- (10) Quillen, A. et al. 2001, ApJ 547, 129
- (11) Maiolino, R., ALonso-Herrero, A., Andres, S., Quillen, A., Rieke, M., Rieke, G. H., Tacconi-Garman, L. 2000, ApJ 531, 219
- Marconi et al. (1994) Marconi, A. et al. 1994, Messenger 78, 20
- Matt et al. (1999) Matt, G., et al. 1999, A&A 341, L39
- (14) Smith, D.A., Wilson, A.S. 2001, ApJ, 557, 180
- Wilson et al. (2000) Wilson, A. S., Shopbell, P. L., Simpson, C., Storchi-Bergmann, T., Barbosa, F. K. B., & Ward, M. J. 2000, ApJ, 120, 1325
| Band | Magnitude | Flux/mJy | Aperture Diameter |
|---|---|---|---|
| J | 15 | 1.6 | 038 |
| H | 13.4 | 4.77 | 01 |
| K | 11.4 | 19 | 038 |
| 2.42 m | 10.56 | 31 | 038 |
| L | 7.1 | 380 | 038 |
| M | 4.8 | 1900 | 038 |
| N | 9700 | 1″ | |
| 2.48 µm | erg cm-2 s-1 | 29 |