Abstract
In recent years it became clear that a population of galaxies radiating most of their power in the far-infrared contribute an important part of the whole star formation activity in the universe. These galaxies emit up to 99% of their energy output in the infrared by dust. The optical properties of dust in galaxies are thus very important to understand this population. Mayo Greenberg who has brought many of the ideas underlying our understanding of the physics of interstellar dust has been a pioneer in predicting the important role of organic solid material formed on dust grains in molecular clouds and of potential importance of transient heating of very small particles. It appeared with the ISO data on galaxies and even more today with the first Spitzer data that these mechanisms are important globally for the observations of infrared galaxies at significant redshifts. The understanding of their evolution is one of the keys to the understanding of galaxy built up and evolution.
keywords:
infrared galaxies, cosmic background, galaxy formation[Greenberg lecture]
The cosmic background:
Evolution of infrared galaxies and dust properties.
A lecture dedicated to the memory of Mayo Greenberg
1 Ultra Luminous Infrared Galaxies
A fraction of the stellar radiation produced in galaxies is absorbed by dust and re-radiated in the mid and far-infrared. In our Galaxy, this concerns only about a third of the total luminosity, much less in elliptical galaxies. The effect of the ”dust mask” has been identified for a long time as an obvious nuisance for optical observations and implies a ”correction” to account for the total energy output of galaxies. Now that galaxies have been found for which most of the radiation is coming out at long wavelengths, the infrared part of the spectrum cannot be treated as a ”correction” to optical observations. Although a few very luminous galaxies were observed in the seventies, it is really with the IRAS survey that a proper census of the infrared emission of galaxies at low redshift was properly carried out. The luminosity function at 60 and 100 is dominated by spiral galaxies as could be expected, but a high luminosity power law tail of luminous galaxies was found. This population, although not dominant, was carrying a substantial of the infrared energy production in the local universe which was only one third of the optical one. It was also found that these luminous galaxies were often associated with interacting of merging galaxies. Some were clearly starbursts and others AGNs.
With ISO, the sensitivity allowed to investigate the more distant universe up to a redshift of about one and to investigate through spectroscopic studies whether AGN activity or starburst activity was powering Ultra Luminous InfraRed Galaxies (ULIRG).
The simplest expectation on the one hand was that heavy elements, and thus dust, should have decreasing abundances when going to high redshifts and thus the ratio of infrared to optical should decrease.The association with mergers, on the other hand, could mean an increase of the fraction of infrared galaxies in the past due to the higher number density.
We’ll refer to ”infrared galaxies” and to ”optical galaxies” for short to mean galaxies in which the infrared emission, respectively optical, emission dominates. The two populations are rather well separated (not necessarily meaning that one galaxy does not go from one class to the other).
2 Properties of interstellar dust and the spectral energy distribution of infrared galaxies
For a population where most of the stellar radiation is absorbed and re-radiated by dust, dust properties and the physics of the absorption and emission are essential as they determine the Spectral Energy Distribution (SED) of the galaxy.
Interstellar dust is the topic to which Mayo Greenberg brought a major contribution. In fact he was really visionary on some topics of the interstellar dust physics. Dust grains which contribute most of the optical extinction must have a size between 0.01 and 0.1 to account for the fact that the albedo drops significantly for wavelengths larger than about 1 . Considering the energy density of the radiation in a galactic disc like ours, the temperature of a dust grain is rather low: 15 to 25 K. The emission is peaked at typically 100 : the wavelength of the emitted radiation is much larger than the grain size when the absorbed radiation has a wavelength comparable to the grain size. This has an important consequence. The emissivity in the far-infrared will decrease roughly like the square of the wavelength which in turn makes the temperature dependence on the radiation energy density very weak (). For a galaxy like ours the infrared part of the SED peaks at 170 when for a ULIRG it will peak around 60 : a factor in temperature for a factor in energy density or luminosity. At long wavelengths in the submillimeter and millimeter, the intensity should decrease like . At wavelengths shorter than this peak the exponential cut off of the Planck function leaves little power emitted in the mid infrared (5 to 25 ), except in regions very close to stars which should carry only a very small fraction of the integrated luminosity of a galaxy.
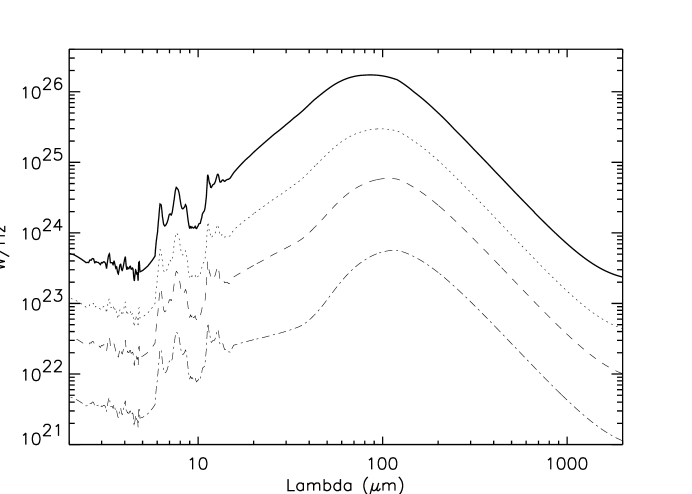
The emission spectrum of diffuse cirrus clouds only heated by the diffuse interstellar radiation field is shown in figure 1 ([Boulanger et al., 2000]). The peak emission and the long wavelength behaviour fit with expectations. On the other hand about one third of the power is concentrated in the region 5 to 50 far more than what is expected from the modified black body at the equilibrium temperature; this emission contains a set of prominent features between 5 and 18 . ISO has shown that many infrared galaxies were showing this behaviour in their integrated spectra.
Mayo Greenberg ([Greenberg, 1976]) proposed a new mode of emission for interstellar dust grains when they are small enough. The idea of very small interstellar dust grains has been proposed by Platt ([Platt, 1956]) earlier but the emission was not discussed at that time. Mayo made the point that the heat capacity could be small enough and the probability to absorb a photon small enough that the dust grain could be transiently heated to high temperature and radiate before absorbing the next photon. This mechanism was invoked by K. Sellgren ([Sellgren, 1983]) to explain reflection nebulae observations and [Léger & Puget, 1984] proposed that large Polycyclic Hydrocarbons (PAHs) molecules could be responsible for the so called ”unidentified infrared bands”. [Puget et al., 1985] proposed that this could also explain the mid infrared emission of the Galactic disc and predicted the cirrus emission now observed.
Mayo Greenberg made another related far reaching prediction: the
grains in dense molecular clouds opaque to optical radiation are very
cold (5 to 10 K). Molecules can condense on these grains in ice
mantles in which chemistry induced by cosmic rays and UV radiation
when the grains reach the surface of the cloud produces larger
molecules and ultimately organic solid material. Experiments in Mayo’s
laboratory demonstrated this mechanism and showed the famous ”yellow
stuff” residue. We know today that the PAHs are very underabundant in
dense clouds but are overabundant with respect to the diffuse medium
of the surfaces of molecular clouds to disappear again in HII
regions. This is very likely to be the sign of the physics described
by Mayo Greenberg. The organic material seen in absorption at 3.4 (aliphatic hydrocarbons, [Willner et al., 1979]) is seen in emission at
3.28 (aromatic hydrocarbons) at the surface of clouds and it
has been shown that aliphatic hydrocarbons transform into aromatic
ones when heated at high enough temperature. We are thus probably
watching directly the mantle evaporation and transformation of the
yellow stuff predicted by Mayo into free large PAH molecules
([Greenberg et al., 1972]).
The SED of infrared galaxies has thus important properties for the
observations of redshifted ones:
-
•
The long wavelength spectrum is very steep ()
-
•
A substantial fraction of the energy comes out in a set of features between 5 and 9
-
•
The SED peaks near 100 leading to ”negative K-corrections” in the submillimeter
-
•
The main PAH feature leads to ”negative K-corrections” in the 10 to 30 range
The “negative K-corrections” makes redshifted infrared galaxies easier to observe. This effect is particularly strong at long wavelengths: at 1 mm the flux of a ULIRG radiating L⊙ is seen as a source with a constant flux of 1 mJy for !
3 The Cosmic Infrared Background (CIB)
The CIB is the energy content of the universe today produced by galaxies at all redshifts and seen as an isotropic extragalactic background radiation. It was predicted by Patridge and Peebles (1967) that observations of such a background gives a powerful tool to constrain cosmological evolution especially if you observe at wavelengths larger than a maximum of emission. [Partridge & Peebles, 1967] made that point for the near infrared beyond the peak of the stellar emission of galaxies ( ).
The detection of the CIB was the major objective of the DIRBE experiment aboard COBE. In fact it was by using the FIRAS spectrometer data that the CIB was first detected at long wavelengths: ([Puget et al., 1996]). The CIB has also been detected by DIRBE at 2.4, 3.5, 100, 140, 240 (see [Hauser & Dwek, 2001] for a review). The Cosmic background is also measured in the optical ([Berstein et al., 2002]). In the mid infrared the interplanetary zodiacal dust emission is so strong that only upper limits were obtained by DIRBE. The combination of number counts by ISOCAM at 15 (see [Cesarsky & Elbaz, 2003]) and by Spitzer at 24 ([Papovich et al., 2004]) with the observations of TeV gamma ray emission from distant AGNs gives a good measurement of the background at these wavelengths. The full cosmic background spectrum is shown in figure 2 (from [Gispert et al., 2000]).
The optical and infrared cosmic backgrounds are well separated and the first surprising result is that the power in the infrared part is equal or larger than the power in the optical one although we know that locally, the infrared output of galaxies is only one third of the optical. This implies a much stronger evolution of the infrared luminosity of infrared galaxies than of optical ones.
A second important property to note is that the slope of the long wavelength part of the CIB: is much less steep than the long wavelengths spectrum of galaxies. This implies that the millimeter CIB is not due to the millimeter emission of the galaxies making the bulk of the emission at the peak of the CIB ().The millimeter part of the CIB must thus be dominated by galaxies at rather high redshift for which the SED peak has been shifted to the sub-millimeter. The millimeter CIB contains information on the total energy output by these galaxies and about their spatial distribution which cannot be reached by observation of individual galaxies before very deep and large surveys are available at these wavelength which probably requires ALMA. The implications in terms of energy output have been drawn by [Gispert et al., 2000]. The infrared production rate per comoving unit volume (1) evolves faster between redshift zero and 1 than the optical one and (2) has to stay constant at higher redshifts up to redshift 3 at least.
4 The luminosity function of infrared galaxies and its evolution
The first deep ISOCAM surveys in the Hubble Deep Field brought spectacular results (see [Cesarsky & Elbaz, 2003] for a review):
-
•
A rather small density of sources detected at 15 had an average brightness which was about 20% of the optical brightness of the galaxies detected by the Hubble Space Telescope
-
•
These infrared galaxies were filling more than half of the CIB at this wavelength when compared to the upper limits coming from the TeV Gamma rays
-
•
Most of these sources were not associated with nearby galaxies
-
•
The redshift distribution showed that they are concentrated in the redshift range 0.5 to 1 with a maximum at 0.8
-
•
These sources are high luminosity sources with high infrared to optical ratio. The average luminosity was L⊙.
This showed that the infrared output at redshift 0.8 is not dominated by the infrared part of the SED of the galaxies making the bulk of the optical output energy but by a small subclass in number of high luminosity infrared galaxies. These were similar to the local starburst galaxies detected by IRAS but they dominate the total output. The luminosity function is dominated by galaxies 30 times more luminous than the optical galaxies. The peak in the redshift distribution results from the combination of two factors: the strong evolution in numbers of these galaxies and the negative K-correction due to the block of PAH features centered around 8 which peaks at redshift 0.8 for the 15 bandpass. The most luminous infrared galaxies and in some cases the anisotropies of the cosmic background were also detected by ISO at 170 , SCUBA at 850 and IRAM at 1.3 mm. [Lagache et al., 2003] showed that combining (1) the number counts for the brightest sources and (2) the CIB spectrum and its anisotropies, constrains strongly the typical SED of infrared galaxies, the luminosity function and its evolution with redshift. Figure 3 shows the typical SED and figure 4 the luminosity function as a function of redshift. It has a number of implications:
-
•
The infrared output energy is dominated by galaxies of luminosity increasing with redshift from L⊙ locally to L⊙ at z=1 and L⊙ at redshift larger (2 to 3).
-
•
The infrared galaxies are dominated by galaxies with a starburst type SED.
This last conclusion agrees with the spectroscopic studies done with ISO by eg. the Garching group who concluded that only 15% of the luminosity is due to AGN activity.
Very recently the first results from the Spitzer observatory brought already very interesting new elements on this question although much more is to be expected in the coming years. One observational aspect already mentioned above is the negative K-correction due to the PAH features. It was predicted by [Lagache et al., 2003] that, if infrared galaxies keep a similar SED as the one they have up to redshift 1 up to redshift 2.5 the counts in the 24 Spitzer-MIPS band will be affected in a similar way as the 15 ISOCAM counts had been. The critical redshift range in which the main PAH block of features is redshifted in the 24 band is . If the galaxies dominating the luminosity function are, as predicted, ultraluminous ones with L⊙ this should lead to a maximum in the log N-logS plot (normalized to the Euclidean one) below 1 mJy. The observations from Papovich, show clearly a maximum at about 300 Jy. Figure 4 (from [Lagache et al., 2004]) shows how galaxies in different redshift bands contribute to the counts. The role of the galaxies with redshift around 2 is clear. This is an indirect indication that the SED has not changed very much between redshift 1 and 2. This needs to be confirmed by statistical spectroscopic studies sampling properly the dominant part of the luminosity function.
5 Open questions
If the presence of strong PAH features is confirmed in the typical spectra of infrared galaxies at redshift beyond 2 which dominate the energy output at this time, it will shed new light on the chemical evolution in galaxies and the early production of large amounts of organic molecules in the universe.
The other open question which is reinforced by the recent Spitzer results is related to the luminosity function of infrared galaxies. When going to larger redshifts the evidence is growing that the luminosity function is dominated by more luminous galaxies. As infrared galaxies dominate the energy output at these redshifts, this shows that the bulk of the star formation takes place in high luminosity objects. It is unlikely that such large luminosities could be associated with low mass galaxies. In fact the ISOCAM galaxies had been showed to be massive ones ([Cesarsky & Elbaz, 2003]).
In the standard model of structure and galaxy formation, dwarf
galaxies are the first ones to collapse at high z and the mass
function of collapsed objects is dominated by low mass galaxies with
an evolution where the mass function is dominated more and more by
massive galaxies as the universe expands. This opposite evolution of
the mass function and of the luminosity function and of the existence
of a class of galaxies with rather small number density contributing
the largest fraction of the energy output has strong implications.
The star formation history in galaxies has probably three parts:
-
•
Typically 40% of the radiation comes from galaxies following a smooth evolution with the energy output mainly in the optical and near IR,
-
•
The second one is the starbust component concentrated in a small fraction of the lifetime during which the luminosity is 10 to 100 times larger and the output is mostly in the infrared.
-
•
The third component is the one associated with the AGN activity which is probably also dominant only during limited periods but carries only 10 to 20% of the total radiated energy.
This picture is mostly constrained by what we now know on the cosmic background from galaxies and the identification of its dominant components.
Infrared galaxies are absent from the largest collapsed structures at present (galaxy clusters) thus are anti-biased with respect to the dark matter. They are often associated with mergers and if merging is a dominant mechanism for galaxy construction, the evolution with time of infrared galaxies is probably the best tracer we have of this activity. It is likely that at redshifts larger than 1, infrared galaxies show a strongly biased distribution with respect to the dark matter when structures and massive galaxies are just forming as merger rate should go as the square of the local density.
All of this needs to be investigated by studying the evolution of the luminosity function and the statistical properties of the spatial distribution of infrared galaxies. Spitzer will be great for such studies but will be strongly limited by confusion for redshift beyond 2-2.5. The study of the structure of the CIB is the tool to study the spatial distribution of infrared galaxies at larger redshifts with Planck and Herschel. The ALMA surveys will be needed to get the final answer to these questions.
1
References
- [Berstein et al., 2002] Bernstein R.A. ,Freedman W.L., Madore B.F., 2002, Ap.J. 571, 56
- [Boulanger et al., 2000] Boulanger F., et al, 2000, ESA-SP 455, 91
- [Cesarsky & Elbaz, 2003] Cesarsky C. and Elbaz D., 2003, Science 300, 270
- [Genzel & Cesarsky, 2000] Genzel R. and Cesarsky C., 2000, Ann. Rev. Astron. Astrophys. 38, 761
- [Gispert et al., 2000] Gispert R., Lagache G., Puget J. L., 2000, A&A 360, 1
- [Greenberg, 1976] Greenberg J.M., 1976, in Far Inrared astronomy, Oxford, Pergamon PressLtd, p299
- [Greenberg et al., 1972] Greenberg J.M., et al., 1972, Mem. Soc. Roy. Sci. Liège, 6e série, tomme III, 425.
- [Hauser & Dwek, 2001] Hauser M., and Dwek E., 2001 Ann. Rev. Astron. Astrophys. 37, 249
- [Lagache et al., 2003] Lagache, G., Dole, H., and Puget, J.-L.2003, MNRAS 338, 551
- [Lagache et al., 2004] Lagache G. , Dole H., Puget J.L. et al, 2004, Ap. J. Sup. in press
- [Léger & Puget, 1984] Léger A. and Puget J.L., 1984, A&A 137, L5
- [Li & Greenberg, 2003] Li, A. and Greenberg, J. M., 2003, Solid state astrochemistry, NATO Science Series II: Mathematics, Physics and Chemistry, Vol. 120
- [Papovich et al., 2004] Papovich C., Dole H., et al, 2004, Ap. J. Sup. in press
- [Partridge & Peebles, 1967] Partridge R. B. and Peebles P. J. E. , 1967, Ap.J. 148,377
- [Platt, 1956] Platt, 1956, ApJ, 123, 486
- [Puget et al., 1985] Puget J.L., Léger A. and Boulanger F., 1985, A&A 142, L19
- [Puget et al., 1996] Puget J.L., Abergel A., Bernard J.P., et al., 1996, A&A 308, L5
- [Sellgren, 1983] Sellgren, K., 1983, Ph. D. thesis
- [Willner et al., 1979] Willner et al., 1979, ApJ, 229, L65
Acknowledgements.
It is a pleasure to thanks the sponsors of this Conference, the Anglo American Chairmans F́und, for their financial support of this J. Mayo Greenberg Lecture