A population of hot, dusty ultra-luminous galaxies at z 2
Abstract
We report spectroscopic redshifts for 18 Jy-radio galaxies at mean redshift of that are faint at both submmillimeter (submm) and optical wavelengths. While the radio fluxes of these galaxies could indicate far-infrared (far-IR) luminosities comparable to high-redshift submillimeter-selected galaxies ( L⊙), none are detected in the submm. We propose that this new population of galaxies represents an extension of the high-redshift submm galaxy population, but with hotter characteristic dust temperatures that shift the peak of their far-IR emission to shorter wavelengths, reducing the submm flux below the sensitivity of current instruments. Therefore, surveys in the submm waveband may miss up to half of the most luminous, dusty galaxies at . Mid-infrared observations with Spitzer will be a powerful tool to test this hypothesis.
Subject headings:
cosmology: observations — galaxies: evolution — galaxies: formation — galaxies: starburst1. Introduction
The microJansky radio population (SJy) has been the key to pinpointing and studying the submm galaxies – SMGs (Ivison et al. 1998, 2002; Barger, Cowie & Richards 2000; Smail et al. 2000; Chapman et al. 2001, 2002a, 2003a). Approximately 40% of Jy radio sources with optical magnitudes (the optically faint radio galaxies: OFRGs) are detected at S mJy with SCUBA, and conversely 65–70% of SMGs brighter than this flux limit have reliable radio identifications. A spectroscopic survey of radio-identified SMGs has measured redshifts for 73 SMGs (Chapman et al. 2003b, 2004a – C04), allowing us to constrain their dust temperatures, luminosities, star-formation rates, evolution, clustering strength, and dynamical and gas masses (Chapman et al. 2003b, 2004a; Blain et al. 2004a, 2004b; Neri et al. 2003; Greve et al. 2004; Smail et al. 2003, 2004; Swinbank et al. 2004). With these measurements for a representative sample of submm-bright galaxies we can now study the properties of obscured galaxies at as easily as the typically less-obscured UV-selected population (Steidel et al. 2004).
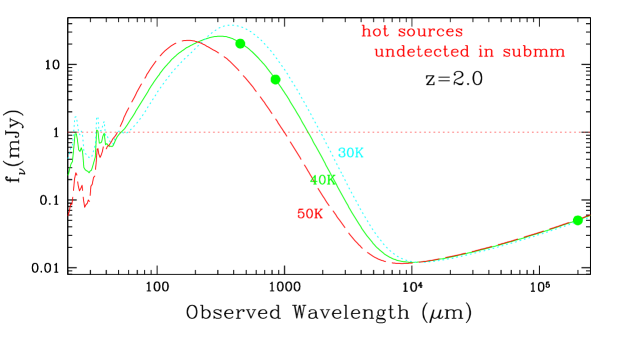
However, there remains the question of the nature of the 60% of the OFRGs which are not bright submm sources. Chapman et al. (2003a) attempted a comprehensive study of the whole Jy radio population, but could not constrain the nature of those OFRGs without submm detections. This was mostly due to a lack of spectroscopic redshifts for these galaxies, which could thus either be interpreted as moderate-luminosity star forming galaxies at intermediate redshifts, , or alternatively, bolometrically-luminous galaxies at similar redshifts to the SMG population, but which are not detectable in the submm waveband. The latter possibility exists because submm flux is a relatively poor proxy for the bolometric luminosity of a galaxy, being strongly sensitive to the characteristic dust temperature (Blain 1999; Eales et al. 2000). The dependence for galaxies at follows the approximate form STLTIR – even a small increase in Td implies a large decrease in observed submm flux density (see Fig. 1).
To investigate the nature of the submm-faint OFRGs, we have undertaken a spectroscopic survey of this population in parallel with the SMG redshift survey of C04. In §2 we describe the sample and our observations. §3 presents our findings and §4 discusses these and gives our conclusions. All calculations assume a flat, CDM cosmology with and km s-1 Mpc-1.
2. Sample and Observations
The sample studied here is defined by selecting all radio sources in seven separate fields (CFRS-03, Lockman-Hole, HDF, SSA13, Westphal-14, Elais-N2, and SSA22) which have either been targeted with SCUBA (Holland et al. 1999) in photometry-mode or lie within existing SCUBA maps in these regions and which lack an optical counterpart brighter than . The latter criteria has the effect of eliminating the lowest redshift, low-luminosity sources as well as optically bright AGN at high redshifts (the condition implies that L∗ quasars and optical-AGN are excluded from our sample for – Boyle et al. 2000). For comparison to earlier work on OFRGs we note that the typical color of galaxies at is (Smail et al. 1995). We note that a less stringent cut in optical faintness () leads to a significantly larger number of broad-line QSOs and low-redshift star-forming systems in the sample.
The radio data in CFRS-03, Lockman-Hole, Westphal-14, Elais-N2, and SSA22 were obtained and reduced as part of our own programs (C04) and reaches r.m.s. sensitivities of 4–10 Jy. Details of the Lockman-Hole and Elais-N2 radio data and their reduction can be found in Ivison et al. (2002), and this description is applicable to the other datasets. The HDF and SSA13 radio data were obtained from E.A. Richards (private communication), and reach r.m.s. sensitivities of 8 and 5Jy respectively. The HDF data is described in Richards (2000), while the SSA13 data is so far unpublished (a subsequent reduction of the SSA13 data is described in Fomalont et al. 2004). Submm fluxes were measured for all optically faint radio sources in these regions from either targeted photometry-mode observations with SCUBA in these fields by our group (the technique is described in Chapman et al. 2001), or from our reduced SCUBA maps of these fields taken and reduced from the JCMT archive, using a weighted 3-beam extraction. In the latter case to avoid contamination from bright submm sources unrelated to the OFRGs, the maps were first cleaned of all other sources brighter than 3 before the fluxes were measured. Original presentations of some of the submm maps in these fields are given in the following papers: CFRS-03 (Webb et al. 2003), Westphal-14 (Eales et al. 2000), Lockman-Hole and Elais-N2 (Scott et al. 2002), HDF, SSA13 and SSA22 (Barger et al. 1999, 2000).
We then refine our sample further by discarding any sources which are either nominally detected in the submm at or have 2.5- limits on their submm fluxes which are consistent with them being brighter than 5 mJy at 850 m. This guarantees that the final sample are much fainter in the submm than the C04 sample, which has a mean submm flux of S mJy, with two-thirds brighter than 5 mJy. As we show later, the typical submm flux for the OFRGs in our survey is only mJy and so most of these galaxies lie far below the confusion limit of current blank-field submm surveys.
These selection criteria result in a parent catalog of 60 submm- and optically-faint radio galaxies. We note that there is a comparably sized sample of OFRGs which are not formally detected in the submm, but whose submm limits are still consistent with detections, with an average S mJy, which are discussed in Chapman et al. (2004a). Note that of the 169 radio sources whose redshifts were used in the analysis of Chapman et al. (2003c), none satisfy the criteria for inclusion in this catalog, as they all have .
A random subset of 36 of the 60 submm-faint OFRG were spectroscopically observed with LRIS (Oke et al. 1995; Steidel et al. 2004) on Keck in several observing runs throughout 2002, 2003, and 2004, under generally good conditions (– seeing). All the spectra cover the observed wavelength range from 0.3 m out to as much as 0.8m (depending on the slit position in the mask, and the grating used on the red arm of LRIS: 400l/mm or 600l/mm). Exposure times were 1.5–4.5 hr, split into 30-min integrations. Data reduction followed standard techniques using custom iraf scripts. One-dimensional spectra were extracted and compared with template spectra and emission-line catalogues to identify redshifts. All identifications are based on multiple features, most prominently the Ly line, along with weaker stellar/interstellar/AGN features and/or continuum breaks (Fig. 2).
We obtain secure redshifts for 18 submm-faint OFRGs in our sample giving a spectroscopic completeness for this sample of only 50%. While relatively low, this completeness level is sufficient to elucidate some of the basic properties of this population. We note that all the OFRGs in our sample from the HDF and SSA13 fields (including both the sources presented in Table 1, and the sources we exclude from the present sample because their submm limits are consistent with marginal detections) were included in the OFRG samples in Chapman et al. (2003a). However, spectroscopic identifications have not been previously presented for any of these galaxies. The OFRGs in the remaining five fields are presented for the first time here.
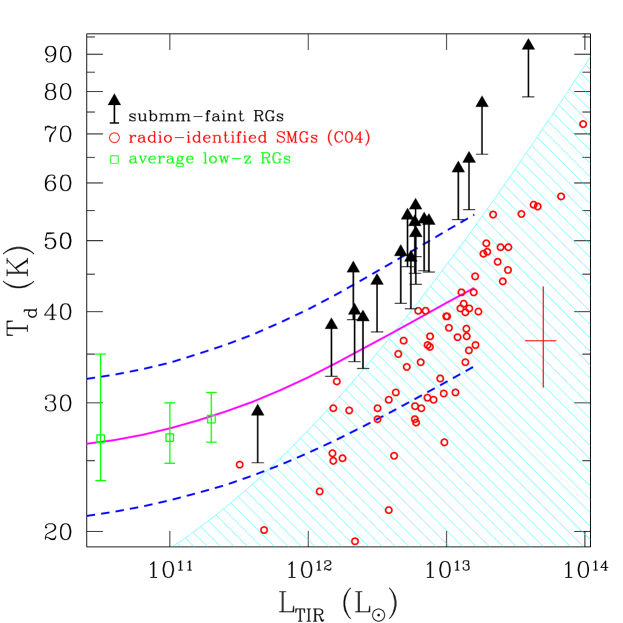
We stress that this secure spectroscopic sample is conservatively restricted to those galaxies with the very best spectral identifications (with two or more reliable features). Of the remaining 18 nominally unidentified sources in our sample, many have either solitary bright emission lines, or several weak features which would put them into the same redshift range as those presented in this paper. The emission lines are likely to be either Ly, when no continuum was detected and the wavelength was 4500Å, or [Oii3727 if continuum was detected on both sides of the line and the wavelength was 4500Å. We illustrate the spectra for the securely identified sample in Fig. 2 and list their observational properties in Table 1: their positions, redshifts, submm and radio fluxes and optical magnitudes, limits on their dust temperatures Td, total infrared luminosities LTIR, and spectral class (divided into starburst (SB), AGN/SB or AGN). LTIR was calculated, based on the redshift and radio flux densities, K-correcting the synchrotron spectrum with an index (Richards 2000), and assuming the local far-IR–radio correlation (Condon et al. 1991, Helou et al. 1985). The derived Td and LTIR are plotted in Fig. 3.
Our spectral classes are derived from the UV spectral properties as follows: SB, no Civ1549 emission detected at above the noise; AGN/SB, detectable Civ1549 emission, but also robust interstellar absorption lines (most notably SII1264, OI/SI1303, and CII1335) which would be heavily diluted/undetected if an AGN dominated the UV continuum emission; AGN, showing significant Civ1549 emission with no detectable interstellar absorption features. The Civ/Ly ratio has been used as an AGN diagnostic in previous studies of high-redshift galaxies. This ratio has a mean of 0.2 for the AGN subsample of LBGs selected by Steidel et al. (2002), and a value of 0.12 for the composite radio galaxy spectrum presented by McCarthy (1993). McCarthy (1993) and references therein argue that the ensemble properties of high-redshift radio galaxies (indications of a hard photoionizing spectrum, alignment of emission-line and radio major axes, and possible correlation between Lradio and L[Oiii]) suggest they are predominantly AGN-powered. All of our OFRGs with AGN or AGN/SB classifications have Civ/Ly. We also note that strong Civ1549 emission is present in some classical luminous radio galaxies which also exhibiting interstellar absorption lines in the UV (e.g., 4C 41.17 – Dey et al. 1997). Both of these facts mean that our classifications should be interpreted with caution.
3. Analysis and Results
Our survey shows that the submm-faint OFRG are a high-redshift galaxy population, the mean redshift of our sample is with an interquartile range of and a full range spanning –3.4. At such high redshifts, these galaxies are bolometrically luminous, all but one with LL⊙, and 4 with LL⊙ (Table 1, Fig. 3), assuming the local far-IR–radio correlation holds. These luminosities are comparable to those estimated for the submm-detected population uncovered by SCUBA (C03), as shown in Fig. 3. Moreover, the redshift range populated by the submm-faint OFRG is the same as that inhabited by SMGs (C03; C04), which have a median of . The two populations also have very similar optical and radio characteristics: the 18 spectroscopically-identified, submm-faint OFRGs have a median -band magnitude of and a median radio flux of S Jy, comparable to the values seen for the submm-detected radio sources in the C04 sample: and S Jy (although with the caveat that SMGs are not restricted to ).
The similarity of the OFRG and SMG populations extends to their UV spectral properties, where a comparison of Fig. 2 and the spectra presented in C03/C04 shows that the spectral characteristics of both submm-bright and submm-faint radio galaxies are very similar. The spectra of the submm-faint OFRG span a range from pure starburst (similar to the –3 population selected in the rest-frame UV – Shapley et al. 2003) to low luminosity narrow line or Type-II AGN with enhanced Nv1240 and/or Civ1549 emission. Although we see no broad-line Type-I AGN, this is not particularly surprising given our optical limit was chosen to exclude them. The galaxy spectra in which AGN signatures dominate comprise about 20% of the submm-faint OFRG sample, with the SMG sample of C04 exhibiting a similar fraction. These AGN are spectrally similar to the restframe UV-selected AGN at described in Steidel et al. (2002), although those galaxies are typically undetected in the radio. A further quarter of our OFRGs exhibit interstellar absorption features in the UV-continuum, but also show signficant AGN emission lines (e.g. Civ1549, Heii1640), which we classify as hybrid AGN/SB. The UV spectra of the remainder of our spectroscopically-identified OFRG, consisting of half of the sample, show no detectable signs of AGN. An H survey of OFRGs and SMGs (Swinbank et al. 2004) broadly supports the pure-starburst classification from the UV; galaxies identified as SB from the UV typically show narrow H linewidths (500 km/s) and low [Nii]/H ratios typically of star-forming galaxies. Moreover, we note that those galaxies for which we failed to identify a redshift were either undetected on the slit, showed no obvious features in the weakly detected continuum, or showed only a single spectral feature as described above. Some of these galaxies are likely to be high redshift starbursts, since AGN lines would likely have been identified even with the faint continuum magnitudes. However, a low redshift starburst interpretation would still be consistent with several of these galaxies. We can conclude that less than half of the OFRG sample are likely to show any spectral signatures of an AGN, similar to the spectroscopically-classified SMG population.
In fact, there is only one characteristic which differs substantially between our submm-faint OFRG sample and the SMGs in C03/C04 – the average 850-m flux of the galaxies. The C04 sample of SMGs has an average flux of 6.6 mJy, whereas the submm-faint OFRGs have a variance-weighted average of only S mJy, an order of magnitude fainter. Why are these apparently ultraluminous galaxies, which share many features with the submm-bright, high-redshift SMG population so faint in the submm waveband? As illustrated in Fig. 1 this could either reflect: enhanced radio emission, relative to the far-infrared, compared to that normally seen in star-forming galaxies; or a hotter characteristic dust temperature than that of the submm-detected population at these redshifts. We discuss these alternatives in turn.
Radio emission from an AGN is one possible route to increase the radio fluxes of these galaxies, but not increase their far-infrared luminosities – and thus leave them undetectable in the submm waveband. We see some signatures of an AGN in half of our sample with robust redshifts, however to significantly perturb the radio fluxes of these systems we would require a substantial contribution from the AGN and hence a luminous, central AGN. The spectral features we see can arise at relatively large radius (for instance in the outer parts of the accretion disk around the AGN and beyond – e.g. Hutchings et al. 1998) and so it is possible that dust in the very central regions is obscuring the true luminosity of the AGN in the restframe UV. Optically-thin radio emission could still escape from these regions and hence high spatial resolution radio observations would identify a strong central point source. Moreover, X-ray emission from the AGN can also escape, and hence sensitive X-ray observations can be used to search for luminous, but highly-obscured AGN in these galaxies. Both of these observational tests can be applied to the OFRGs lying in the well-studied HDF region.
Of the four OFRG lying in the HDF region, two have restframe UV spectra which are classed as starbursts, one is an AGN/SB and one is classed as an AGN. None of the galaxies spectrally-classified as starbursts or AGN/SB are detected in the 2-Ms Chandra HDF observation, while the AGN is (Alexander et al. 2003). To provide a more general comparison we take advantage of the spectral similarity of SMG and submm-faint OFRG to combine our sample with that of C04 to provide 12 luminous, dusty high-redshift galaxies with AGN signatures and 20 with starburst spectra within the Chandra HDF. In the 2-Ms Chandra image, the 12 sources showing AGN signatures in their UV spectra are all detected in the X-ray data, whereas only 9 of the sources showing starburst spectra are detected. Moreover, the average 2–8 keV X-ray flux of those SMGs/OFRG with AGN-like spectra are roughly an order of magnitude greater than the galaxies with starburst spectra, whose X-ray fluxes are more consistent with that expected from the X-ray binary star emission from a M⊙ yr-1 starburst (see Alexander et al. 2004).
The high-resolution radio observations of the sources in the HDF come from the MERLIN/VLA map of this region (Muxlow et al. 2004; see also Chapman et al. 2004b) and have 0.3′′ resolution – sufficient to identify nuclear radio sources on sub-kpc scales. These data show that the radio morphologies for the starburst-classified OFRG are often extended and clumpy on ( kpc) scales, while some galaxies with signs of AGN in their UV spectra also show similar radio morphologies (Chapman et al. 2004b). This indicates that the majority of the radio emission from these galaxies is not coming from a central point-source or from low-luminosity analogs of classical radio jets. Hence, we conclude that the majority of these galaxies do not have AGN-enhanced radio emission and thus they must be bolometrically luminous systems.
Why then are these galaxies undetected in the submm, where we detect comparably luminous dusty galaxies at these redshifts (C04)? The answer must lie in the characteristic temperature of the dust emission in these galaxies. This is shown in Fig. 3, which depicts the distribution on the Td–LTIR plane of the local IRAS galaxy distribution (Chapman et al. 2003c) and the locations of the radio-detected SMGs at from C04. A representative flux limit for current submm surveys is shown by the shaded region. This demonstrates that hot, high-luminosity dusty galaxies could be at similar redshifts to the SMGs, , and detectable in the radio, but not at 850 m with SCUBA (see also Blain et al. 2004b). Using the average, error-weighted flux for the submm-faint OFRG sample we can estimate the characteristic dust temperature these galaxies must have: K, rather than the K of the submm-detected population. While the dust temperatures distributions of the SMG and OFRG populations overlap, Fig. 3 shows that the samples are distinct in Td/(1+). The total range in Td spanned by luminous galaxies at high redshift could be a factor of two larger than that implied by submm-selected galaxies alone (Blain et al. 2004a, C04).
We conclude that the submm-faint OFRGs are most likely hotter relatives of the SMGs detected at high redshift. These galaxies have far-infrared luminosities of 1012 L⊙, and appear to be predominantly powered by starbursts, as shown by the relative weakness of AGN signatures in the UV, X-ray or radio wavebands. While our LTIR estimates rely on the validity of the local far-IR–radio correlation (Condon et al. 1991, Helou et al. 1985), if the correlation is very different at , then it would affect the luminosity calculations for the SMGs and submm-faint OFRGs in a similar manner, and they would still remain comparably luminous populations.
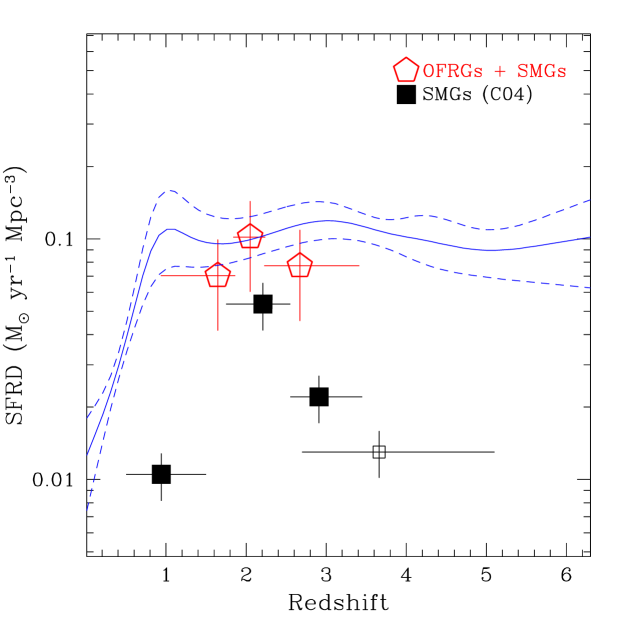
The volume density of submm-faint OFRGs at are comparable to that of the SMGs (C03, C04), with Mpc-3 for . This suggests that around half of the ultraluminous infrared galaxies at are missed by existing submm selection criterion, and that the total volume density of L⊙ galaxies at this epoch is Mpc-3. We illustrate this by calculating the star formation rate densities (SFRD) for our sample of 18 OFRG, divided into three redshift bins (Fig. 4). We note that the far-IR emission from between 20–50% of our sample may include a contribution from an AGN, however, this down-ward revision in the estimated SFRD would be compensated by including those (predominantly star-forming) OFRG’s for which we have only obtained single-feature redshifts and which are therefore not included in this estimate. We translate our luminosity-density measurements into a star-formation density using the average standard calibration of 1.910L⊙ (M⊙ yr (Kennicutt 1998) and add the results to the SFRDs of submm galaxies in Fig. 4. This reveals that the observed OFRG and submm galaxy samples have a SFRD at comparable to restframe-UV selected galaxies after correcting the latter for dust extinction by a factor of five. The space density of these luminous galaxies has decreased a thousand-fold over the last 11 Gyrs, to just Mpc-3 at the present-day where the IRAS survey selected all the most luminous, low-redshift, dusty galaxies regardless of dust temperature. This evolution is far stronger than is seen in less luminous galaxies and underlines the importance of tracing obscured activity to understand the earliest phases of galaxy formation in the Universe.
We can further demonstrate the decoupling of the unobscured and obscured surveys of distant, star-forming galaxies by investigating the limited extent to which the huge infrared luminosities of the OFRGs are traced by their rest-frame UV emission. By design these galaxies are faint in the optical, and typically very faint in the UV. Using the deep photometry of OFRGs lying in the HDF, Lockman, and SA22 fields, we determine that there is some overlap of the colors and UV luminosities of the OFRGs with populations of galaxies selected in the UV (Steidel et al. 2004). Hence, some OFRGs have similar UV-predicted SFRs to the Steidel et al. galaxies (Reddy & Steidel 2004). However, these are well below the star formation rates implied by the radio emission ( M⊙ yr-1). A similar mismatch arises locally when one considers the faint UV emission and blue colors of some dusty ULIRGs (e.g. Goldader et al. 2002).
4. Discussion and Conclusions
Looking at the similarity in the median redshifts of the SMG and submm-faint OFRG samples it is tempting to conclude that the evolution of these two populations must be similar, peaking strongly in SFRD at . However, there are substantial differences in the K-corrections between submm- and radio-selected samples. While the SMG redshift survey (C03/C04) includes a radio-selection criteria, the total SMG population is constrained by both a knowledge of the underlying parent population (C04) and the benefits of a negative submm-wave K-correction that maps a flux limited survey into a luminosity-limited survey. Unfortunately, at the radio fluxes of the submm-faint OFRG begin to fall below the current sensitivity limits of the VLA. Hence for the submm-faint OFRGs we are unable to state whether the population seen at –3 can extend to much higher redshifts with a comparable luminosity density (analogous to the apparently constant comoving luminosity density in UV-selected populations at –4, Steidel et al. 1999; Giavalisco et al. 2004).
Understanding the relationship between the submm-faint OFRGs, the submm-brighter galaxies (C04), and other high-redshift populations (Franx et al. 2003; Daddi et al. 2003; Steidel et al. 2004) will be helped by comparing the strength of the clustering, both within and between the different classes. Unfortunately, this will require substantially larger samples than are currently available. However, it is worth pointing out that the statistics of pairs of submm-faint OFRG within 1200 km s-1 of each other in these fields are comparable to those found for SMGs by Blain et al. (2004a), and similar calculations for the OFRG sample would yield an estimate of the correlation length h Mpc, amongst the highest clustering amplitudes seen for any high- population. In addition, several of these submm-faint OFRGs lie within the SMG associations described in Blain et al. (2004a), suggesting a close relationship between SMGs and OFRGs. These arguments provide circumstantial support for our claim that we have indeed found a new population of extremely luminous galaxies, comparable to the SMGs.
Our discovery of this new, luminous galaxy population at could have several implications. The most important is that the census of the most luminous star formation at the peak epoch in quasar activity () is seriously incomplete when only the submm-bright fraction is considered. We suggest therefore that the star formation rate density has been underestimated in studies to date (Steidel et al. 1999; Smail et al. 2002; C03). At least out to , the radio selection provides us with a less biased assessment of the total energetic budget. This conclusion is not changed qualitatively if we remove the half of the new sample that exhibit signs of an AGN in their UV spectra (especially if we consider that the half of the parent sample which have only single-feature redshifts, and hence are not included here, are likely to be starburst systems at similar redshifts). However, the current sensitivities achievable in the radio cannot detect such hot, luminous galaxies beyond 3, and we are therefore not in a position to assess the incompleteness of current estimates of the obscured star formation rate density at higher redshifts. Observations from Spitzer and the extended-VLA may complete the picture initiated in this study.
Acknowledgments
We acknowledge Eric Richards for providing us with his reduced maps of HDF and SSA13. We also acknowledge comments from an anonymous referee which helped clarify the presentation and content of this paper. SCC acknowledges support from NASA grants #9174 and #9856, IRS from the Royal Society and AWB through NSF grant AST-0205937 and the Alfred P. Sloan Foundation. Data presented herein were obtained using the W. M. Keck Observatory, which is operated as a scientific partnership among Caltech, the University of California and NASA. The Observatory was made possible by the generous financial support of the W. M. Keck Foundation. This paper made use of observations from the JCMT archive at the Canadian Astronomy Data Centre, which is operated by the Dominion Astrophysical Observatory for the National Research Council of Canada’s Herzberg Institute of Astrophysics. The National Radio Astronomy Observatory is a facility of the National Science Foundation operated under cooperative agreement by Associated Universities, Inc.
References
- (1)
- (2) Alexander, D. M., Bauer, F. E., Brandt, W. N., Schneider, D. P., Hornschemeier, A. E., Vignali, C., et al., 2003, AJ, 126, 539
- (3)
- (4) Alexander, D. M., et al., 2004, ApJ, in prep
- (5)
- (6) Barger, A. J., Cowie, L. L., Richards, E. A., 2000, AJ, 119, 2092
- (7)
- (8) Blain, A. W., 1999, MNRAS, 309, 995
- (9)
- (10) Blain, A.W., Chapman, S.C., Smail, I., Ivison R., 2004a, ApJ, in press (astro-ph/0404438)
- (11)
- (12) Blain, A.W., Chapman, S.C., Smail, I., Ivison R., 2004b, ApJ, in press (astro-ph/0405035)
- (13)
- (14) Boyle, B. J., Shanks, T., Croom, S. M., Smith, R. J., Miller, L., Loaring, N., Heymans, C., 2000, MNRAS, 317, 1014
- (15)
- (16) Chapman, S. C., Richards, E. A., Lewis, G. F., Wilson, G., Barger, A. J., 2001, ApJ, 548, L147
- (17)
- (18) Chapman, S. C., Lewis, G. F., Scott, D., Borys, C., Richards, E., 2002, ApJ, 570, 557
- (19)
- (20) Chapman, S. C., Barger, A., Cowie, L., Borys, C., Capak, P., Fomalont, E., Lewis, G., Richards, E., Scott, D., Steffen, A., Wilson, G., Yun, M., 2003a, ApJ, 585, 57
- (21)
- (22) Chapman, S. C., Blain, A., Ivison, R., Smail, I., 2003b, Nature, 422, 695 [C03]
- (23)
- (24) Chapman, S. C., Helou, G., Lewis, G. F., Dale, D., 2003c, ApJ, 588, 186
- (25)
- (26) Chapman, S. C., Blain, A., Smail, I., Ivison, R. J., 2004a, ApJ, submitted [C04]
- (27)
- (28) Chapman, S. C., Smail, I., Windhorst, R., Muxlow, T., Ivison, R. J., 2004b, ApJ, submitted
- (29)
- (30) Condon, J. J., Anderson, M. L., Helou, G., 1991, ApJ, 376, 95
- (31)
- (32) Connolly, A., et al., 1997, ApJ, 486, L11
- (33)
- (34) Daddi, E., Rottgering, H. J. A., Labbe, I., Rudnick, G., Franx, M., Moorwood, A. F. M., Rix, H. W., van der Werf, P. P., van Dokkum, P. G., 2003, ApJ, 588, 50
- (35)
- (36) Dale, D., Helou, G., Contursi, A.; Silbermann, N. A.. Kolhatkar, S., 2001, ApJ, 562, 142
- (37)
- (38) Dey, A., van Breugel, W., Vacca, W.D., Antonucci, R. ApJ, 490, 698
- (39)
- (40) Eales, S., Lilly, S., Webb, T., Dunne, L., Gear, W., Clements, D., Yun, M., 2000, AJ, 120, 2244
- (41)
- (42) Flores, H., et al., 1999, ApJ, 517, 148
- (43)
- (44) Franx, M., Labbe, I., Rudnick, G., van Dokkum, P. G., Daddi, E., Forster Schreiber, N. M., Moorwood, A.; Rix, H.-W., et al., 2003, ApJ, 587, L79
- (45)
- (46) Giavalisco, M., Dickinson, M., Ferguson, H. C., Ravindranath, A., Kretchmer, C., Moustakas, L. A., et al., 2004, ApJL, 600, L103
- (47)
- (48) Goldader, J., Meurer, G., Heckman, T. M., Seibert, M., Sanders, D. B., Calzetti, D., Steidel, C. C., 2002, ApJ, 568, 651
- (49)
- (50) Greve, T., et al., 2004, in prep.
- (51)
- (52) Helou, G., et al. 1985, ApJ 440, 35
- (53)
- (54) Holland, W. S., et al. 1999, MNRAS, 303, 659
- (55)
- (56) Hutchings, J., Crenshaw, D. M., Kaiser, M. E., Kraemer, S. B., Weistrop, D., Baum, S., et al., 1998, ApJL, 492, 115
- (57)
- (58) Ivison, R. J., Smail, I., Le Borgne, J.-F., Blain, A. W., Kneib, J.-P., Bezecourt, J., Kerr, T. H., Davies, J. K., 1998, MNRAS, 298, 583
- (59)
- (60) Ivison, R. J., Greve, T., Smail, I., Dunlop, J., Roche, N., Scott, S., Page M., Stevens, J., Almaini, O., Blain, A., Willott, C., Fox, M., Gilbank, D., Serjeant, S., Hughes D., 2002, MNRAS, 337, 1
- (61)
- (62) McCarthy, P., 1993, ARA&A, 31, 639
- (63)
- (64) Neri, R., Genzel, R., Ivison, R. J., Bertoldi, F., Blain, A. W., Chapman, S. C., Cox, P., Greve, T., Omont, A., Frayer, D. T., 2003, ApJ, 597, L113
- (65)
- (66) Oke, J. B., Cohen, J. G., Carr, M., Cromer, J., Dingizian, A., Harris, F. H., Labrecque, S., Lucinio, R., Schaal, W. 1995, PASP, 107, 375
- (67)
- (68) Reddy, N. A., Steidel, C. C., 2004, ApJ, 603, L13
- (69)
- (70) Richards, E. A. 2000, ApJ, 533, 611
- (71)
- (72) Shapley, A., Steidel, C., Adelberger, K., Pettini, M., 2003, ApJ, 588, 65
- (73)
- (74) Smail, I., Hogg, D. W., Yan, L., Cohen, J. G., 1995, ApJL, 449, L105
- (75)
- (76) Smail, I., Ivison, R. J., Owen, F. N., Blain, A. W., Kneib, J.-P., 2000, ApJ, 528, 612
- (77)
- (78) Smail, I., Ivison R. J., Blain, A. W., Kneib, J.-P., 2002, MNRAS, 331, 495
- (79)
- (80) Smail, I., Chapman, S. C., Ivison, R. J., Blain, A. W., Takata, T., Heckman, T., Dunlop, J. S., Sekiguchi, K., 2003, MNRAS, 342, 1185
- (81)
- (82) Smail, I., et al., 2004, ApJ, submitted
- (83)
- (84) Stanford, S. A., Stern, D., van Breugel, W., de Breuk, C., 2000, ApJS, 131, 185
- (85)
- (86) Steidel, C. C., Adelberger, K. L., Giavalisco, M., Dickinson, M., Pettini, M., 1999, ApJ, 519, 1
- (87)
- (88) Steidel, C. C., Hunt, M., Shapley, A., Adelberger, K., Pettini, M., Dickinson, M., Giavalisco, M., 2002, ApJ, 576, 653
- (89)
- (90) Steidel, C. C., Shapley, A., Pettini, M., Adelberger, K., Erb, D. K., Reddy, N. A., Hunt, M. P., 2004, ApJ, 604, 534
- (91)
- (92) Swinbank, A. M., Smail, I., Chapman, S. C., Blain, A. W., Ivison, R. J., Keel, W. C., 2004, ApJ, submitted
- (93)
- (94) Yan, L., et al., 1999, ApJ, 519, L47
- (95)
- (96) Yun, M., Reddy, N., Condon, J. 2001, ApJ, 554, 803
- (97)


| ID | S1.4GHz | S850μm | LTIR | Spectral | |||
|---|---|---|---|---|---|---|---|
| (Jy) | (mJy) | (K) | (1012 L⊙) | type | |||
| RG J030257.94+001016.3 | 55.19.8 | 25.7 | 0.21.5 | 2.241 | 46 | 7.7 | AGN/SB |
| RG J105209.31+572202.8 | 39.45.4 | 24.6 | 1.61.3 | 2.112 | 40 | 7.6 | SB |
| RG J105239.84+572509.1 | 43.65.1 | 23.5 | 1.01.4 | 1.819 | 38 | 3.5 | AGN/SB |
| RG J105225.46+572551.4 | 36.15.4 | 24.4 | 0.61.7 | 1.718 | 34 | 2.4 | AGN/SB |
| RG J105154.24+572325.0 | 46.75.2 | 24.4 | 0.11.3 | 1.677 | 34 | 2.8 | SB |
| RG J105204.22+572745.7 | 42.96.1 | 23.9 | 2.11.7 | 0.934 | 29 | 0.5 | SB |
| RG J123617.57+621540.7 | 200.012.8 | 24.7 | 2.11.0 | 1.993 | 66 | 20.3 | SB |
| RG J123623.54+621642.7 | 481.025.4 | 24.1 | 1.61.1 | 1.918 | 79 | 43.8 | AGN/SB |
| RG J123640.74+621010.6 | 86.88.8 | 25.8 | 1.51.7 | 1.958 | 30 | 8.4 | SB |
| RG J123704.02+621157.6 | 41.18.9 | 26.2 | 1.40.8 | 3.409 | 55 | 16.3 | AGN |
| RG J131207.74+423945.0 | 44.92.4 | 24.8 | 1.11.9 | 2.228 | 40 | 6.2 | SB |
| RG J131208.34+424144.4 | 37.64.0 | 25.2 | 1.81.5 | 2.234 | 41 | 5.2 | SB |
| RG J131236.05+424044.1 | 48.74.3 | 24.1 | 0.41.1 | 2.224 | 48 | 6.7 | SB |
| RG J131237.95+424006.0 | 39.94.3 | 24.1 | 0.10.9 | 1.643 | 39 | 2.4 | AGN/SB |
| RG J163642.74+405515.4 | 55.18.6 | 24.7 | 1.21.5 | 2.731 | 44 | 6.7 | AGN |
| RG J163656.28+405912.2 | 30.98.6 | 25.3 | 0.51.4 | 2.604 | 41 | 6.6 | AGN |
| RG J221732.22+001528.2 | 49.85.6 | 24.5 | 0.11.1 | 2.105 | 46 | 5.9 | AGN |
| RG J221746.30+001423.4 | 38.88.6 | 24.2 | 1.01.4 | 3.099 | 54 | 13.6 | SB |
-
•
Td limits derived using limits from the submm.
-
•
LTIR was calculated assuming the local far-IR/radio correlation (Helou et al. 1985), with a TIR color correction term calculated at the Td limit.