The Great Observatories Origins Deep Survey
We present the first results of the ESO/GOODS program of spectroscopy of faint galaxies in the Chandra Deep Field South (CDF-S). 399 spectra of 303 unique targets have been obtained in service mode with the FORS2 spectrograph at the ESO/VLT, providing 234 redshift determinations (the median of the redshift distribution is at 1.04). The typical redshift uncertainty is estimated to be . Galaxies have been color selected in a way that the resulting redshift distribution typically spans from z=0.5 to 2. The reduced spectra and the derived redshifts are released to the community through the ESO web page . Large scale structure is clearly detected at and . Three Lyman-break galaxies have also been included as targets and are confirmed to have redshifts , and . In a few cases, we observe clear [OII]3727 rotation curves, even at the relatively low resolution () of the present observations. Assuming that the observed velocity structure is due to dynamically-relaxed rotation, this is an indication of large galactic masses (few times ) at .
Key Words.:
Cosmology: observations – Cosmology: deep redshift surveys – Cosmology: large scale structure of the universe – Galaxies: evolution.1 Introduction
The Great Observatories Origins Deep Survey (GOODS) is a public, multifacility project that aims to answer some of the most profound questions in cosmology: how did galaxies form and assemble their stellar mass? When was the morphological differentiation of galaxies established and how did the Hubble Sequence form? How did AGN form and evolve, and what role do they play in galaxy evolution? How much do galaxies and AGN contribute to the extragalactic background light? Is the expansion of the universe dominated by a cosmological constant? A project of this scope requires large and coordinated efforts from many facilities, pushed to their limits, to collect a database of sufficient quality and size for the task at hand. It also requires that the data be readily available to the worldwide community for independent analysis, verification, and follow-up.
The program targets two carefully selected fields, the Hubble Deep Field North (HDF-N) and the Chandra Deep Field South (CDF-S), with three NASA Great Observatories (HST, Spitzer and Chandra), ESA’s XMM-Newton, and a wide variety of ground-based facilities. The area common to all the observing programs is 320 arcmin2, equally divided between the North and South fields. For an overview of GOODS, see Dickinson et al. (2003), Renzini et al. (2002) and Giavalisco et al. (2004a).
Spectroscopy is essential to reach the scientific goals of GOODS. Reliable redshifts provide the time coordinate needed to delineate the evolution of galaxy masses, morphologies, clustering, and star formation. They calibrate the photometric redshifts that can be derived from the imaging data at 0.36-8m. Spectroscopy will measure physical diagnostics for galaxies in the GOODS field (e.g., emission line strengths and ratios to trace star formation, AGN activity, ionization, and chemical abundance; absorption lines and break amplitudes that are related to the stellar population ages). Precise redshifts are also indispensable to properly plan for future follow-up at higher dispersion, e.g., to study galaxy kinematics or detailed spectral-line properties.
The ESO/GOODS spectroscopic program is designed to observe all galaxies for which VLT optical spectroscopy is likely to yield useful data. The program makes full use of the VLT instrument capabilities (FORS2 and VIMOS), matching targets to instrument and disperser combinations in order to maximize the effectiveness of the observations. The magnitude limits and selection bandpasses depend to some degree on the instrumental setup being used. The aim is to reach mag with adequate S/N, with this limiting magnitude being in the B band for objects observed with the VIMOS LR-Blue grism, in the V band for those observed in the VIMOS LR-Red grism, and in the z band for the objects observed with FORS2. This is not only a practical limit, however, but is also well matched to the scientific aims of the GOODS program. The ACS imaging samples rest-frame optical (B-band) light out to , where reaches 1.5 to 2 magnitudes past . This is also the practical limit for high-quality, quantitative morphological measurements from the ACS images (cf. Abraham et al. (1996)). Similarly, is mag fainter than the measured UV for Lyman Break Galaxies (LBGs), and 0.5 mag fainter than that at (Steidel et al. (1999)). These are the limits to which GOODS/SIRTF IRAC data will robustly measure rest-frame near-IR light, and hence constrain the stellar mass.
In this paper we report on the first spectroscopic follow-up campaign in the Chandra Deep Field South (CDF-S), carried out with the FORS2 instrument at the ESO VLT in the period fall 2002 - spring 2003 (the first 9 masks, 348 slits). Further 17 masks have been observed during the period 2003 and early 2004, for which the reduction process has started and will be presented elsewhere (Vanzella et al., in preparation).
The paper is organized as follows: in Sect. 2 we describe the target selection and in Sect. 3 the observations and the reduction. The redshift determination is presented in Sect. 4. In Sect. 5 we discuss the data and in Sect. 6 the conclusions are presented. Throughout this paper the magnitudes are given in the AB system (AB ), and the ACS F435W, F606W, F775W, and F850LP filters are denoted hereafter as , , and , respectively. We assume a cosmology with and km s-1 Mpc-1.
2 Target Selection
Objects were selected as candidates for FORS2 observations primarily based on the expectation that the detection and measurement of their spectral features would benefit from the high throughput and spectral resolution of FORS2, and its reduced fringing at red wavelengths, relative to other instrumental options such as VIMOS. In particular, we expect that the main spectral emission and absorption features for galaxies at would appear at very red optical wavelengths, out to m. Similarly, very faint Lyman break galaxies at , selected as , and –dropouts from the GOODS ACS photometry, also benefit greatly from the red throughput and higher spectral resolution of FORS2.
In practice, several categories of object selection criteria were used to ensure a sufficiently high density of target candidates on the sky to efficiently fill out multi-slit masks. Using ACS photometry in the AB magnitude system, these criteria were:
-
1.
Primary catalog: and . This should ensure redshifts for ordinary early-type galaxies (whose strongest features are expected to be absorption lines), and higher redshifts for intrinsically bluer galaxies likely to have emission lines.
-
2.
Secondary catalog: and .
-
3.
Photometric-redshift sample: and , using an early version of GOODS photometric redshifts like those described by Mobasher et al. (2004).
-
4.
-dropout and –dropout Lyman break galaxy candidates, selected from the criteria of Dickinson et al. 2004a and Giavalisco et al. 2004b , respectively.
-
5.
A few miscellaneous objects, including host galaxies of supernovae detected in the GOODS ACS observing campaign.
Target selection and mask design for the 2002-3 GOODS/FORS2 campaign was carried out while the GOODS ACS observations were still in progress, and before final ACS data reduction or cataloging could be completed. The targets were therefore selected based on interim data reductions and catalogs, initially based on only one epoch of ACS imaging, and later using the three-epoch ACS stacks and preliminary catalogs described in Giavalisco et al. (2004a). Because of this, the actual magnitudes and colors of the observed galaxies from the final, 5-epoch ACS image stack, which we report here in Table 2, may not exactly match the intent of the original selection criteria. When designing the masks, we generally tried to avoid observing targets that had already been observed in other redshift surveys of this field, namely, the K20 survey of Cimatti et al. (2002) and the survey of X-ray sources by Szokoly et al. (2004).
In the present spectroscopic catalog there are 303 targets, 114 meeting the primary selection criterion and 56 meeting the secondary selection criteria. The other targets belong to the remaining classes.
3 Observations and Data Reduction
The VLT/FORS2 spectroscopic observations were carried out in service mode during several nights in 2002 and 2003. A summary is presented in Table LABEL:tab:tblobs. In all cases the I grism was used as dispersing element without order-separating filter. This grism provides a scale of roughly 3.2Å/pixel. The nominal resolution of the configuration was =860, which corresponds to about 9Å at 8000Å. The spatial scale of FORS2 was /pixel, the slit width was always . Dithering of the targets along the slits was applied in order to effectively improve the sky subtraction an the removal of CCD cosmetic defects. The mean shift applied was pixels.
| Mask ID | UT date | exp.time (s) |
|---|---|---|
| 990247 | 30Dec.2002 - 2,6Jan. 2003 | 121200 |
| 984829 | 9Dec.2002 - 3,4Jan. 2003 | 121200 |
| 985831 | 5Jan. - 4,7Feb. 2003 | 151200 + 663 |
| 973934 | 7, 30, 31Jan. 2003 | 121200 |
| 952426 | 6,7Jan. 2003 | 121200 |
| 981451 | 31Jan. - 24,27Feb. - 22Nov. - 17Dec. - 30Jul. - 1Aug. 2003 | 241200 |
| 995131 | 5-6 Oct. 2002 | 81800 |
| 994852 | 4 Oct. 2002 | 81800 |
| 990652 | 8Dec. 12Nov. 2002 | 141200 + 300 + 900 |
3.1 Data Reduction
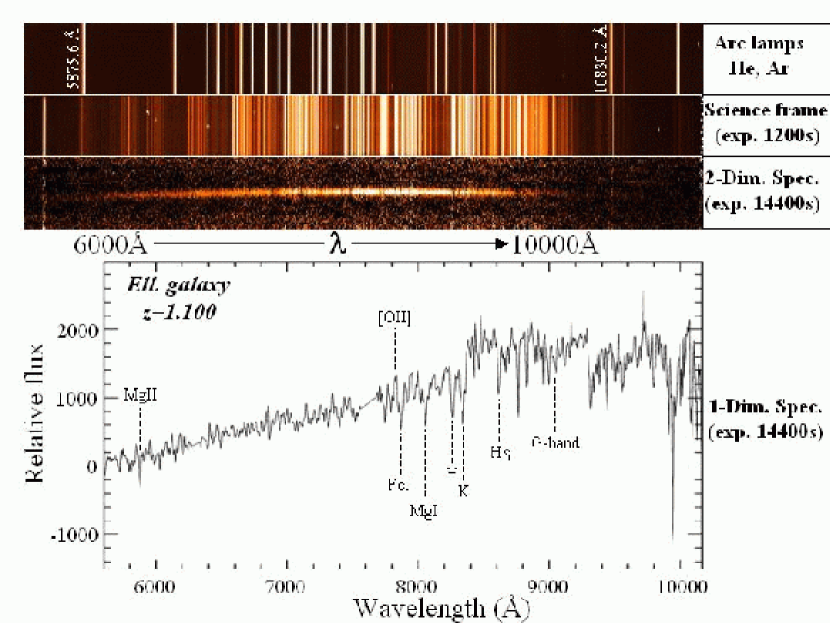
Data were reduced with a semi-automatic pipeline that we have developed on the basis of the MIDAS package (Warmels (1991), using commands of the LONG and MOS contexts (Fig. 1). The frames have been bias-subtracted and flat-fielded. For each slit the sky background was estimated with a second order polynomial fitting. In some cases, better results have been obtained adopting a first order polynomial. The fit has been computed independently in each column inside two windows, above and below the position of the object (if more objects are present in the slit, a suitable modification of the windows is applied).
The resulting dithered, sky-subtracted, two-dimensional frames for each object are then averaged, with the weighting determined based on exposure time, seeing, and meteorlogical conditions. Spatial median filtering has been applied to each dithered exposures to clean the cosmic rays. The FORS2 instrument shows an exquisite response in the red domain (beyond 8000Å), in practice no appreciable residual fringe pattern affects the extracted signal. Rather, the sky residuals dominate the noise in the regions where the intensity and the density of the skylines increase (see Figure 1).
The individual dithered sky-subtracted spectra have been visually inspected to verify that the object is indeed in the expected region of the slit. This step is necessary since the applied small spatial offsets between the science exposures can result in objects falling too close to the slit edge or even outside the slit (in exceptional cases). After this visual screening, the spatial offset between different exposures of the same object was calculated on the basis of the world coordinate system (WCS) information stored in the frame headers. The individual exposures were co-added (including the rejection of bad pixels or cosmic ray hits) after applying these spatial shifts. The frames were shifted in the spatial direction and only by integer numbers of pixels. As the objects were sufficiently well sampled (the pixel scale was significantly smaller than the seeing), no significant blurring of the spectra was observed, while the statistical properties of the individual pixels were preserved.
The position of the target on the detector was estimated by collapsing 700 columns in the dispersion direction and measuring the center of the resulting profile. The 1-D object signal was obtained using the ‘optimal extraction’ method of MIDAS. This procedure calculates a weighted average in each column, based on both the estimated object profile and photon statistics.
Wavelength calibration was calculated on (daytime) arc calibration frames, using three arc lamps (a He, and two Ar lamps) providing sharp emission lines over the whole spectral range used (6000–10800Å). The object spectra were then rebinned to a linear wavelength scale. We have verified the accuracy of the wavelength calibration by checking the position of 25 narrow skylines in the science exposures (from 5577 to 10400 Å). Systematic translations of the wavelength scale have been typically measured to be of the order of 1Å and corrected. The final (absolute) mean wavelength accuracy for all spectra is 0.90.1Å RMS.
Relative flux calibration was achieved by observations of standard stars listed by Bohlin et al. (1995). Since the standard stars are typically quite blue and second order light can be substantial, the calibration spectra were obtained both with and without order-sorting filters, providing calibration across the entire optical window. As noted previously, we opted to obtain the science target without an order-sorting filter, implying deleterious effects to the flux calibration, particularly for bluer objects and at longer wavelengths. For the red objects which dominated the FORS2 target selection, we felt that the improved wavelength coverage more than compensated for the slightly comprimised flux calibration. Due to both this second order light and uncertain slit losses, we caution against using the calibrated fluxes for scientific purposes.
4 Redshift Determination
Spectra of 399 objects have been extracted. From them we have been able to determine 234 redshifts. In the large majority of the cases the redshift has been determined through the identification of prominent features of galaxy spectra: the 4000Å break, Ca H and K, g-band, MgII 2798, AlII 3584 in absorption and , [O ii]3727, [O iii]5007, H, H in emission. The redshift estimation has been performed cross-correlating the observed spectrum with templates of different spectral types (S0, Sa, Sb, Sc, Ell., Lyman Break, etc.), using the package in the IRAF environment. The redshift identifications are summarized in Table LABEL:tab:tblspec and are available at the URL .
In Table LABEL:tab:tblspec, the column ID contains the target identifier, that is constructed out of the target position (e.g., 033206.44-274728.8) where GDS stands for GOODS South. The quality flag, indicates the reliability of the redshift determination. Quality “A” indicates a solid redshift determination, “B” a likely redshift determination, “C” a tentative redshift determination and “X” an inconclusive spectrum or three cases in which no extraction was possible. 150 objects have been classified with quality “A”, 57 with quality “B”, 27 with quality “C”, 69 with inconclusive redshift determination “X”.
The class flag groups the objects for which emission line(s) (em.), absorption-line(s) (abs.) or both (comp.) are detected in the spectrum. The classification has been guided by the observed continuum level and slope blueward and redward of the emission/absorption feature, by the broad-band colors and the morphology of the targets (see Figure 2). 11 objects have been classified as stars.

In 38 of the cases the redshift is based only on one emission line, usually identified with [O ii]3727 or . In these cases the continuum shape, the presence of breaks, the absence of other spectral features in the observed spectral range and the broad band photometry are particularly important in the evaluation. In general these solo-emission line redshifts are classified as “likely” (B) or “tentative” (C).
Finally, the comments column contains additional information relevant to the particular observation. The most common ones summarize the identification of the principal lines, the inclination of an emission line due to internal kinematics, the weakness of the signal (“faint”), the low S/N of the extracted spectrum (“noisy”), the light radius (“Flux-radius”) for objects classified as stars, etc.
There are two objects that are not present in the v1.0 catalog, with and (marked with a cross in the Table LABEL:tab:tblspec). These two objects were not successfully deblended in the detection process from the brighter nearby galaxies.
The internal redshift accuracy can be estimated from a sample of 42 galaxies which have been observed twice (or more) in independent FORS2 mask sets. The distribution of measured redshift differences is presented in Figure 4. The mean of the distribution is close to zero () and the redshift dispersion and mean absolute deviation , fairly constant with redshift. These values can be considered as a lower limit to the redshift uncertainty.

| ID(V1) | zspec | class. | Quality | comments | ||
|---|---|---|---|---|---|---|
| GDS J033206.44-274728.8 | 21.07 | 0.70 | 1.022 | comp. | A | [OII], CaHK, MgI |
| GDS J033210.73-274819.4 | 24.33 | 0.96 | 1.396 | em. | C | faint, [OII] |
| GDS J033210.79-274719.8 | 25.64 | 0.06 | - | - | X | faint(line@8069A?) |
| GDS J033210.92-274722.8 | 19.98 | 0.29 | 0.417 | em. | B | CaH, g-band, [OIII], Na, H |
| GDS J033210.93-274721.5 | 22.19 | 1.00 | 1.222 | abs. | A | CaHK, MgI, H |
| GDS J033212.00-275104.2 | 23.00 | 0.85 | 1.018 | comp. | A | [OII], CaHK, g-band |
| GDS J033212.47-274621.4 | 24.06 | 1.03 | - | - | X | faint |
| GDS J033212.61-274605.1 | 24.05 | 0.53 | 1.378 | em. | A | [OII], MgI |
| GDS J033212.79-274823.1 | 23.03 | 0.45 | 1.316 | em. | A | [OII], MgII, (CaHK faint) |
| GDS J033213.53-274917.0 | 23.92 | 0.45 | - | - | X | faint |
| GDS J033214.05-275124.5 | 22.69 | 0.74 | 1.220 | em. | A | [OII], MgII |
| GDS J033214.33-274825.2 | 24.91 | -0.012 | - | - | X | featureless continuum |
| GDS J033214.38-274825.9 | 27.14 | 0.24 | - | - | X | faint |
| GDS J033214.69-275258.2 | 23.82 | 0.24 | 1.101 | em. | A | [OII] |
| GDS J033214.71-275257.2 | 24.27 | 0.48 | 1.360 | em. | B | [OII]? |
| GDS J033214.81-274600.0 | 24.24 | 0.54 | 1.370 | em. | C | [OII]? |
| GDS J033214.93-274659.8 | 23.75 | 0.12 | - | - | X | abs@7080A |
| GDS J033215.01-274633.4 | 23.68 | 0.45 | 1.000 | abs. | C | D4000 break? |
| GDS J033215.09-275130.7 | 24.31 | 0.32 | 1.229 | em. | A | [OII] |
| GDS J033215.88-274723.1 | 21.75 | 0.28 | 0.896 | em. | A | [OII], H, TILT |
| GDS J033216.02-274750.0 | 22.83 | 0.96 | 1.298 | comp. | B | CaHK, [OII](line6255?) |
| GDS J033216.17-275241.4 | 22.55 | 0.78 | 1.094 | abs. | B | CaHK, g-band, MgI-noisy |
| GDS J033216.28-274955.5 | 23.72 | 0.41 | - | - | X | featureless continuum |
| GDS J033216.34-275013.4 | 23.25 | 0.52 | 1.046 | comp. | A | [OII](Sky-ABS), CaHK |
| GDS J033216.37-275201.3 | 23.28 | 0.11 | - | - | X | bright, abs@6271,6982,7100 |
| GDS J033216.69-275239.0 | 22.57 | 0.88 | 1.045 | abs. | A | CaHK, g-band |
| GDS J033216.91-274808.3 | 25.37 | 0.37 | - | - | X | faint |
| GDS J033216.95-274519.3 | 23.61 | 0.78 | 1.303 | em. | A | [OII] |
| GDS J033216.98-275102.4 | 23.54 | 0.40 | 0.991 | em. | A | [OII], [OIII], H |
| GDS J033217.29-274807.5 | 21.97 | 0.45 | 0.735 | abs. | A | CaHK |
| GDS J033217.29-275113.2 | 22.73 | 0.85 | - | - | X | bad-row, featureless? |
| GDS J033217.31-275025.0 | 23.50 | 0.19 | 1.612 | em. | A | [OII] |
| GDS J033217.34-274844.3 | 24.88 | 0.35 | 1.107 | em. | C | [OII], faint |
| GDS J033217.46-275234.8 | 21.93 | 0.96 | 1.100 | abs. | A | CaHK, MgI |
| GDS J033217.47-274838.4 | 22.20 | 0.18 | 0.737 | em. | A | [OII], [OIII], H |
| GDS J033217.48-275248.0 | 21.82 | 1.08 | 1.095 | abs. | A | CaHK, g-band |
| GDS J033217.56-274709.2 | 24.01 | 0.43 | - | - | X | faint |
| GDS J033217.56-274810.1 | 24.36 | 0.13 | 0.542 | em. | C | [OII]?-faint |
| GDS J033217.62-275228.5 | 21.18 | 0.78 | 1.098 | comp. | A | CaHK, MgI, g-band, AlII, [OII] |
| GDS J033217.63-274811.8 | 22.57 | 0.52 | 0.735 | em. | A | [OII], CaHK, [OIII] |
| GDS J033217.77-274603.0 | 24.23 | 0.91 | - | - | X | faint |
| GDS J033217.78-274823.8 | 22.57 | 0.08 | 0.117 | em. | B | H,[OIII] |
| GDS J033217.80-275256.9 | 24.30 | 0.50 | 1.044 | em. | B | [OII]?(SKY.ABS) |
| GDS J033217.91-274122.7 | 22.10 | 0.96 | 1.041 | abs. | A | CaHK, MgI |
| GDS J033217.94-274721.5 | 20.04 | 0.53 | 0.732 | abs. | A | CaHK, g-band, MgI, H, H, AlII |
| GDS J033218.01-274718.5 | 19.41 | 0.61 | 0.735 | comp. | A | [OII], CaHK(noisy) |
| GDS J033218.03-274850.3 | 23.20 | 0.18 | 0.297 | em. | A | [OIII], H, H |
| GDS J033218.07-274845.7 | 23.19 | 0.75 | 0.000 | star | B | star Flux-radius = 1.261 |
| GDS J033218.19-274746.6 | 23.74 | 1.49 | 0.000 | star | B | star Flux-radius = 1.256 |
| GDS J033218.24-274744.0 | 23.63 | 0.39 | - | - | X | featureless continuum |
| GDS J033218.58-274619.0 | 23.71 | 0.56 | 1.435 | em. | A | [OII] |
| GDS J033218.61-274705.1 | 23.16 | 0.41 | 1.380 | em. | A | [OII], MgII |
| GDS J033218.67-274915.7 | 24.18 | 0.28 | - | - | X | faint,line@8200A? |
| GDS J033218.70-274919.8 | 22.69 | 0.77 | 1.038 | comp. | A | [OII], CaHK |
| GDS J033218.78-274951.3 | 23.82 | 0.44 | 1.294 | em. | A | [OII], noisy |
| GDS J033218.79-274820.8 | 23.41 | 0.30 | 0.999 | em. | B | [OII] |
| GDS J033218.81-274908.5 | 23.90 | 0.43 | 1.128 | em. | B | [OII]? |
| GDS J033218.81-274910.0 | 23.20 | 0.34 | 0.735 | comp. | A | [OII], CaHK |
| GDS J033219.15-274040.2 | 21.11 | 1.14 | 1.128 | abs. | A | CaHK, MgI, g-band, bright |
| GDS J033219.23-274545.5 | 23.44 | 1.35 | 0.000 | star | C | star? Flux-radius = 1.239 |
| GDS J033219.30-275219.3 | 22.00 | 1.14 | 1.096 | abs. | A | CaHK, MgI, g-band |
| ID(V1) | zspec | class. | Quality | comments | ||
|---|---|---|---|---|---|---|
| GDS J033219.43-274928.2 | 23.90 | 0.58 | 1.048 | em. | B | [OII](SKY.ABS) |
| GDS J033219.48-274216.8 | 20.29 | 0.31 | 0.382 | comp. | A | CaHK, low-z |
| GDS J033219.61-274831.0 | 21.87 | 0.10 | 0.671 | em. | A | [OII], [OIII], H |
| GDS J033219.68-275023.6 | 20.50 | 0.25 | 0.559 | comp. | A | [OII], CaHK, [OIII], H |
| GDS J033219.77-274204.0 | 23.34 | 0.86 | 1.044 | comp. | A | [OII], CaHK |
| GDS J033219.79-274609.9 | 24.11 | 0.88 | 1.221 | em. | A | [OII], MgI |
| GDS J033219.79-274839.3 | 23.55 | 0.52 | 1.357 | em. | A | [OII] |
| GDS J033219.89-274517.8 | 24.00 | 0.15 | - | - | X | bright, abs@8176,6716Å |
| GDS J033219.96-274449.8 | 22.35 | 0.24 | 0.783 | em. | C | [OII]? |
| GDS J033219.97-274547.6 | 23.94 | 0.47 | 1.219 | em. | A | [OII] |
| GDS J033219.99-274443.2 | 24.43 | 0.23 | - | - | X | faint |
| GDS J033220.02-274104.2 | 21.51 | 0.52 | 0.682 | abs. | A | CaHK, g-band, MgI |
| GDS J033220.11-275329.8 | 24.44 | 0.75 | 1.385 | em. | C | [OII]? |
| GDS J033220.28-275233.0 | 22.22 | 0.92 | 1.119 | abs. | A | CaHK, MgI, g-band |
| GDS J033220.29-274718.2 | 23.94 | 0.32 | - | - | X | faint, noisy |
| GDS J033220.41-274641.7 | 24.15 | 0.35 | 1.227 | em. | A | [OII] |
| GDS J033220.72-274932.6 | 24.16 | 0.80 | - | - | X | faint |
| GDS J033220.91-275344.0 | 22.99 | 0.71 | 1.044 | em. | B | [OII](SKY.ABS), CaHK |
| GDS J033221.22-274625.9 | 23.48 | 0.50 | 1.221 | em. | A | [OII] |
| GDS J033221.57-274941.6 | 23.01 | 0.61 | 1.110 | em. | A | [OII] |
| GDS J033221.63-274800.2 | 24.35 | 0.08 | - | - | X | featureless continuum |
| GDS J033221.67-274056.0 | 22.75 | 0.65 | 1.045 | em. | B | [OII](SKY.ABS), CaHK |
| GDS J033221.76-274442.1 | 20.86 | 0.18 | 0.295 | em. | A | H, [OIII], H |
| GDS J033221.81-274352.3 | 24.27 | 0.58 | 1.308 | em. | B | [OII] |
| GDS J033221.84-274434.4 | 24.81 | 0.36 | - | - | X | faint |
| GDS J033221.99-274655.9 | 20.42 | 0.47 | 0.670 | comp. | A | [OII], CaHK, g-band |
| GDS J033222.18-274659.7 | 25.00 | 1.04 | - | - | X | faint |
| GDS J033222.36-275018.4 | 22.82 | 0.27 | 0.736 | em. | B | [OII] |
| GDS J033222.41-274858.0 | 24.19 | 0.46 | 1.383 | em. | A | [OII], MgI, MgII |
| GDS J033222.47-275047.4 | 24.38 | 1.79 | 0.000 | star | C | star? Flux-radius = 1.307 |
| GDS J033222.54-274603.8 | 24.32 | 0.25 | - | - | X | faint(line@9400Å?) |
| GDS J033222.58-274425.8 | 20.28 | 0.33 | 0.738 | comp. | A | [OII], H, CaHK,MgI |
| GDS J033222.93-274919.1 | 24.77 | 0.51 | 1.298 | em. | B | [OII]? |
| GDS J033222.93-275104.6 | 22.89 | 0.38 | 0.905 | em. | A | [OII], H |
| GDS J033223.17-274219.6 | 23.82 | 0.78 | - | - | X | faint(abs@8157,9200) |
| GDS J033223.18-274921.5 | 24.08 | 0.55 | 1.109 | em. | B | [OII] |
| GDS J033223.26-275101.8 | 21.90 | 0.85 | 0.964 | abs. | A | CaHK, g-band |
| GDS J033223.28-274744.7 | 23.94 | 0.24 | 0.764 | em. | B | [OII] |
| GDS J033223.29-274742.6 | 24.31 | 0.41 | 1.092 | em. | A | [OII], CaK |
| GDS J033223.40-274316.6 | 20.48 | 0.33 | 0.615 | comp. | A | [OII], CaHK, g-band, H, [OIII] |
| GDS J033223.45-274709.0 | 23.22 | 0.49 | 1.423 | em. | A | [OII], MgII |
| GDS J033223.61-274601.0 | 22.57 | 1.06 | 1.033 | em. | A | [OII], red |
| GDS J033223.61-275306.3 | 22.30 | 0.85 | 1.125 | abs. | C | CaHK? (noisy) |
| GDS J033223.69-275324.4 | 20.41 | 0.40 | 0.532 | comp. | A | [OIII], H |
| GDS J033223.83-274639.4 | 24.19 | 0.84 | 1.222 | em. | B | [OII] |
| GDS J033223.90-275326.2 | 23.81 | 1.07 | - | - | X | faint |
| GDS J033224.01-275039.0 | 22.74 | 0.98 | 1.094 | abs. | A | CaHK,MgI |
| GDS J033224.08-275214.6 | 23.56 | 0.92 | 1.015 | em. | C | [OII]?, g-band? |
| GDS J033224.11-274102.1 | 23.36 | 0.88 | 0.000 | star | A | star Flux-radius = 1.247 |
| GDS J033224.20-274257.5 | 24.15 | 0.32 | - | - | X | featureless continuum |
| GDS J033224.20-274952.9 | 23.61 | 0.21 | - | - | X | diffuse, faint |
| GDS J033224.26-274126.4 | 20.18 | 0.44 | 0.533 | comp. | A | [OII], [OIII], H, g-band |
| GDS J033224.37-274315.2 | 24.63 | -0.06 | 1.271 | em. | C | [OII]? |
| GDS J033224.39-274624.3 | 21.92 | 0.76 | 0.895 | abs. | A | CaHK, [OII] faint, (short-slit) |
| GDS J033224.66-275051.9 | 22.40 | -0.28 | 0.272 | em. | C | H, Mg? |
| GDS J033224.72-274120.4 | 21.17 | 0.80 | 0.967 | abs. | A | CaHK, g-band, MgI, AlII |
| GDS J033224.79-274912.9 | 24.90 | 1.61 | 0.000 | star | C | continuum+break, Flux-radius = 1.284 |
| GDS J033224.85-275052.6 | 23.24 | 0.61 | 1.329 | em. | A | [OII] |
| GDS J033224.90-274715.0 | 24.65 | 0.71 | - | - | X | faint |
| GDS J033224.91-274923.7 | 23.87 | 0.08 | - | - | X | featureless bright continuum |
| ID(V1) | zspec | class. | Quality | comments | ||
| GDS J033225.04-274718.2 | 23.86 | 0.51 | 1.357 | em. | A | [OII], MgII |
| GDS J033225.10-274219.5 | 23.65 | 1.09 | 1.609 | em. | B | [OII] |
| GDS J033225.19-274735.3 | 23.90 | 0.60 | 1.017 | em. | B | [OII], faint |
| GDS J033225.20-275009.4 | 22.88 | 0.95 | 1.100 | abs. | B | CaHK, AlII |
| GDS J033225.21-275335.0 | 21.17 | 0.72 | 0.833 | comp. | A | [OII], [OIII], CaHK, H, (noisy) |
| GDS J033225.35-274502.8 | 22.58 | 0.16 | 0.975 | em. | A | [OII], H, [OIII] |
| GDS J033225.47-274327.6 | 20.14 | 0.51 | 0.668 | abs. | A | CaHK, [OII], AlII |
| GDS J033225.48-275211.6 | 23.68 | 0.39 | 1.312 | em. | B | [OII] |
| GDS J033225.54-275209.1 | 22.93 | 0.45 | 0.955 | em. | B | [OII]?, noisy |
| GDS J033225.55-275108.2 | 23.93 | 0.30 | 0.832 | em. | A | [OII], [OIII], H |
| GDS J033225.58-274529.0 | 24.33 | 0.15 | 0.667 | em. | A | [OII], [OIII] |
| GDS J033225.69-274347.1 | 24.73 | 1.01 | - | - | X | faint |
| GDS J033225.76-274347.0 | 23.02 | 1.11 | - | - | X | noisy, bad-row |
| GDS J033225.77-274247.7 | 24.26 | 0.62 | 1.026 | em. | B | [OII](SKY.ABS) |
| GDS J033225.79-274352.3 | 23.17 | 0.58 | 1.297 | em. | A | [OII], CaHK |
| GDS J033225.86-275019.7 | 21.54 | 0.48 | 1.095 | em. | A | bright [OII], TILT |
| GDS J033225.90-274341.2 | 18.92 | 0.88 | 0.000 | star | C | star? Flux-radius = 1.296 |
| GDS J033226.00-274150.6 | 21.75 | 0.23 | 0.545 | comp. | A | [OII], H, CaHK |
| GDS J033226.03-275147.7 | 22.98 | 0.53 | 1.242 | em. | A | [OII], MgI |
| GDS J033226.16-274946.5 | 23.09 | 0.52 | 0.735 | comp. | A | [OII], CaHK |
| GDS J033226.17-274603.6 | 24.25 | 0.54 | 1.219 | em. | B | [OII] |
| GDS J033226.24-275005.6 | 23.68 | 0.73 | 1.096 | em. | B | [OII] |
| GDS J033226.26-274209.6 | 23.96 | 0.53 | 0.932 | em. | B | [OII] |
| GDS J033226.31-274722.4 | 22.48 | 0.23 | 0.737 | em. | A | [OII], H, [OIII] |
| GDS J033226.32-274232.3 | 23.86 | 0.24 | 0.736 | em. | B | [OII] |
| GDS J033226.40-274228.2 | 23.33 | 0.42 | 1.615 | em. | A | [OII], MgII |
| GDS J033226.49-274035.5 | 19.60 | 0.19 | - | - | X | faint |
| GDS J033226.64-274028.2 | 21.22 | 0.21 | 0.310 | em. | A | low-z, H, [OIII] |
| GDS J033226.66-274025.1 | 21.70 | 0.29 | 1.042 | em. | C | [OII]?(SKY.ABS) |
| GDS J033226.66-274029.8 | 22.06 | 0.89 | 1.040 | abs. | A | CaHK, g-band, MgI |
| GDS J033226.67-274758.8 | 21.81 | 0.20 | 0.628 | em. | C | H, [OIII]? |
| GDS J033226.67-274834.8 | 23.59 | 0.55 | 0.905 | abs. | C | D4000break? |
| GDS J033226.84-274545.3 | 23.47 | 0.52 | 1.306 | em. | A | [OII] |
| GDS J033226.89-274541.9 | 23.72 | 0.13 | 0.338 | em. | A | [OII], H, [OIII], H |
| GDS J033226.92-274239.8 | 22.95 | 0.37 | - | - | X | featureless? |
| GDS J033227.02-274407.2 | 22.15 | 0.84 | 1.128 | comp. | A | [OII], CaHK |
| GDS J033227.05-275318.4 | 22.25 | 0.70 | 1.103 | comp. | A | [OII], CaHK |
| GDS J033227.07-274404.7 | 22.24 | 0.16 | 0.739 | em. | A | [OII], H, [OIII] |
| GDS J033227.11-274922.0 | 22.88 | -0.01 | 0.559 | em. | A | [OII], H, [OIII], H |
| GDS J033227.17-274957.8 | 23.26 | 0.51 | 1.293 | em. | A | [OII], CaHK |
| GDS J033227.36-274204.8 | 21.26 | 0.53 | 0.735 | comp. | A | CaHK, MgI, AlII, g-band |
| GDS J033227.58-274051.7 | 23.43 | 0.94 | 1.070 | em. | C | faint, [OII]? |
| GDS J033227.70-274043.7 | 21.64 | 0.86 | 0.968 | abs. | A | CaHK, g-band, AlII |
| GDS J033227.72-275040.8 | 21.42 | 0.74 | 1.097 | comp. | A | [OII], CaHK |
| GDS J033227.84-274136.8 | 21.97 | 0.91 | 1.043 | abs. | A | CaHK, g-band, MgI, AlII |
| GDS J033227.88-275140.4 | 20.26 | 0.40 | 0.521 | abs. | A | CaHK, g-band |
| GDS J033228.09-275202.4 | 20.29 | 0.41 | 0.560 | abs. | A | g-band, Na, Mg, [OIII] |
| GDS J033228.42-274700.2 | 24.31 | 0.19 | - | - | X | faint, abs@7060 |
| GDS J033228.44-274703.7 | 20.86 | 0.47 | - | - | X | noisy |
| GDS J033228.45-274419.3 | 22.78 | 0.50 | 1.135 | em. | A | [OII], MgII |
| GDS J033228.48-274059.6 | 23.82 | 0.49 | - | - | X | featureless continuum |
| GDS J033228.56-274055.7 | 25.44 | 0.07 | - | - | X | faint |
| GDS J033228.84-274132.7 | 25.43 | 0.01 | 4.800 | em. | C | ? No continuum |
| GDS J033228.88-274129.3 | 20.72 | 0.53 | 0.733 | comp. | A | [OII], CaHK, MgI, g-band, H, H |
| GDS J033228.94-274600.6 | 23.82 | 0.98 | - | - | X | abs@8555,8150,9200? |
| GDS J033228.94-274128.2 | - | - | 4.882 | em. | B | , (SiIV?) |
| GDS J033228.99-274908.4 | 20.56 | 0.73 | 1.095 | abs. | A | CaHK, MgI, g-band |
| GDS J033229.07-274153.1 | 24.27 | 0.44 | - | - | X | faint |
| GDS J033229.22-274707.6 | 20.65 | 0.51 | 0.668 | abs. | A | CaHK, g-band |
| GDS J033229.32-274054.0 | 23.74 | 0.74 | - | - | X | short-slit |
| not present in the catalog v1.0 | ||||||
| ID(V1) | zspec | class. | Quality | comments | ||
| GDS J033229.35-275048.5 | 20.10 | 0.30 | 0.415 | abs. | A | H, Mg, Na |
| GDS J033229.48-274036.7 | 24.04 | 0.42 | 1.221 | em. | C | [OII]? |
| GDS J033229.63-274511.3 | 24.07 | 0.70 | 1.033 | em. | A | [OII], MgI, CaH |
| GDS J033229.65-274524.7 | 24.20 | 0.73 | - | - | X | faint |
| GDS J033229.71-274507.2 | 22.24 | 0.17 | 0.736 | em. | A | [OII], H, [OIII] |
| GDS J033229.75-275147.1 | 23.25 | 0.54 | 1.315 | em. | A | [OII] |
| GDS J033229.85-274520.5 | 21.01 | 0.56 | 0.953 | em. | A | [OII], AlII |
| GDS J033229.87-274317.7 | 22.73 | 0.79 | 1.097 | comp. | B | CaHK, faint [OII] |
| GDS J033229.99-274322.6 | 24.42 | 0.98 | - | - | X | faint |
| GDS J033230.03-275026.8 | 23.43 | 0.83 | 1.005 | abs. | B | CaHK, MgII, g-band |
| GDS J033230.06-274523.5 | 21.81 | 0.50 | 0.955 | em. | A | [OII] |
| GDS J033230.07-274319.0 | 21.59 | 0.64 | 1.101 | comp. | B | [OII], CaHK |
| GDS J033230.09-275100.3 | 20.80 | 0.52 | 0.733 | abs. | A | CaHK, g-band, MgI, AlII, H, H |
| GDS J033230.23-274519.9 | 23.14 | 0.09 | 0.523 | em. | A | [OII] |
| GDS J033230.34-274523.6 | 21.92 | 0.07 | 1.223 | comp. | A | faint [OII], CaHK, MgI |
| GDS J033230.51-275004.4 | 23.85 | 1.03 | - | - | X | faint |
| GDS J033230.70-274928.7 | 22.69 | 0.16 | - | - | X | faint |
| GDS J033230.71-274617.2 | 22.24 | 0.66 | 1.307 | em. | A | [OII], TILT |
| GDS J033230.75-274306.9 | 23.25 | 0.25 | 0.860 | em. | A | [OII], H |
| GDS J033230.83-274931.8 | 23.19 | 0.79 | - | - | X | abs@7150,9056? (noisy) |
| GDS J033230.85-274621.7 | 21.60 | 0.74 | 1.018 | comp. | A | CaHK, [OII] |
| GDS J033230.98-274434.9 | 23.71 | 0.50 | 1.222 | em. | A | [OII] |
| GDS J033231.04-274050.2 | 21.74 | 0.77 | 1.037 | abs. | A | CaHK, g-band, MgI |
| GDS J033231.22-274052.2 | 22.86 | 0.58 | 1.333 | em. | B | [OII], noisy |
| GDS J033231.22-274532.7 | 22.98 | 1.00 | 1.097 | abs. | A | CaHK, g-band |
| GDS J033231.28-274820.2 | 23.10 | 0.65 | 1.173 | comp. | A | [OII] |
| GDS J033231.42-274324.1 | 23.01 | 0.82 | 1.025 | em. | B | [OII](SKY.ABS) |
| GDS J033231.45-274435.0 | 17.90 | 0.49 | 0.000 | star | A | star Flux-radius = 1.299 |
| GDS J033231.55-275028.8 | 23.96 | 0.68 | - | - | X | faint red |
| GDS J033231.65-274504.8 | 23.16 | 0.54 | 1.098 | em. | A | [OII], MgI, CaHK, H, H |
| GDS J033232.04-274451.7 | 21.59 | 0.68 | 0.895 | abs. | A | CaHK |
| GDS J033232.08-274119.4 | 22.59 | 0.53 | 1.036 | em. | B | [OII](SKY.ABS) |
| GDS J033232.08-274155.2 | 23.00 | 0.39 | 0.960 | abs. | C | abs@7000,6400,7800 |
| GDS J033232.12-274359.3 | 24.66 | 0.18 | - | - | X | faint (line at 6217A?) |
| GDS J033232.14-274349.9 | 23.12 | 0.36 | 0.973 | em. | A | [OII] |
| GDS J033232.32-274343.6 | 22.80 | 0.07 | 0.533 | em. | C | [OIII] |
| GDS J033232.33-274345.8 | 23.95 | 0.42 | 1.025 | em. | B | [OII] |
| GDS J033232.58-275053.9 | 21.61 | 0.21 | 0.669 | em. | B | [OII], H |
| GDS J033232.73-274538.8 | 21.69 | 0.31 | - | - | X | short-slit(line5900A) |
| GDS J033232.73-275102.5 | 20.78 | 0.58 | 0.735 | abs. | A | CaHK, g-band |
| GDS J033232.94-274543.9 | - | - | 0.957 | em. | A | [OII] |
| GDS J033232.96-274545.7 | 19.84 | 0.33 | 0.366 | abs. | A | N[II]+abs.spec. |
| GDS J033233.00-275030.2 | 20.85 | 0.44 | 0.669 | em. | A | [OII], [OIII], H |
| GDS J033233.01-274829.4 | 22.80 | 0.12 | 0.664 | em. | A | [OIII], H |
| GDS J033233.02-274547.4 | 21.13 | 0.63 | 0.953 | abs. | B | CaHK, [OII] |
| GDS J033233.08-275123.9 | 21.39 | 0.47 | 0.735 | abs. | A | CaHK |
| GDS J033233.25-274117.4 | 24.06 | 0.86 | - | - | X | continuum, faint |
| GDS J033233.28-274236.0 | 24.55 | 1.09 | 1.215 | em. | B | [OII], faint red (XCDFS265) |
| GDS J033233.41-274230.5 | 23.37 | 0.06 | 0.975 | em. | B | [OII] |
| GDS J033233.71-274210.2 | 23.71 | 0.46 | 1.043 | em. | B | [OII](SKY.ABS), TILT |
| GDS J033233.82-274410.0 | 21.11 | 0.42 | 0.667 | abs. | A | CaHK, g-band |
| GDS J033233.85-274600.2 | 23.82 | 1.05 | 1.910 | abs. | B | MgII |
| GDS J033234.00-274412.1 | 23.70 | 0.53 | 0.896 | em. | B | [OII], CaHK? |
| GDS J033234.05-274937.8 | 22.91 | 0.71 | 0.832 | comp. | A | [OII], CaHK |
| GDS J033234.08-274222.3 | 23.91 | 0.72 | 1.476 | em. | B | [OII] |
| GDS J033234.82-274835.5 | 22.94 | 0.66 | 1.245 | em. | A | [OII], CaHK |
| GDS J033234.85-274640.4 | 22.70 | 0.61 | 1.099 | em. | A | [OII] |
| GDS J033235.08-274615.7 | 23.11 | 0.63 | 1.316 | em. | A | [OII] |
| GDS J033235.11-275009.0 | 24.17 | 0.44 | 1.295 | em. | A | [OII] |
| not present in the catalog v1.0 | ||||||
| ID(V1) | zspec | class. | Quality | comments | ||
|---|---|---|---|---|---|---|
| GDS J033235.19-275103.4 | 24.41 | 0.23 | 0.981 | em. | B | [OII]? |
| GDS J033235.26-275104.8 | 22.79 | 0.44 | 0.734 | abs. | A | CaHK, H, MgI |
| GDS J033235.78-274627.5 | 22.76 | 0.89 | 1.094 | comp. | A | [OII], CaHK |
| GDS J033235.79-274734.7 | 23.65 | 0.88 | 1.223 | em. | A | [OII], [NeIII] |
| GDS J033236.04-275004.3 | 23.40 | 0.81 | 1.612 | em. | A | [OII], MgII |
| GDS J033236.39-274747.0 | 23.18 | 0.17 | - | - | X | abs@6500,6586 |
| GDS J033236.43-274750.6 | 22.41 | 0.13 | 0.127 | em. | B | H, [OI]6300Å, Na |
| GDS J033237.19-274608.1 | 20.90 | 1.07 | 1.096 | abs. | A | CaHK |
| GDS J033237.26-274610.3 | 22.17 | 0.19 | 0.736 | comp. | A | [OII], CaHK |
| GDS J033237.56-274646.7 | 24.89 | 0.78 | - | - | X | abs@8195, em@8949? |
| GDS J033238.27-274604.0 | 24.46 | 1.07 | - | - | X | faint |
| GDS J033238.49-274702.4 | 21.26 | 0.76 | 0.953 | abs. | A | CaHK, MgI |
| GDS J033239.01-274722.7 | 24.40 | 0.40 | - | - | X | faint |
| GDS J033239.35-275016.3 | 22.05 | 0.42 | - | - | X | smoothly-red |
| GDS J033239.56-274851.7 | 22.55 | 0.81 | 0.000 | star | C | star Flux-radius = 1.269 |
| GDS J033239.60-274909.6 | 20.72 | 0.89 | 0.980 | abs. | A | CaHK, g-band, AlII |
| GDS J033239.64-274709.1 | 22.70 | 0.99 | 1.317 | comp. | A | [OII], CaHK, MgI |
| GDS J033239.67-274850.6 | 24.55 | 0.21 | - | - | X | featureless continuum |
| GDS J033239.99-275114.2 | 23.75 | 0.62 | - | - | X | lines:8210,8800? |
| GDS J033240.01-274815.0 | 25.33 | 1.44 | 5.828 | em. | A | |
| GDS J033240.67-275032.3 | 24.56 | 0.21 | - | - | X | bad-row, faint |
| GDS J033240.79-275035.1 | 21.69 | 0.12 | 0.213 | em. | A | H, S[II], (2d-order-light) |
| GDS J033240.92-274823.8 | 24.00 | 0.45 | 1.244 | em. | B | [OII]? |
| GDS J033241.21-274932.4 | 24.26 | 0.94 | - | - | X | faint |
| GDS J033241.41-274457.5 | 23.02 | 0.80 | - | em. | X | em.lines@6815,8208 |
| GDS J033241.48-274440.4 | 23.00 | 0.84 | 1.296 | em. | B | [OII], faint |
| GDS J033241.59-275003.0 | 22.32 | 0.66 | 0.000 | star | B | compact, Flux-radius = 1.279 |
| GDS J033241.67-274448.7 | 23.83 | 0.14 | - | - | X | faint, short-slit |
| GDS J033241.76-274619.4 | 20.93 | 0.35 | 0.333 | em. | C | low-z, H |
| GDS J033242.07-274911.6 | 23.42 | 1.30 | 0.000 | star | B | star Flux-radius = 1.253 |
| GDS J033242.21-274953.9 | 23.83 | 0.37 | 1.377 | em. | A | [OII], MgI |
| GDS J033242.25-274625.4 | 22.50 | 0.63 | 1.288 | em. | A | [OII], MgII |
| GDS J033242.32-274950.3 | 20.33 | 0.29 | - | - | X | noisy |
| GDS J033242.38-274707.6 | 23.18 | 1.11 | 1.314 | abs. | B | [OII], CaHK |
| GDS J033242.56-274550.2 | 22.21 | 0.16 | 0.218 | em. | A | [OIII], H, H |
| GDS J033242.97-274649.9 | 23.44 | 0.89 | - | - | X | faint |
| GDS J033244.18-274729.4 | 23.55 | 0.44 | 1.220 | em. | A | [OII] |
| GDS J033244.20-274733.5 | 21.53 | 0.20 | 0.737 | em. | A | [OII], [OIII], H |
| GDS J033244.23-275039.5 | 24.72 | 0.40 | 1.122 | em. | B | [OII]? |
| GDS J033244.29-275009.7 | 22.62 | 0.86 | 1.038 | abs. | A | CaHK, g-band |
| GDS J033244.43-274641.8 | 22.55 | 0.13 | 0.215 | em. | C | H? |
| GDS J033244.62-274632.2 | 23.20 | 0.44 | 1.426 | em. | A | [OII], MgII |
| GDS J033244.80-274920.6 | 23.69 | 0.84 | - | - | X | faint |
| GDS J033245.15-274940.0 | 21.92 | 1.04 | 1.123 | abs. | A | CaHK, g-band, MgI |
| GDS J033245.21-274858.0 | 24.65 | 0.51 | 1.463 | em. | A | [OII] |
| GDS J033245.90-274517.2 | 23.79 | 0.39 | 1.036 | em. | A | [OII], CaHK |
| GDS J033247.45-274603.9 | 23.98 | 0.51 | - | - | X | faint |
| GDS J033248.56-274504.6 | 22.19 | 0.88 | 1.115 | abs. | C | CaHK, noisy |
| GDS J033249.04-275015.5 | 22.36 | 0.80 | 1.122 | em. | B | [OII] |
| GDS J033249.09-274519.2 | 21.46 | 0.37 | - | - | X | featureless continuum |
| GDS J033249.11-274524.2 | 21.81 | 0.60 | 1.094 | em. | A | [OII], H-faint |
| GDS J033249.49-274534.2 | 23.94 | 0.17 | 1.609 | em. | A | [OII] |
| GDS J033249.85-274757.8 | 22.78 | 0.67 | 1.146 | em. | B | [OII]? |
| GDS J033250.69-274732.2 | 23.51 | -0.02 | - | - | X | em@7100A, abs8100A |
| GDS J033251.34-274742.7 | 24.09 | 0.76 | 1.298 | em. | B | [OII], noisy |
| GDS J033251.57-275044.7 | 22.48 | 0.52 | 0.980 | comp. | A | [OII], H |
| GDS J033252.87-275114.7 | 21.20 | 0.63 | 1.002 | comp. | A | CaHK, [OII] |
| GDS J033252.88-275119.8 | 21.84 | 0.47 | 1.220 | em. | A | [OII], CaHK |
| GDS J033253.01-275000.5 | 24.05 | 0.09 | - | - | X | faint |
| GDS J033253.34-275104.6 | 25.50 | -0.08 | 0.912 | em. | C | noisy, [OII]? |
| GDS J033255.00-275051.6 | 21.70 | 0.37 | - | - | X | featureless continuum |
5 Discussion
5.1 Reliability of the redshift - comparison with VVDS
A practical way to assess the reliability of the redshifts reported in Table LABEL:tab:tblspec is to compare the present results with independent measurements of other surveys. From this point of view the recent release of the data of the VIMOS-VLT Deep Survey (VVDS, Le Fevre et al. (2004)) is particularly important. There are 39 VVDS objects in common with the first release of the FORS2 GOODS survey and Figure 5 shows the comparison of the redshift determinations. The reliability level of the redshift measurements in the VVDS is indicated by a quality flag. Flags 2, 3, 4 are the most secure with a confidence of 75, 95 and 100 respectively. Flag 1 is an indicative measurement, flag 9 indicates that there is only one secure emission line, and flag 0 indicates a measurement failure with no features identified.
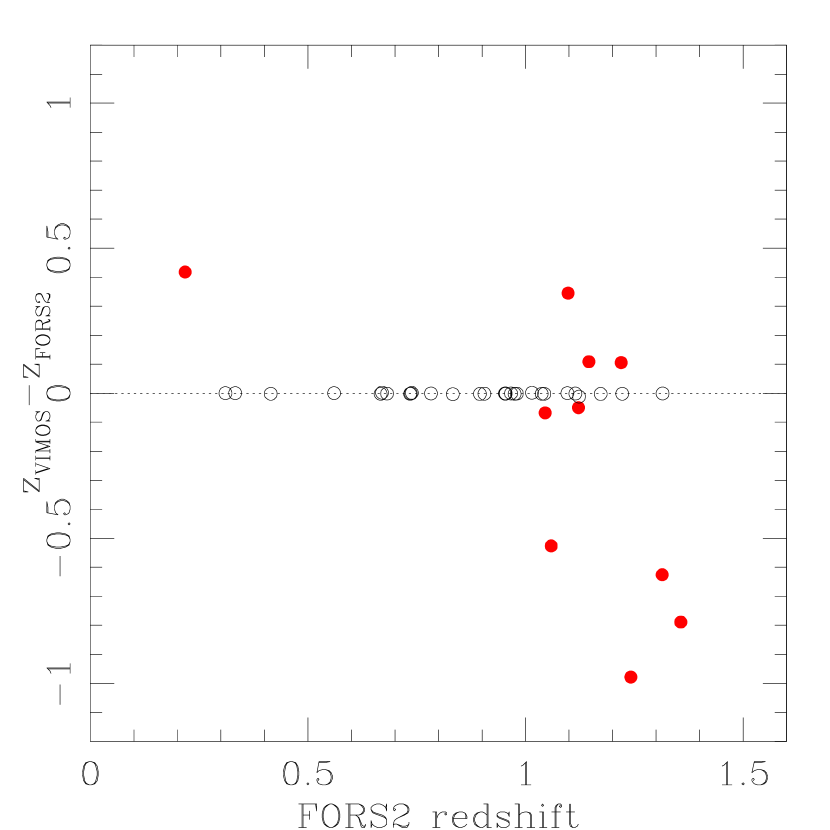
For 29 cases out of 39 (74) the agreement is very good, with a mean difference = 0.0016 0.0021.
Assuming equipartition of the redshift uncertainties between FORS2 and VVDS, we can estimate a , in reasonable agreement with the estimate of Sect. 4. In the following we will assume a typical uncertainty of the redshift determinations of the present survey to be (excluding “catastrophic” discrepancies).
Ten cases show “catastrophic” discrepancies, i.e. greater than 0.015 and are reported in Table LABEL:tab:FORS2vsVIMOS.
In the following we discuss case by case the origin of the discrepancy:
-
1.
GDS J033214.05-275124.5:
-
•
FORS2: the emission line [O ii]3727 and the absorption lines Ca H and K are detected in the FORS2 spectrum at z=1.220. The absorption line MgII 2798 is also present at 6210Å. The 4000Å Balmer Break is also evident, quality flag “A”.
-
•
VVDS: the main emission feature in the VIMOS spectrum is identified with [O ii]3727 at z=1.325, quality flag 3. We note an absorption feature in the VIMOS spectrum (without identification) at 6200Å, consistent with the one measured in the FORS2 spectrum.
-
•
-
2.
GDS J033219.79-274839.3:
-
•
FORS2: flat continuum with an evident emission line at 8784Å. We interpret it as [O ii]3727. No spectroscopic feature is observed at 6500Å. Quality flag A.
-
•
VVDS: the main feature in the VIMOS spectrum is identified with [O iii]5007 at z=0.568 (emission line at 7851Å), quality flag 2.
-
•
-
3.
GDS J033221.67-274056.0:
-
•
FORS2: the emission line [O ii]3727 and the absorption lines Ca H and K are detected in the FORS2 spectrum at , quality flag “B”. The [O ii]3727 line is attenuated by the sky absorption band at 7600Å.
-
•
VVDS: Ca H and K are identified in the VIMOS spectrum at z=0.977, quality flag 1.
-
•
-
4.
GDS J033226.03-275147.7:
-
•
FORS2: the emission line [O ii]3727 (at 8356Å) and the absorption lines Ca H and K, MgI and B2630 are detected in the FORS2 spectrum at , quality flag “A”.
-
•
VVDS: the main feature is identified with H at z=0.264 (at 8296Å), quality flag 9. No emission lines are present in the FORS2 spectrum at this wavelength.
-
•
-
5.
GDS J033231.65-274504.8:
-
•
FORS2: the emission line [O ii]3727 and the absorption lines Ca H and K, MgI, H and are detected in the FORS2 spectrum at ; the emission line H is also detected at 9105Å, quality flag “A”.
-
•
VVDS: in the VIMOS spectrum a line is detected at 9105Å, interpreted as [O ii]3727 at z=1.443, quality flag 1.
-
•
-
6.
GDS J033232.32-274343.6:
-
•
FORS2: for this object (at the border of the FORS2 field of view) the spectrum starts at 6400Å. We detect a weak emission line at 7654Å (close to a sky absorption band), that we originally interpreted to be [O ii]3727 at z1.059, assigning to the redshift a quality flag “C”.
-
•
VVDS: in the VIMOS spectrum an emission line at 5713Å is detected, interpreted as [O ii]3727 at z=0.533 and quality flag 3 (the absorption feature Ca H at 6085Å is also present). It is consistent with the interpretation [O ii]3727 at with the FORS2 7654Å emission line identified as [O iii]5007 at . We have therefore updated the entry in Table LABEL:tab:tblspec to a redshift .
-
•
-
7.
GDS J033242.38-274707.6:
-
•
FORS2: this is a red object ( = 1.11), we detect two clear absorption features in the 9100Å sky free region interpreted as Ca H and K, faint [O ii]3727 seems to be present, quality flag “B”.
-
•
VVDS: red spectrum, Ca H and K are identified in the VIMOS spectrum at z=0.688, quality flag 2.
-
•
-
8.
GDS J033242.56-274550.2:
-
•
FORS2: the emission lines [O iii]5007 (at 6098Å), H (at 5921 Å) and H (at 7994Å) are detected in the FORS2 spectrum, z=0.218, quality flag “A”.
-
•
VVDS: the main emission feature (at 6094Å) is identified with [O ii]3727 at z=0.635, quality flag 2.
-
•
-
9.
GDS J033249.04-275015.5:
-
•
FORS2: the spectrum starts at 6400Å. It shows continuum with a evident emission line at 7909Å interpreted as [O ii]3727 (z=1.122), a discontinuity consistent with the 4000Å Balmer Break is present, quality flag “B”.
-
•
VVDS: the main feature in the VIMOS spectrum is an emission line at 7723Åidentified with [O ii]3727 at z=1.072, quality flag 2.
-
•
-
10.
GDS J033249.85-274757.8:
-
•
FORS2: object red with bright continuum, the emission line [O ii]3727 and the absorption lines MgII 2798 and are detected in the FORS2 spectrum, the 4000Å Balmer Break is also evident, quality flag “B”.
-
•
VVDS: flat continuum, the NeV absorption line is identified at z=1.254, quality flag 2.
-
•
| N | ID | z(FORS2) | QF(FORS2) | z(VVDS) | QF(VVDS) | z(FORS2)-z(VVDS) |
| 1 | GDS J033214.05-275124.5 | 1.220 | A (em.) | 1.325 | 3 | -0.105 |
| 2 | GDS J033219.79-274839.3 | 1.357 | A (em.) | 0.568 | 2 | 0.789 |
| 3 | GDS J033221.67-274056.0 | 1.045 | B (em.) | 0.978 | 1 | 0.067 |
| 4 | GDS J033226.03-275147.7 | 1.242 | A (em.) | 0.264 | 9 | 0.978 |
| 5 | GDS J033231.65-274504.8 | 1.098 | A (em.) | 1.443 | 1 | -0.350 |
| 6 | GDS J033232.32-274343.6 | 1.059 | C (em.) | 0.533 | 3 | 0.526 |
| 7 | GDS J033242.38-274707.6 | 1.314 | B (abs.) | 0.688 | 2 | 0.626 |
| 8 | GDS J033242.56-274550.2 | 0.218 | A (em.) | 0.635 | 2 | -0.417 |
| 9 | GDS J033249.04-275015.5 | 1.122 | B (em.) | 1.072 | 2 | 0.05 |
| 10 | GDS J033249.85-274757.8 | 1.146 | B (em.) | 1.254 | 2 | -0.105 |
| Adopted FORS2 value has been updated to VVDS value in Table 2. | ||||||
In summary, out of ten highly discrepant cases we have found only one that can be ascribed to an evident error in the identification of the features in the FORS2 spectrum (and the original quality flag for this object was “C”). We conclude that the probable fraction of “catastrophic” misidentifications in Table LABEL:tab:tblspec is at most a few percent.
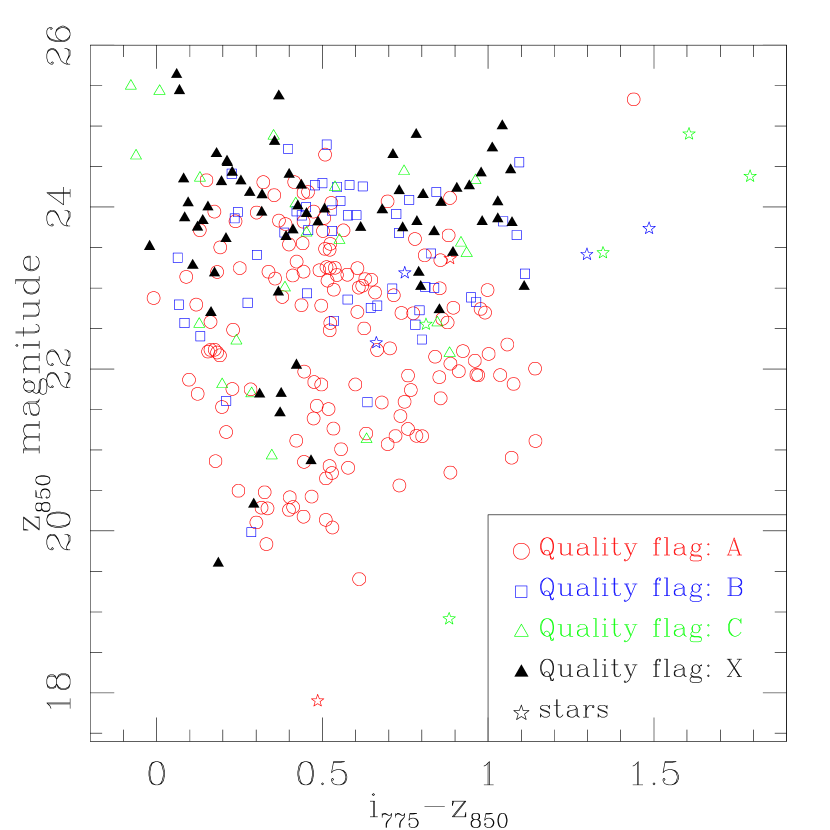
5.2 Reliability of the redshifts - diagnostic diagrams
As mentioned above, the photometric information and its relation with the redshift provides useful indications about possible errors in the redshift measurement and/or magnitude estimation. The Figures 6, 7 and 8 show the redshift-magnitude, the color-redshift and the color-magnitude distributions for the spectroscopic sample (the quality flag “A” and “B” have been selected in the Figures 7 and 8, while all sources have been plotted in the Figure 6). In figure 7 the two populations of “emission-line” and “absorption-line” (typically elliptical) galaxies are clearly separated. The mean color of the “absorption-line” objects increases from = 0.46 0.079 at = 0.6 to = 0.86 0.18 at = 1.0, consistent but increasingly bluer than the colors of a non-evolving elliptical galaxy (estimated integrating the spectral templates of Coleman, Wu & Weedman (1980) through the ACS bandpasses).

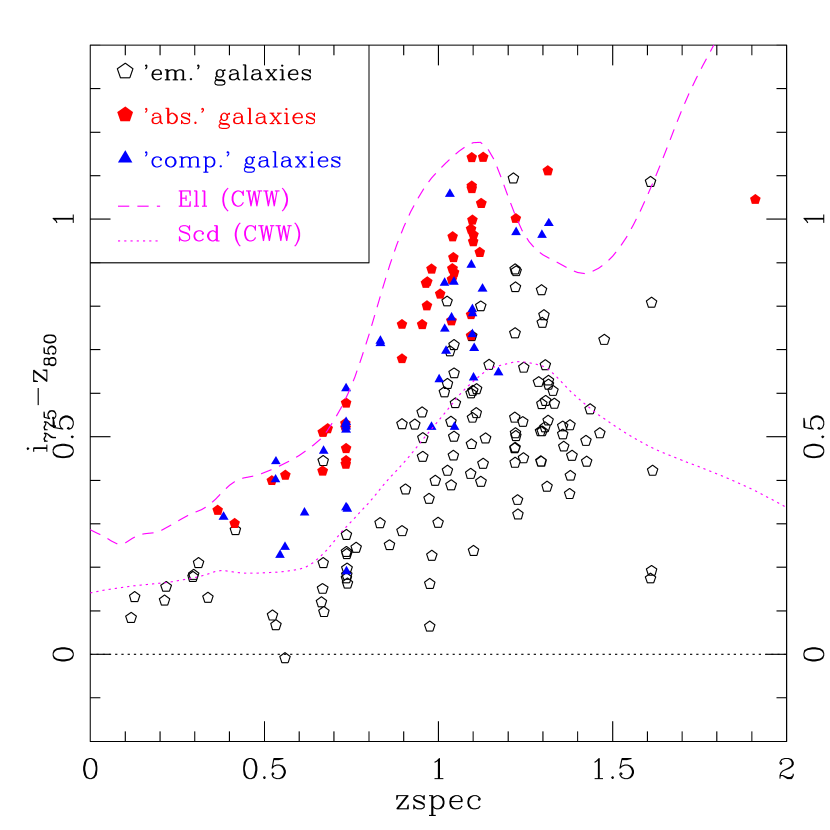
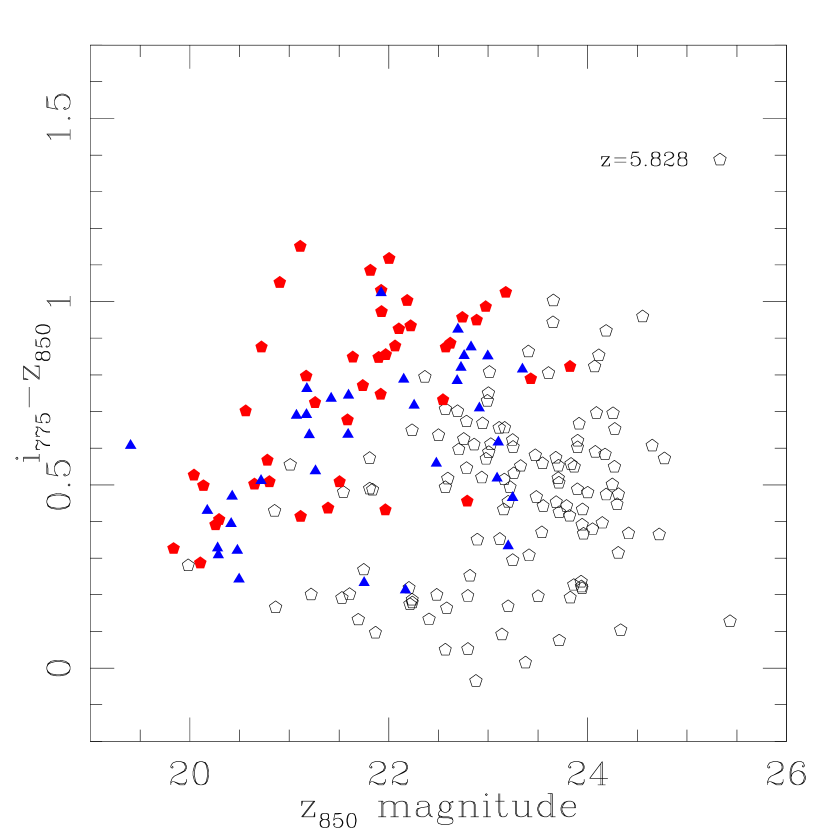
The “emission-line” objects show in general a bluer color and a broader distribution than the “absorption-line” sources: = 0.16 0.13 at = 0.6 and = 0.52 0.21 at = 1.1. The broader distribution, with some of the ”emission-line” objects entering the color regime of the ellipticals, is possibly explained by dust obscuration, high metallicity or strong line emission in the band.
| Spectral class | Fraction | |||
|---|---|---|---|---|
| emission | 1.131 | 0.117 | 5.828 | 46 |
| absorption | 0.950 | 0.366 | 1.910 | 16 |
| em. & abs. | 0.897 | 0.382 | 1.317 | 12 |
| stars | 0.000 | 0.000 | 0.000 | 4 |
| unclassified | - | - | - | 22 |
5.3 Redshift distribution and Large Scale Structure
Figure 9 shows the redshift distribution of the objects observed in the present survey. The majority of the sources are at redshift around 1 (the median of the redshift distribution is at 1.04), in agreement with the main criterion for the target selection (see Sect. 2). Table LABEL:tab:z_properties shows the fraction of determined redshifts as a function of the spectral features identified, i.e. emission lines, absorption lines, emission & absorption lines, and no reliable spectral features (unclassified). There are 49 galaxies identified with absorption lines only (mainly Ca H and K) in the range of redshift between 0.4-1.3; an example is shown in Figure 1. In 46 of the total sample we have measured emission lines (mainly [O ii]3727), many of them entering the so-called “spectroscopic desert” up to z=1.61.

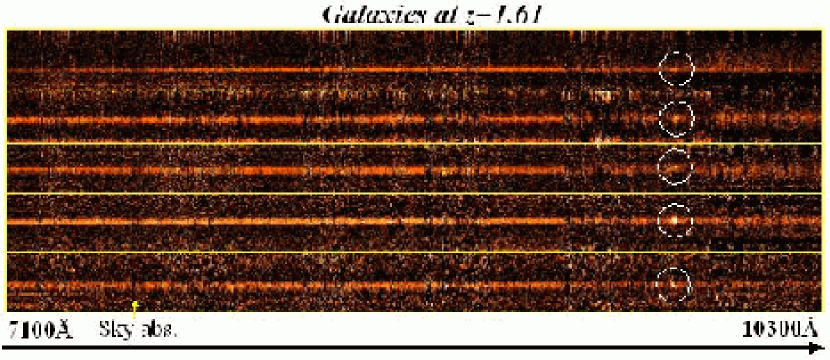
The main peaks in the redshift distribution are at (21 galaxies) and (25 galaxies). Two concentrations at (with 5 galaxies at the mean redshift , see the two dimensional spectra in Figure 11) and (9 galaxies) are also apparent. The presence in the CDF-S of large scale structure, (LSS) at and is already known (Cimatti et al. (2002), Gilli et al. (2003), Le Fevre et al. (2004)). The peak at seems to be a new indication of large scale structure, of the 25 galaxies in the range 1.09z1.11, 10 show emission lines, 9 are ellipticals and 6 are intermediate-type galaxies.
The significance of the LSS at is confirmed by:
-
1.
the observations of Gilli et al. (2003) who found a peak in the redshift distribution of X-ray sources at z=1.618 (5 galaxies) and measured a Poissonian probability of 3.8 for a chance distribution ;
-
2.
three more galaxies at in the K20 survey Cimatti et al. (2002);
The structure at is extending across a transverse size of 5 Mpc in a wall-like pattern rather than a group structure (see Fig. 10).
5.4 High redshift galaxies

As discussed in Sect. 2, the target selection includes mainly low redshift objects (). For three galaxies, however, a redshift larger than four was measured: the galaxy at the only -dropout (see Sect. 2) actually targeted in the present observations and two serendipitously-observed high redshift sources, and one object at , not present in the catalog v1.0, measured at and , respectively.
The -dropout candidate has been observed with both the Keck and VLT telescopes (Dickinson et al. 2004a ). In Figure 12 the FORS2 spectrum of the -dropout source is shown. The line is clearly detected at and shows the blue cut–off characteristic of high–redshift emitters and the forest continuum break.
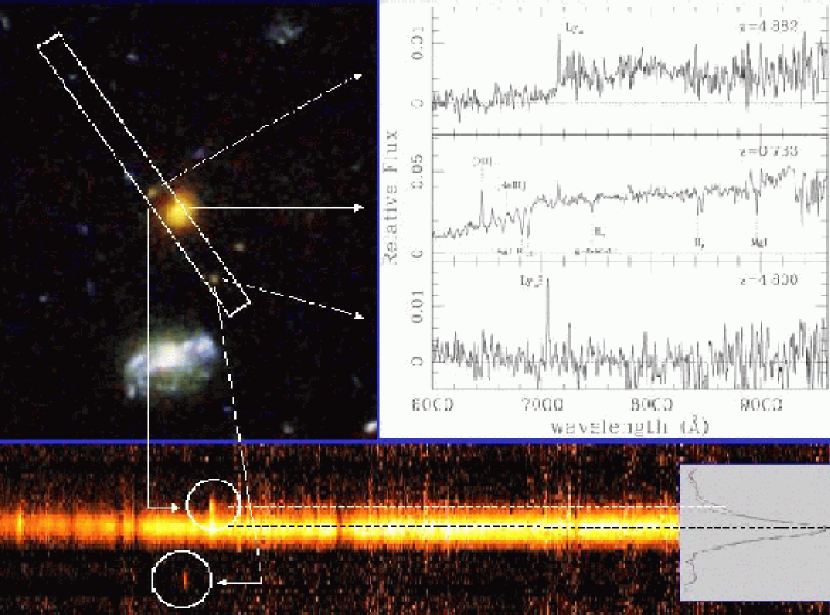
Figure 13 shows a peculiar system of three sources: two emission-line sources above (1.5 arcsecond) and below (3 arcsecond) the main galaxy , clearly visible in the ACS color image and in the two dimensional spectrum. The same target has been observed in two different masks adopting the same orientation of the slits. The total exposure time is 43 ks. The extracted one dimensional spectra are shown in the right side of the Figure 13.
The main galaxy has a redshift with both emission and absorption lines measured (quality flag “A”): [O ii]3727, MgI, Ca H and K, g-band, etc. The bottom object () shows a solo-emission line at 7052Å (see the 1-D spectrum), and is not detected in the ACS B band, we interpret this line as at with quality “C”.
The source above is most probably a emitter at redshift (quality “B”). The spectrum has been extracted subtracting the contamination of the tail of the main galaxy. After the subtraction the shape of the spectrum shows the blue cut–off and the forest continuum break, typical of the LBGs.
5.5 Dynamical masses of galaxies at z 1
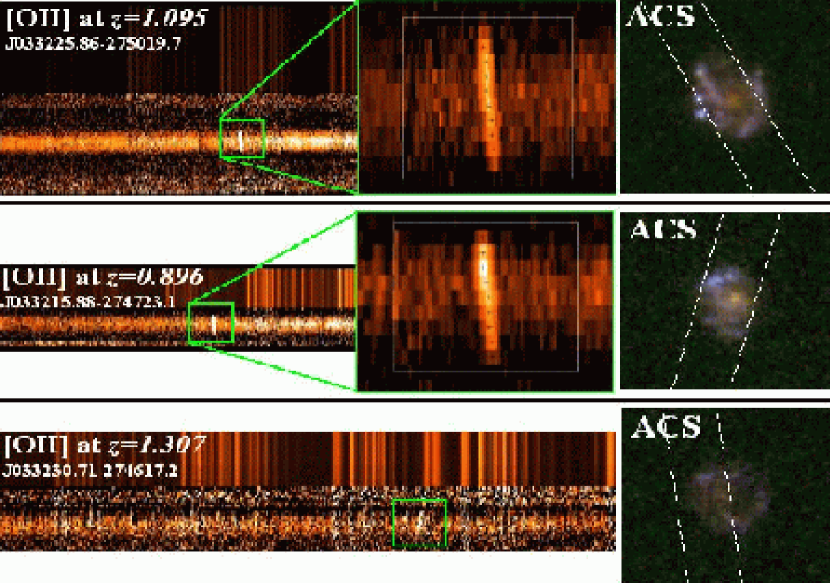
Three galaxies, , and , at redshift z=0.896, 1.095 and z=1.307 respectively show a spatially resolved [O ii]3727 line with a characteristic “tilt” indicative of a high rotation velocity (see Figure 14).
Various studies have been carried out on the internal kinematics of distant galaxies (Vogt at al. (1996, 1997), Moorwood et al. (2001), Pettini et al. (2001) and van Dokkum & Stanford (2001)). Rigopoulou et al. (2002) have determined velocity profiles with a medium resolution grating R5000 of three galaxies at z0.6 and one at z0.8, detected by ISOCAM in the HDF–S. For one object they have derived a rotational velocity of 460 km s-1 containing a mass of 10 (within a radius of 20 Kpc) significantly higher than the dynamical masses measured in most other local and high redshift spirals.
In the case of , and , the spectra, in spite of the relatively low resolution 860, clearly show a tilt of several pixels (corresponding to about 10Å). The measured velocity increases with increasing distance from the center of the objects reaching a value of the order of and greater than 400 km s-1 at the extremes. For the object we have measured a displacement between the two extreme peaks of 11.5Å (top panel of the Figure 14), while a displacement of 9.6Å has been measured in the case of (middle panel of the Figure 14)
Assuming that the observed velocity structure is due to dynamically-relaxed rotation, then it is possible to estimate the dynamical mass for the three galaxies shown in Figure 14 (e.g. Lequeux (1983)): 10 for the galaxy (within a radius of 7.8 Kpc) and 10 for the galaxy (within a radius of 9.8 Kpc). The noisy spectrum of the galaxy allows us to roughly measure a dynamical mass of the order of 10 (within a radius of 7.5 Kpc). The estimates should be considered a lower limit to the total dynamical mass because more external parts of the rotating structure might have a lower surface brightness and remain undetected.
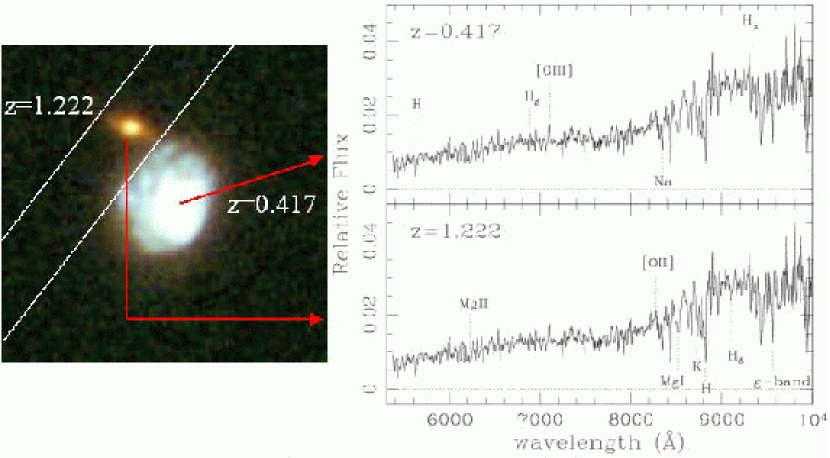
5.6 : a spectrum contaminated by a nearby galaxy.
The spectrum of the galaxy simultaneously shows features corresponding to the redshifts z=1.222 and z=0.417 (Figure 15). The origin of the overlap is the presence of a nearby galaxy (, ) offset by 1.3 arcsecond with a redshift . Light from the brighter galaxy contaminates the spectrum of the fainter (), higher redshift galaxy (see Figure 15). Such cases may represent a problem and a source of error in large spectroscopic surveys, which require an highly automated data processing. A possible solution is to evaluate a priori on the basis of imaging what are the cases subject of light contamination requiring a “special” reduction. Alternatively, color-redshift diagrams (such as Figure 7), a comparison of spectroscopic and photometric redshifts or similar diagnostics are required to carry out the necessary data quality control and identify possible misidentifications.
6 Conclusions
In the framework of the Great Observatories Origins Deep Survey a large sample of galaxies in the Chandra Deep Field South has been spectroscopically targeted. A total of 303 objects with has been observed with the FORS2 spectrograph at the ESO VLT providing redshift determinations. From a variety of diagnostics the measurement of the redshifts appears to be highly accurate (with a typical ) and reliable (with an estimated rate of catastrophic misidentifications at most few percent). The reduced spectra and the derived redshifts are released to the community (). They constitute an essential contribution to reach the scientific goals of GOODS, providing the time coordinate needed to delineate the evolution of galaxy masses, morphologies, and star formation, calibrating the photometric redshifts that can be derived from the imaging data at 0.36-8m and enabling detailed studies of the physical diagnostics for galaxies in the GOODS field.
Acknowledgements.
We are grateful to the ESO staff in Paranal and Garching who greatly helped in the development of this programme. The work of DS was carried out at the Jet Propulsion Laboratory, California Institute of Technology, under a contract with NASA. L.A.M. acknowledges support by NASA through contract number 1224666 issued by the Jet Propulsion Laboratory, California Institute of Technology under NASA contract 1407. We thank the ASI grant I/R/088/02 (SC, MN, EV).References
- Abraham et al. (1996) Abraham, R., G., van den Bergh, S., Glazebrook, K., Ellis, R., S., Santiago, B., X., Surma, P., Griffiths, R., E., 1996, ApJ, 107, 1
- Bahcall et al. (1982) Bahcall, J.N., Schmidt, M., Soneira, R.M. 1982, ApJ, 258, 17
- Bohlin et al. (1995) Bohlin, R.,C., Colina, L., Finley, D., S., 1995, AJ, 110, 1316
- Cimatti et al. (2002) Cimatti, A., Mignoli, M., Daddi, E., et al. 2002, A&A, 392, 395
- Coleman, Wu & Weedman (1980) Coleman, G., D., Wu, C.-C., & Weedman, D., W., 1980, ApJS, 43, 393
- Dickinson et al. (2003) Dickinson et al. 2003, in the proceedings of the ESO/USM Workshop ”The Mass of Galaxies at Low and High Redshift” (Venice, Italy, October 2001), eds. R. Bender and A. Renzini, astro-ph/0204213
- (7) Dickinson, M., et al., 2004, ApJ, 99, 122
- Giavalisco et al. (2004a) Giavalisco, M., et al. 2004, ApJ, 600, L93
- (9) Giavalisco, M., Dickinson, M., Ferguson, H. C., Ravindranath, S., Kretchmer, C., Moustakas, L. A., Madau, P., Fall, S. M., Gardner, Jonathan P., Livio, M., Papovich, C., Renzini, A., Spinrad, H., Stern, D., Riess, A., 2004, ApJ, 600, 103
- Gilli et al. (2003) Gilli, R., Cimatti, A., Daddi, E., Hasinger, G., Rosati, P., Szokoly, G., Tozzi, P., Bergeron, J., Borgani, S., Giacconi, R., Kewley, L., Mainieri, V., Mignoli, M., Nonino, M., Norman, C., Wang, J., Zamorani, G., Zheng, W., Zirm, A., 2003, ApJ, 592, 721
- Le Fevre et al. (2004) Le Fevre, O., Vettolani, G., Paltani, S., Tresse, L., Zamorani, G., Le Brun, V., Moreau, C., and the VIMOS VLT Deep Survey team, submitted to A&A, (astro-ph/0403628)
- Lequeux (1983) Lequeux, J. 1983, A&A, 125, 394
- Moorwood et al. (2001) Moorwood A.F.M., van der Werf, P.P, Cuby, J.G., Oliva, E., 2000, A&A, 362, 9
- Mobasher et al. (2004) Mobasher, B., Idzi, R., Ben tez, N., Cimatti, A., Cristiani, S., Daddi, E., Dahlen, T., Dickinson, M., et al., 2004, ApJ, 600, 167
- Oke (1995) Oke, J.B., et al., 1995, PASP, 107, 375
- Pettini et al. (2001) Pettini, M., Shapley, A. E., Steidel C. C., Cuby, J.-G., Dickinson, M., A. F. M. Moorwood, Adelberger, K. L., Giavalisco, M., 2001, ApJ, 588, 65
- Renzini et al. (2002) Renzini et al. 2002, in the proceedings of the ESO/USM Workshop ”The Mass of Galaxies at Low and High Redshift” (Venice, Italy, October 2001), eds. R. Bender and A. Renzini
- Riess et al. (2004) Riess, A.G.,2 Strolger, L.-G., Tonry, J., Casertano, S., Ferguson, H.C., et al., 2004, ApJ, 607, 665
- Rigopoulou et al. (2002) Rigopoulou, D., Franceschini, A., Aussel, H., Genzel, R., Thatte, N., Cesarsky, C. J., 2002, ApJ, 580, 789
- Steidel et al. (1999) Steidel, C.C., Adelberger, K.L., Giavalisco, M., Dickinson, M., Pettini, M., 1999, ApJ, 519, 1
- Szokoly et al. (2004) Szokoly, G., P., Bergeron, J., Hasinger, G., Lehmann, I., Kewley, L., Mainieri, V., Nonino, M., Rosati, P., Giacconi, R., Gilli, R., Gilmozzi, R., Norman, C., Romaniello, M., Schreier, E., Tozzi, P., Wang, J., X., Zheng, W., Zirm, A., 2004, (astro-ph/0312324)
- van Dokkum & Stanford (2001) van Dokkum, P.G., & Stanford, S.A. 2001, ApJ, 562, 35
- Vogt at al. (1996) Vogt, P.N., et al. 1996, ApJ, 465, L15
- Vogt at al. (1997) Vogt, P.N., et al. 1996, ApJ, 479, L121
- Warmels (1991) Warmels, R.H.: 1991, “The ESO-MIDAS System”, in Astronomical Data Analysis Software and Systems I , PASP Conf. Series, Vol. 25, p. 115.