The Orbit, Mass, and Albedo of Transneptunian Binary (66652) 1999 RZ253.
Proposed Running Head: The Orbit of TNO Binary (66652) 1999 RZ253
Editorial Correspondence: Dr. Keith S. Noll
Space Telescope Science Institute
3700 San Martin Drive
Baltimore, MD 21218
phone: 410-338-1828
fax: 410-338-4767
email: noll@stsci.edu
Pages: 15
Tables: 4
Figures: 4
ABSTRACT
We have observed (66652) 1999 RZ253 with the Hubble Space Telescope at seven separate epochs and have fit an orbit to the observed relative positions of this binary. Two orbital solutions have been identified that differ primarily in the inclination of the orbit plane. The best fit corresponds to an orbital period, P=46.263 days, semimajor axis a=4,660170 km and orbital eccentricity e=0.4600.013 corresponding to a system mass m=3.7 kg. For a density of = 1000 kg m-3 the albedo at 477 nm is = 0.12, significantly higher than has been commonly assumed for objects in the Kuiper Belt. Multicolor, multiepoch photometry shows this pair to have colors typical for the Kuiper belt with a spectral gradient of 0.35 per 100 nm in the range between 475 and 775 nm. Photometric variations at the four epochs we observed were as large as 123% but the sampling is insufficient to confirm the existence of a lightcurve.
1 INTRODUCTION
(66652) 1999 RZ253 was discovered in images taken on September 8, 1999 at the Canada-France-Hawaii telescope by Trujillo et al. (2000). Its heliocentric orbit was determined by subsequent observations by this group and others (Veillet et al. 2000). The latest orbital elements reported by the Deep Ecliptic Survey team (Millis et al. 2002), a=44.02 AU, e=0.091, i=0.564 deg, put it in a class with other low-inclination, low-eccentricity, non-resonant objects sometimes called “classical” Kuiper Belt objects.
The Deep Ecliptic Survey website (Millis et al. 2002) has compiled astrometric observations of (66652) 1999 RZ253, mostly obtained in the R band, with a median R magnitude of 21.7. More accurate photometric observations find R=21.5 (Delsanti et al. 2001). The minor planet center, using the standard asteroidal color conversion, derives an absolute magnitude in the V band of =5.9, suggesting that (66652) 1999 RZ253 could be among the larger of the known transneptunian objects (TNO). (We show below that (66652) 1999 RZ253 like many TNOs, is significantly redder than the asteroid standard and, thus, has a fainter .)
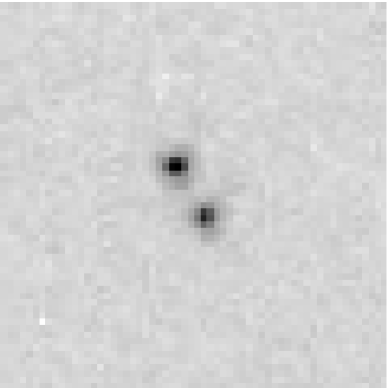
We identified (66652) 1999 RZ253 as a binary in images we took using the Hubble Space Telescope’s (HST) Near-Infrared Camera and Multi-Object Spectrograph (NICMOS) on 23 April 2003 (Noll and Stephens 2003). Prompted by this discovery, a series of followup observations were made with the HST Advanced Camera for Surveys (ACS) using its High Resolution Camera (HRC). We resolved the binary at all four epochs observed by the ACS. We have been able to use the relative astrometry available from our HST images to determine the relative orbit of the binary pair. With that comes a determination of the system mass, constraints on albedo and density, and photometry of the individual components that we describe in this paper. Despite its great distance and small size, (66652) 1999 RZ253 joins the ranks of well-characterized solar system objects thanks to its beneficent duplicity.
2 OBSERVATION
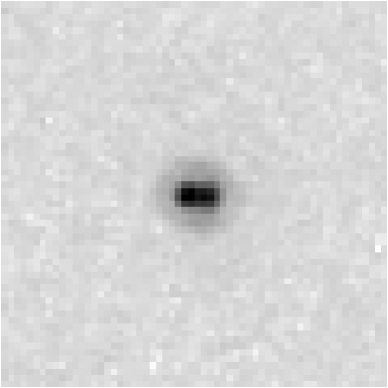
(66652) 1999 RZ253 has been observed at seven separate epochs with HST as summarized in Table 1 and Fig. 1. The binary has been resolved at five of these seven epochs, and the remaining two provide upper limits. Three different instruments were used and we describe these observations separately below.
2.1 NICMOS
(66652) 1999 RZ253 was observed with the NIC2 camera in April 2003 as part of a large survey of infrared colors of TNOs. Two 256 second images were obtained through the F110W filter (J) and two 512 second images were obtained with the F160W filter (H). These were obtained using the STEP256 MULTIACCUM sequence with the number of samples, NSAMP, being 11 and 12 respectively. The pixel scale in the NIC2 camera is approximately 0″.075 on a side. At 1.1 and 1.6 m the full-width-half-maximum (FWHM) of the telescope’s diffraction-limited point-spread-function (PSF)is 0″.097 and 0″.140. Thus, the image is nearly well-sampled at 1.6 m and undersampled at 1.1 m. The pair of images in each filter was dithered by 5.5 pixels in both x and y directions in order to avoid bad pixels, and to potentially recover some of the spatial information lost in the undersampled image.
(66652) 1999 RZ253 was found in the NICMOS images close to the expected NIC2 default aperture position. However, examination of the image immediately showed that, unlike most of the other objects observed by us, this object was clearly binary (Noll and Stephens 2003). The possibility of confusion between a binary companion and a faint background object was ruled out by the stability of the relative positions of the pair during the approximately 100 minutes the object was observed. Both the proper motion of the object and parallax contribute to a non-linear apparent motion of 3″.9 compared to fixed objects in the field.
The four NICMOS images were reduced using standard pipeline calibration steps. To obtain relative astrometric positions, each individual image was fit with a pair of scaled PSFs using an iterative procedure that minimizes the residuals after subtracting the combined PSFs. The derived scale factors give the photometric magnitude of each component as listed in Table 2.
2.2 ACS/HRC
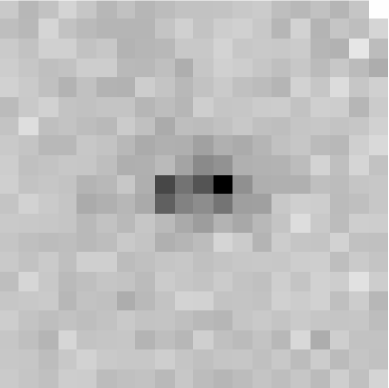
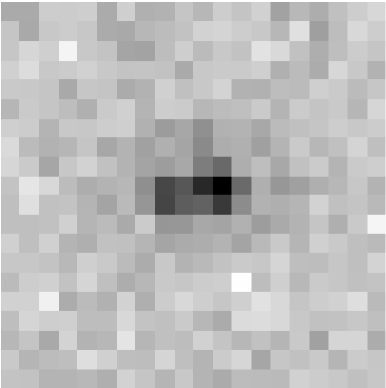
We used the unprecedented power of the ACS/HRC to make followup observations in August, September and November 2003 (Table 1). In each visit we performed a single orbit of observation with two 600 sec exposures through the F475W filter (Sloan g) and two 500 sec exposures with the F775W filter (Sloan i). The observations were dithered to minimize the effects of bad pixels and to improve the sampling in the undersampled F475W images.
The orbital period was initially unknown so we adopted a two step strategy to maximize our sampling of the orbit. Using an assumed albedo of 5%, a density of 1000 kg m-3, and the observed maximum separation we derived a minimum period of 10 days. We noted that other TNO binaries with known periods, 1998 WW31 and 2001 QT297, have periods substantially longer than the minimum calculated in this way. Therefore, we specified that the initial pair of exposures be separated by 25-50 days. The remaining two orbits remained on hold until these data could be analyzed. After examining the first pair of ACS/HRC images, we activated the second pair, this time with a specified time separation of 9-15 days. As can be seen in Fig. 2, this sampling stategy not only allowed us to determine the orbital period, but gave us fortuitously good sampling of the orbit such that we were able to also constrain the remaining orbital elements as discussed below. It should be noted however, that without a priori knowledge of the period and with limited control over when observations are scheduled, sampling is mainly a matter of chance; good sampling will generally require more observations to adequately constrain an orbit.
Images were reduced using standard HST pipeline calibration. Dithered images were combined and cosmic rays removed using the multidrizzle software package. We corrected the substantial anamorphic distortion in the ACS images before deriving relative astrometric positions. As with the NICMOS data, we fit the images to a pair of scalable synthetic PSFs made with version 6.2 of the TinyTim software package (Krist and Hook 2003). This procedure also gives us relative photometry which we normalized to absolute photometry using the standard HST zeropoints. An added complication for analysis of the ACS/HRC data compared to the other instruments is that the sythetic PSFs are available only in the geometrically-distorted space of the ACS. We therefore conducted PSF fitting and subtraction before applying the distortion correction.
2.3 STIS
(66652) 1999 RZ253 was observed in November 2001 as part of a program dedicated to searching for companions to TNOs (c.f. Brown and Trujillo 2002). In this program observations were made in pairs of orbits separated by several days. Images were recorded through the clear filter to maximize sensitivity to faint companions. Tracking and parallax correction were turned off and observations were scheduled near times of minimum apparent motion by the TNO. The result of this observing strategy is that the images, including the intermediate frames, are blurred in a complex pattern dominated by the parallax. Images can be reconstructed by modelling the motion and creating blurred PSFs, however this inevitably results in a loss of sensitivity along the path of apparent motion.
The STIS images of (66652) 1999 RZ253 consisted of eight 300 sec exposures in each of two orbits. Because (66652) 1999 RZ253 is relatively bright at R21.7, there is sufficient S/N in each 300 sec integration that they can be examined individually. We retrieved these data from the archive using standard on-the-fly pipeline calibration and examined the images. The apparent motion due to changing parallax is variable throughout the orbit and is at a minimum near the end of the orbits. Thus, we examined the final image on each of the two dates without further correction for motion. Neither image reveals a clearly resolved binary, but both can be used to set upper limits on the separation of approximately 0″.1.
3 ANALYSIS
The images from each epoch have been analyzed separately using a binary PSF fitting routine that iteratively fits synthetic PSFs on a 0.1 pixel grid, identifying the best fit at each location through a minimization of the residuals. The grid-pair with the lowest minimum is the best overall fit; we derive the separation, position angle, and relative flux from this fit. Synthetic PSFs are generated for each image using the TinyTim software package (Krist and Hook 2003) with inputs appropriate for the instrument in use and the location of the image on the array. The results from this procedure are found in Tables 1 and 2.
The separations and position angles measured from images at five epochs, plus the upper limits measured at two epochs, were used as input into a binary orbit fitting routine. The program takes fully into account the time-dependent geometry of the orbit as viewed from the Earth. The model searches for a set of orbital elements that minimize the residuals from the observations and predicted positions. Two separate solutions can be found that differ mainly in the inclination of the orbit plane. With sufficient observing baseline, the degeneracy can be broken as the orbit plane angle changes due to orbital motion of the TNB. We find one orbit solution has a slightly lower , but cannot yet rule out the mirror solution. The best fitting orbit is plotted in Fig. 2. The resulting orbital elements are tabulated in Table 3.
Errors were estimated for each orbital element by two methods; we report the larger error in each case. We first used the method of Lampton et al. (1976) which involves varying one parameter at a time and results in a 1-sigma contour. The second approach holds one orbital element constant over a range of values while allowing all other orbital elements to vary freely at each step to minimize . With this method we took the minimum +1 to be the 1-sigma contour. We note that at the times of the two observations in 2001, the orbit solutions predict separations of s 0″.1, in agreement with the upper limits set by these non-detections. At all other dates the difference between the observed and predicted position is less than 0″.004.
An important aspect of breaking the orbit degeneracy is determining when mutual events can occur for this binary system. For the two possible orbital solutions, mutual events can occur approximately in the year 2045 for solution 1 or 2108 for solution 2. Continued observations over the next decade can determine which of these possibilities will occur.
Because of the limited number of observations the orbit solution is particularly vulnerable to unrecognized sources of error. Small changes in the semimajor axis can result in significant changes to the derived mass. Despite the fortuitously good sampling of the orbit, further observations may be able to refine the orbital elements and should be carried out.
4 DISCUSSION
The most direct value of binary orbit determination is that we are able to derive a mass for the system from direct observation. For (66652) 1999 RZ253 we find a mass of 3.7 kg. This is similar to the system masses found for two other TNBs, 1998 WW31 and 2001 QT297 which have been found to be 2.7 kg (Veillet et al. 2002) and 3.3 kg (Osip et al. 2003). We note that the mass of the Pluto-Charon system is some 5000 times greater putting it into a qualitatively different category than relatively low mass binaries like (66652) 1999 RZ253.
The directly measured mass of (66652) 1999 RZ253 is 9-13 times lower than would have been estimated using the assumptions that have been frequently applied when estimating mass from photometry, a fact that has global significance for mass estimates of the Kuiper Belt as a whole. The MPC lists an magnitude of 5.9. If we assume the body(ies) to have a surface albedo of = 0.04, we derive a diameter of 447 km (for a single object) or two objects with = 316 km (for an equal mass binary). Making the further assumption that the bulk density is = 1000 kg m-3 we would derive masses of 33-47 kg. Even with a modified assumption of higher albedo, = 0.10, we would overestimate the mass of this system by factors of 2.3-3.3 depending on whether it was known to be a binary or not. The uncertainties in deriving absolute magnitudes in the V band from ground-based data that are often obtained with different filters for TNOs that have, as a group, a wide range of non-solar colors, is an important part of the total error budget. As shown in Table 4, in the case of (66652) 1999 RZ253, the standard color correction produces an overly-bright estimate of the HV magnitude. Global estimates of the mass of the Kuiper Belt have been made using similar kinds of extrapolations from photometry and assumptions of low albedo. In their recent review, Jewitt and Luu (2000) estimate the mass of objects with diameters 100 km 2300 km is 0.1 M⊕ based on an assumed R-band albedo of =0.04. By contrast, we estimate the R-band albedo of (66652) 1999 RZ253 to be 0.17, comparable to the very high albedo lower limit found for 28978 Ixion (Altenhoff et al. 2004). If objects with albedos like (66652) 1999 RZ253 are common, it may be necessary to revise downward mass estimates of the Kuiper Belt by as much as an order of magnitude.
The mass of the individual binary components cannot be derived from the relative astrometry we have performed. It can, in principle, be derived from absolute astrometric measurements of each component that would yield the orbit about the systems barycenter. However, such measurements are beyond the scope of the observations we have made and would require a substantial investment of observing time. If, however, we make the assumptions that the surface albedos and densities of each component are identical, a mass ratio can be derived from measured photometry according to the relation Using the average measured flux in the F475W filter we obtain = 1.79. If the assumption of equal albedos holds, the individual masses of the binary components are m kg and m kg. Similarly, it is possible to obtain a ratio of the diameters of the two components of the binary. Assuming equal albedos, the objects have a diameter ratio of For a density of 1000 kg m-3, the diameters of the A and B components are 166 and 137 km respectively.
Once the relative sizes of the objects are assumed known from the measured relative photometry (and the assumption that each object has the same albedo) we can plot the albedo, , as a function of density, , from the expression
where R is the sun-object distance, the earth-object distance, the solar flux at 1 AU. The result for the measured flux, , and derived mass, , of (66652) 1999 RZ253 is shown in Fig. 3. What is notable is that for densities in the range that would be expected for the outer solar system, i.e. near a density of 1000 kg m-3, the albedo is greater than 0.1, significantly higher than is generally assumed for TNOs. By way of comparison, the albedo of 1998 WW31 for an assumed density of 1000 kg m-3 is =0.054 (Veillet et al. 2002) and the average of 9 TNOs with radiometrically determined diameters is = 0.08 (Altenhoff et al. 2004).
(66652) 1999 RZ253 is also notable for the short duration of its orbital period, 12 times shorter than the 574 day period of 1998 WW31(Veillet et al. 2002) and 17 times shorter than 2001 QT297’s 788 day orbital period (Osip et al. 2003). However, this is most likely an artifact of observational bias. It is virtually certain that other TNBs will also be found to have comparably short periods. Short period objects are of greater interest with regard to the potential for observable mutual events. Typical mutual event seasons for TNBs will be on the order of months (Noll 2003), so orbits with periods of this order or shorter will maximize mutual event opportunities.
The eccentricity of TNB orbits is a potentially useful tool to discriminate between formation models. In particular, the exchange reaction model (Funato et al. 2004) predicts that most binaries will have eccentricities greater than 0.8. Of the three binary systems that now have either measured or constrained eccentricity (Veillet et al. 2002, Osip et al. 2003, this work) only one is this high. (66652) 1999 RZ253 and 2001 QT297 have mutual orbits with eccentricities significantly lower than 0.8. The data available would suggest that the formation model proposed by Funato et al. is not the operative mechanism for the majority of binaries formed in the Kuiper Belt.
The multi-filter photometry we obtained can be used to construct a very low resolution spectrophotometric spectrum from 0.47 - 1.65 m. The resultant spectrum is shown in Fig. 4. The optical color ratios derived from the F475W and F775W filters result in spectral gradients of =0.35 and =0.33 for the primary and secondary components respectively. We have defined the spectral gradient as the fractional change in reflectance per 100 nm, consistent with the convention introduced by Boehnhardt et al. (2001). The spectral gradient is a useful tool for comparing colors obtained with different filter sets without requiring color transformations. It implicitly assumes that a single gradient applies across the optical spectrum for TNOs, a result that has been confirmed observationally (Jewitt and Luu 2001). The spectral gradients of 41 non-resonant TNOs measured by us using WFPC2 (Stephens et al. 2003) range from 0.14 to 0.64. (66652) 1999 RZ253 falls within the middle of this range.
There is no indication from the data we have compiled that either primary or secondary component has an intrinsic lightcurve as shown in Table 4. On the four occasions we observed with the ACS, the variations in the normalized absolute flux are within the range expected from the measurement uncertainties with the exception of one point on 20 August 2003. However, this sparse sampling does not rule out the possibility of intrinsic lightcurve(s) and future observations should be carried out to investigate this possibility.
(66652) 1999 RZ253 joins what will be a growing list of transneptunian binaries with measured orbits and masses. The availability of this indispensible physical information makes these systems among the most interesting astronomical targets in the solar system. Their links to the early history of the solar system mean that they will continue to be the focus of intensive study as we explore the outer edges of the solar system.
References
- Altenhoff et al. (2004) Altenhoff, W. J., Bertoldi, F., Menten, K. M. 2004. Size estimates of some optically bright KBOs. Astron. & Astrophys. 415, 771-775.
- Boehnhardt et al. (2001) Boehnhardt, H., Tozzi, G. P., Birkle, K., Hainaut, O., Sekiguchi, T., Vair, M., Watanabe, J., Rupprecht, G., the FORS Instrument Team 2001. Visible and near-IR observations of transneptunian objects. Results from ESO and Calar Alto telescopes. Astron. & Astrophys. 378, 653-667.
- Brown & Trujillo (2002) Brown, M. E., Trujillo, C. A. 2002. (26308) 1998 SM_165, IAU Circ. 7807.
- Delsanti et al. (2001) Delsanti, A. C., Boehnhardt, H., Barrera, L., Meech, K. J., Sekiguchi, T., Hainaut, O. R. 2001. BVRI photometry of 27 Kuiper belt objects with the ESO Very Large Telescopes. Astron. & Astrophys. 380, 347-358.
- Funato et al. (2004) Funato, Y., Makino, J., Hut, P., Kokubo, E., Kinoshita, D. 2004. The formation of Kuiper-belt binaries through exchange reactions. Nature 427, 518-520.
- Jewitt and Luu (2000) Jewitt, D., Luu, J. 2000. Physical nature of the Kuiper Belt. In: Mannings, V., Boss, A., Russell, S. (Eds.), Protostars and Planets IV, University of Arizona Press, Tucson, pp. 1201-1229.
- Jewitt and Luu (2001) Jewitt, D., Luu, J. 2001. Colors and spectra of Kuiper Belt objects. AJ 122, 2099-2114.
- Krist & Hook (2003) Krist, J. E., Hook, R. N. 2003. The Tiny Tim user’s guide. v.6.1, Space Telescope Science Institute, Baltimore.
- Lampton et al. (1976) Lampton, M., Margon, B., Bowyer, S. 1976. Parameter estimation in X-ray astronomy. ApJ 208, 177-190.
- Millis et al. (2002) Millis, R. L., Buie, M. W., Wasserman, L. H., Elliot, J. L., Kern, S. D., Wagner, R. M. 2002. The Deep Ecliptic Survey: A search for Kuiper Belt objects and Centaurs. I. Description of methods and initial results. AJ 123, 2083-2109.
- Noll & Stephens (2003) Noll, K. S., Stephens, D. C. 2003. 1999 RZ_253. IAUC 8143.
- Noll (2003) Noll, K. S. 2003. Transneptunian binaries. Earth, Moon, & Planets 92, 395-407.
- Osip et al. (2003) Osip, D. J., Kern, S. D., Eliot, J. L. 2003. Physical characterization of the binary Edgeworth-Kuiper belt. Earth, Moon, & Planets 92, 409-421.
- Stephens et al. (2003) Stephens, D. C., Noll, K. S., Grundy, W. M., Millis, R. L., Spencer, J., Buie, M., Tegler, S. C., Romanishin, W., & Cruikshank, D. P. 2003. Photometry of a large sample of KBOs with HST. Earth, Moon, & Planets 92, 251-260.
- Trujillo et al. (2000) Trujillo, C. A., Luu, J. X., Jewitt, D. C., Tholen, D. J., Sheppard, S. S., Marsden, B. G. 2000. Minor Planet Electronic Circ. 2000-O12.
- Veillet et al. (2000) Veillet, C., Cuillandre, J. C., Woodworth, D. R., McDonald, J., Marsden, B. G. 2000. 1999 RZ253. Minor Planet Electronic Circ. 2000-O18.
- Veillet et al. (2002) Veillet, C., Parker, J. W., Griffin, I., Marsden, B., Doressoundiram, A., Buie, M., Tholen, D. J., Connelley, M., Holman, M. J. 2002. The binary Kuiper-belt object 1998 WW31. Nature 416, 711-713.
|
||||||||||||||||||||||||||||||||||||||||||||||||||||||||||||||||||||||||||||||||
|
||||||||||||||||||||||||||||||||||||||||||||||||||||||||||||||||||||||||||||||||||||||||||||||||||
|
|||||||||||||||||||||||||||||||||||||||||||||||
|
|||||||||||||||||||||||||||||||||||||||||||||||||||||||||||||||||||||||||||||||||||||||||||||||||||||||||||||||||||||||||||||||