Optical Photometry of SN 1993J: Years 1995 to 2003
Abstract
In this paper, the late-time optical photometry of supernova (SN) 1993J in M81 from Feburary 1995 to Janurary 2003 is presented. The observations were performed in a set of intermediate-band filters that have the advantage of tracing the strength variations of some spectral features. SN 1993J was found to fade very slowly at late times, declining only by mag 100 d-1 in most of the filters from 2 to nearly 10 yrs after discovery. Our data suggest that the circumstellar interaction provides most of the energy to power the late-time optical emission of SN 1993J. This is manifested by several flux peaks seen in the rough spectral energy distributions constructed from the multicolor light curves. The flux peaks near 6600 Å, 5800 Å and 4900 Å may correspond to the emission lines of H, Na I D + He I 5876 and [O III] 4959, 5007, respectively. The evolution of these emission lines suggest a power-law SN density model as proposed by Chevalier & Fransson (1994).
1 Introduction
SN 1993J was visually discovered on 1993 March 28 UT by Spanish amateur astronomer Francisco Garcia-Diaz (Garcia, 1993). It occurred in the nearby galaxy M81 (NGC 3031, Mpc, Freedman et al. 1994) and reached a maximum brightness of =10.8 mag, and is the optically brightest SN in the northern Hemisphere since SN 1954A. SN 1993J is classified as a “Type IIb” SN: its near-maximum spectra are similar to these of SNe II which are characterized by strong hydrogen Balmer lines, and its nebular spectra are similar to these of SNe Ib/c that have weak hydrogen but strong He I lines (Filippenko, Matheson, & Ho, 1993; Swartz et al., 1993). Models of SN 1993J (Nomoto et al., 1993; Podsiadlowski et al., 1993; Woosley et al., 1994) suggest that the progenitor has lost all but a small amount of its hydrogen layers, thus the shock-heated effective photosphere could quickly sink through the thin H layer into the deeper He layers during the initial expansion and the cooling phase. The light curve of SN 1993J was unlike either of the plateau or linear version of the typical SN II, showing two maxima similar to SN 1987A but with a faster evolution. Except for the initial peak, the light curve bears a strong resemblance to SN Ib/c.
Due to its brilliant brightness and peculiarity, SN 1993J has been extensively observed along the whole electromagnetic spectrum with the telescopes from the ground and in orbit. Early observations of photometry and spectroscopy in the optical bands are reported by many authors (Schmidt et al., 1993; Wheeler et al., 1993; Filippenko, Matheson, & Barth, 1994; Lewis et al., 1994; Benson et al., 1994; Richmond et al., 1994; Prabhu et al., 1995). The optical photometry during the first 360 days after explosion are published by Barbon et al. (1995) and Richmond et al. (1996). The optical spectroscopy during SN 1993J’s first 2500 days is presented by Matheson et al. (2000a, b).
Late-time observations of SNe II have established that some SNe II halt luminosity decline, remain optically detectable for years and even decade after an outburst. Continued observations of these old, evolved SNe can make constraints on the energy mechanism of the late-time optical emission and provide clues to the evolution of their progenitor systems.
In this paper we present the late-time photometric observations of SN 1993J from the years 1995 to 2003. We describe our observations and data reduction in 2, and the multi-color light curves and spectral energy distribution (SED) in 3. Discussions on the late-time energy mechanism of SN 1993J are presented in 4, and the results are summarized in 5.
2 Observations and data reduction
Photometric observations of SN 1993J at late times have been obtained with the 60/90 cm f/3 Schmidt telescope located at the Xinglong station of the National Astronomical Observatory of China (NAOC). A Ford Aerospace 20482048 CCD camera with a 15 micron pixel size is mounted at the Schmidt focus of the telescope. The field of view of the CCD is with a plate scale of 1.67 arcsec per pixel.
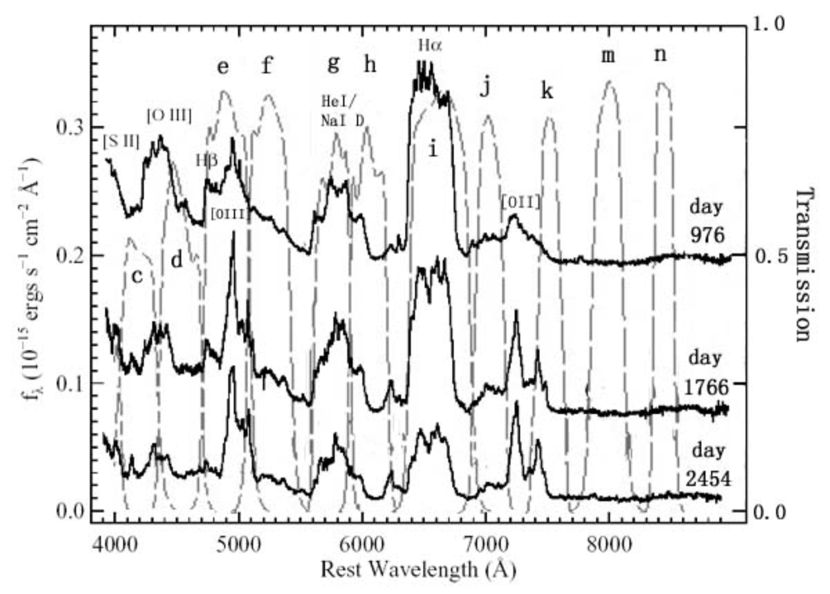
This telescope has a photometric system with 15 intermediate-band (FWHM 200-400 Å) filters covering a wavelength range from 3000 Å to 10000 Å (Fan et al., 1996; Yan et al., 1999; Zhou et al., 2003). The transmission curves of these filters are shown as the dashed curves in Figure 1. These filters which were designed to avoid contamination from the strongest and most variable night sky emission lines, were used to conduct a survey project among astronomers in Beijing, Arizona, Taipei, and Connecticut (BATC) (Fan et al., 1996). We adopt the spectrophotometric AB magnitude system in which the flux calibration is performed by observing four F sub-dwarfs, HD 19445, HD 84937, BD+262606, and BD+174708 (Oke & Gunn, 1983). The transformation equations between the broad-band Johnson-Cousins and our intermediate-band are the following (Zhou et al., 2003):
| (1) | |||||
We have observed SN 1993J roughly once a year using 12 filters ( to ) since 1995. The details of the observations are given in Table 1.
2.1 Photometry
To obtain proper photometry of an SN that occurs in a complicated background (e.g. spiral arms or H II regions), observers are usually required to take template images of the host galaxy long after the SN has faded and do image subtraction. This method is appropriate when the SN has a relatively fast evolution and the template images can be obtained in a reasonable time. However, some SNe, as the case for SN 1993J, are long-lived and evolve slowly during the nebular phase, and the template images cannot be obtained without the contamination of the SN light (Li et al., 2002). Therefore, we have to find an alternative method to fit the galaxy background underneath SN 1993J.
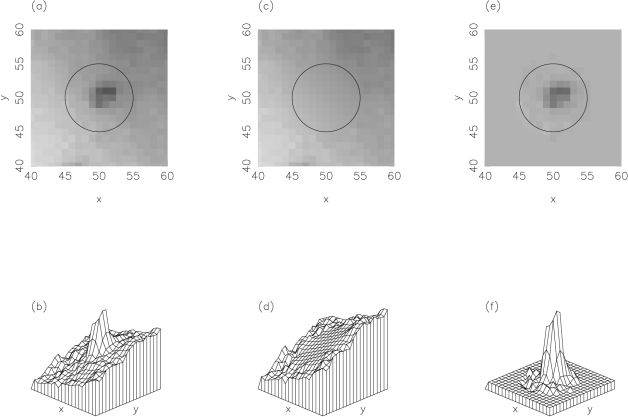
We have used a method that assumes the spiral plane around SN 1993J in M81 is a stable system which can describe by diffusive eqution. This means, if the boundary condition for the equation is known, we can get the flux distribution of the spiral arm at the position of SN 1993J, and the flux of SN 1993J can be obtained by subtracting the flux of galaxy’s spiral arms from the total flux.
Before we numerically solve this Laplace equation, we do a Gaussian smooth to reduce the noise. We then estimate the flux distribution of M81 in a circle with a 6-pixel radius centered on SN 1993J by interpolating the flux from the pixels outside the circle (see the Appendix). This process is repeated until convergency. After subtracting the estimated galaxy flux in the circle, only the flux of SN 1993J remains. Figure 2 demonstrates this process.
The final magnitudes of SN 1993J are measured on the subtracted images with standard aperture photometry. We use Pipeline II (a program developed to measure the magnitudes of point sources in BATC images) that is based on Stetson’s DAOPHOT package (Stetson, 1987).
2.2 Calibration
A total of 20 photometric nights were used to calibrate 30 local standard stars in the field of SN 1993J. For each photometric night, the afore-mentioned four standard stars were observed in a range of airmasses, and we derive iteratively the extinction curves and the slight variation of the extinction coefficients . The instrumental magnitudes () are calibrated by the BATC AB magnitude () (Zhou et al., 2001) by
| (2) |
where is the airmass, and is the zero point of magnitude.
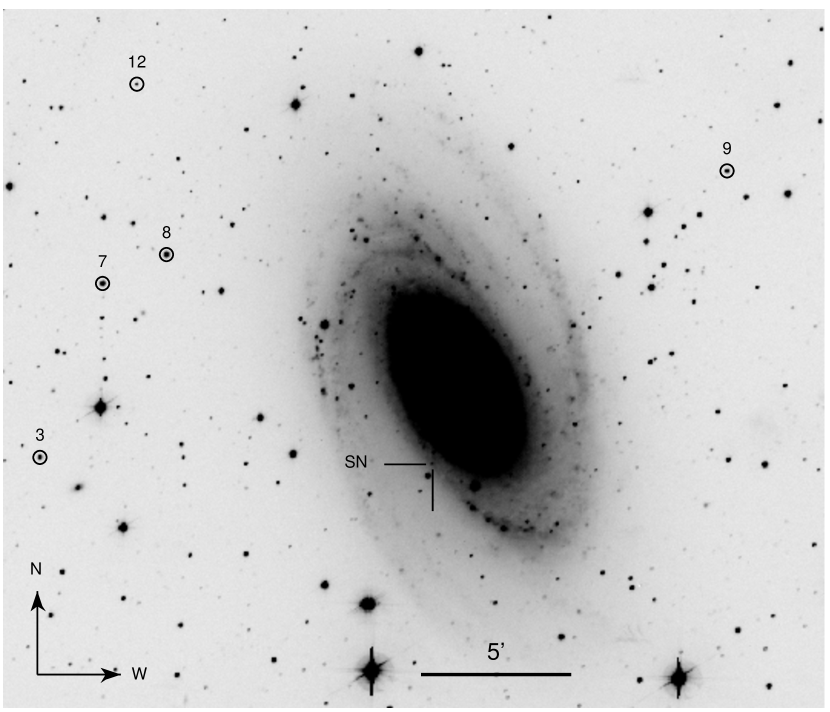
Table 1 lists the number of calibrations in each filter, while Table 2 lists the final calibrated BATC magnitudes and their uncertainties of the 30 local standard stars (see Figure 3 for a finding chart of partial local standard stars). For the purpose of clearly showing the SN image, we intercept a picture with the field of view of from original one degree image, therefore only 5 out of 30 local standard stars are plotted in Figure 3.
These local standard stars, being used to calibrate, are listed in Table 3. The estimated error of each point is a quadrature of the uncertainties in bias and flat-field correction, aperture photometry, and calibrations (Zhou et al., 2003). The main source of the error comes from photon noises and uncertainties in the background subtraction.
We have also converted the BATC magnitudes of SN 1993J into the Johnson-Cousins system (, , bands), in an attempt to connect our measurements to the existing early-time broad-band photometry. These converted , , magnitudes are listed in the last three columns in Table 3. We need to point out, however, the transformation equations we have used (also listed at the beginning of this section) are derived from observations of normal stars, and may bear relatively large uncertainties when apply to the emission-dominated SN 1993J during its nebular phase.
3 Multicolor light curves
3.1 Light curves during the period 1995 to 2003
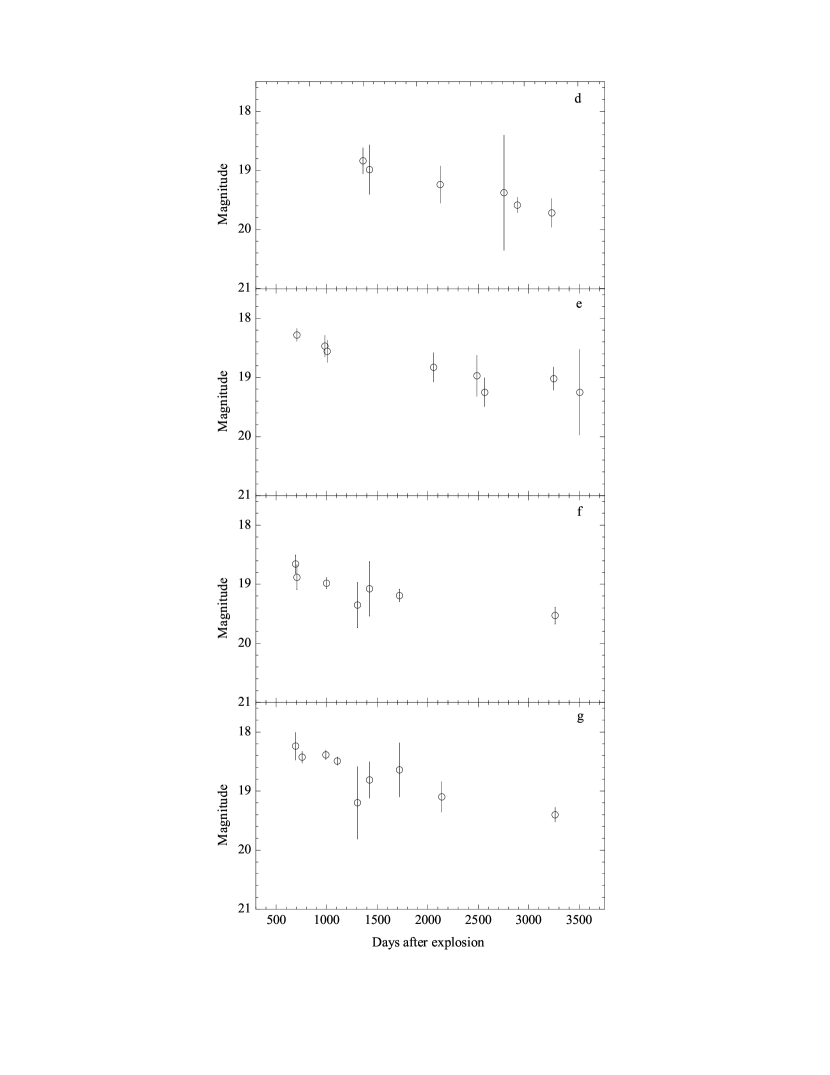
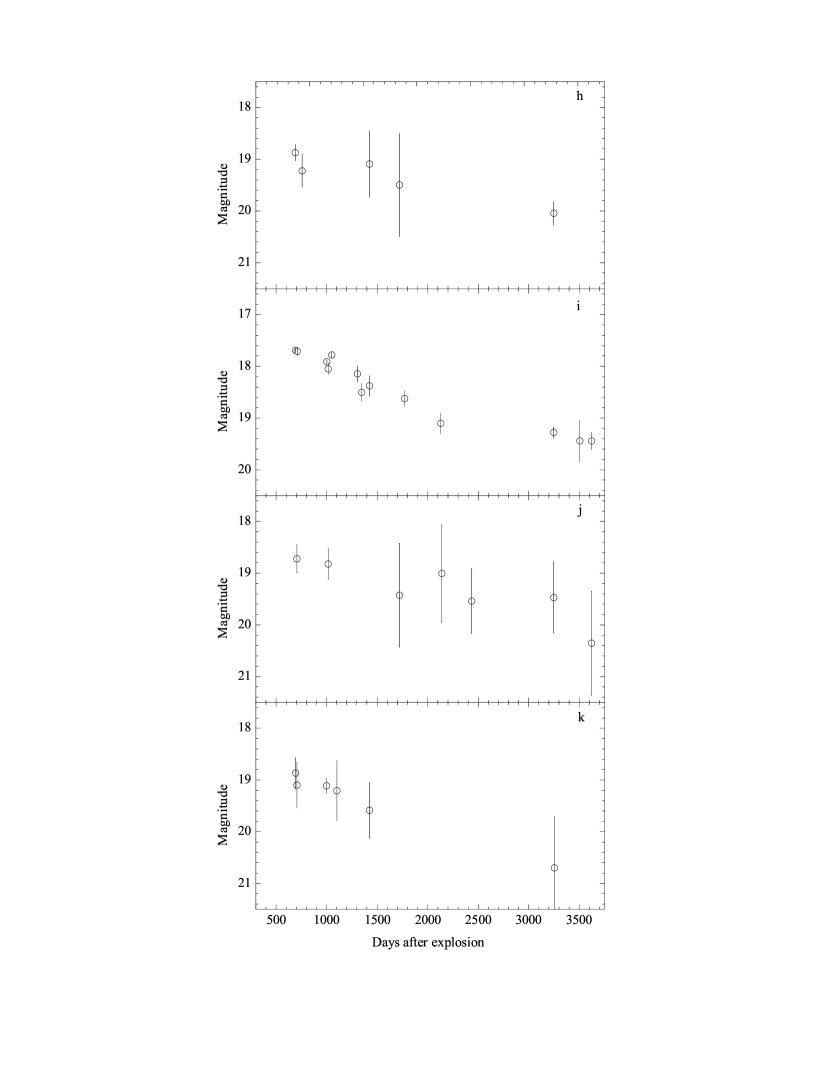
In the following sections, we adopt 1993 March 27.5 UT as the day of explosion for SN 1993J (Lewis et al., 1994). Our measured photometry of SN 1993J in the , , , and bands generally have low quality due to the low sensitivity of these filters, and will not be discussed hereafter. The light curves of SN 1993J in other bands are shown in Figure 4a (, , , and bands) and Figure 4b (, , , and bands) respectively.
The slow luminosity decline at late times, as listed in Table 3, is evident for SN 1993J. The decline rates in various bands are generally found to be 100 d-1 during the years from 1995 to 2003. The light curves in the and bands have only a few points, and reliable decline rates cannot be determined. The slow luminosity decline of SN 1993J in all the BATC bands suggests that there is a persistent energy source powering SN 1993J up to the most recent observations.
The light curve of band which centered on H, has overall the best quality among all the bands, and displays a distinct two-stage evolution: a relatively faster decline rate of mag 100 d-1 from 700 to 2100 days after explosion, and a relatively slower decline rate of mag 100 d-1 from 2100 to 3600 days after explosion. The light curves in all the other bands are consistent with a linear decline at all times.
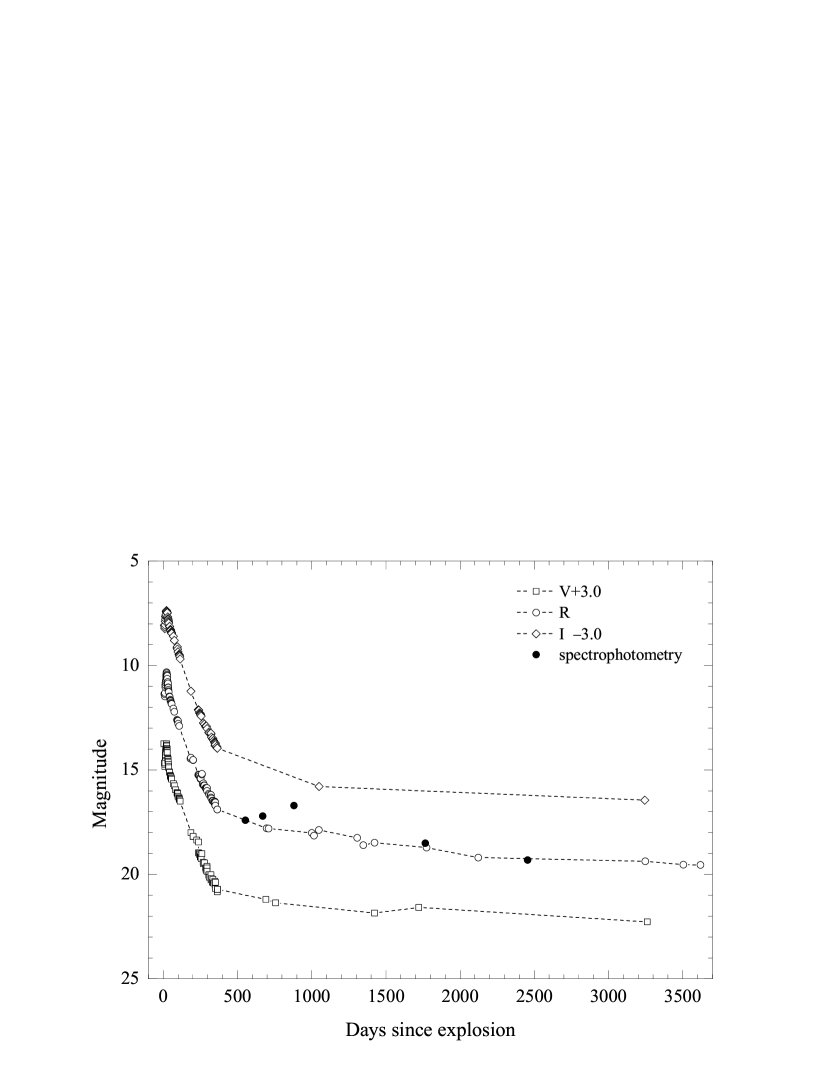
Figure 5 shows the evolution of SN 1993J in the , , passbands in the past decade. The earlier data are collected from Richmond et al. (1996) and Barbon et al. (1995), while those after 500 day were converted from our BATC magnitudes. All the light curves exhibit two distinct changes, the first at about 50 day after explosion, and the second at about 400 to 500 days after explosion. The late-time (500 day) decline rate of SN 1993J in is far smaller than that between 50 and 360 days after explosion (mag 100 d-1 vs 1.750.03mag 100 d-1). The dramatic slow-down after 500 day after may signal a change of physics for the energy source (see 4.2 for more discussions).
We have also constructed -band magnitudes from spectrophotometry based on the spectra published by Matheson et al. (2000a, b), and the result is shown as solid circles in Figure 5. The -band data from spectrophotometry is generally consistent with those converted from the BATC magnitudes except perhaps for day 881, which is brighter than the neighboring points by nearly 2 times. We suspect that this might be caused by they’s inaccurate flux calibration.
3.2 SEDs at several epochs
The late-time SED of SN 1993J can be best studied by spectroscopy such as these done by Matheson et al. (2000a, b). Alternatively, An SED could be constructed from the observed fluxes in various passbands at the same epoch. Due to the long exposure times to observe SN 1993J in the intermediate bands, however, it is impractical to observe all bands in a single night, and our definition of the same epoch refers to a reference date 30 days. This is reasonable, considering the very slow evolution of SN 1993J at late times.
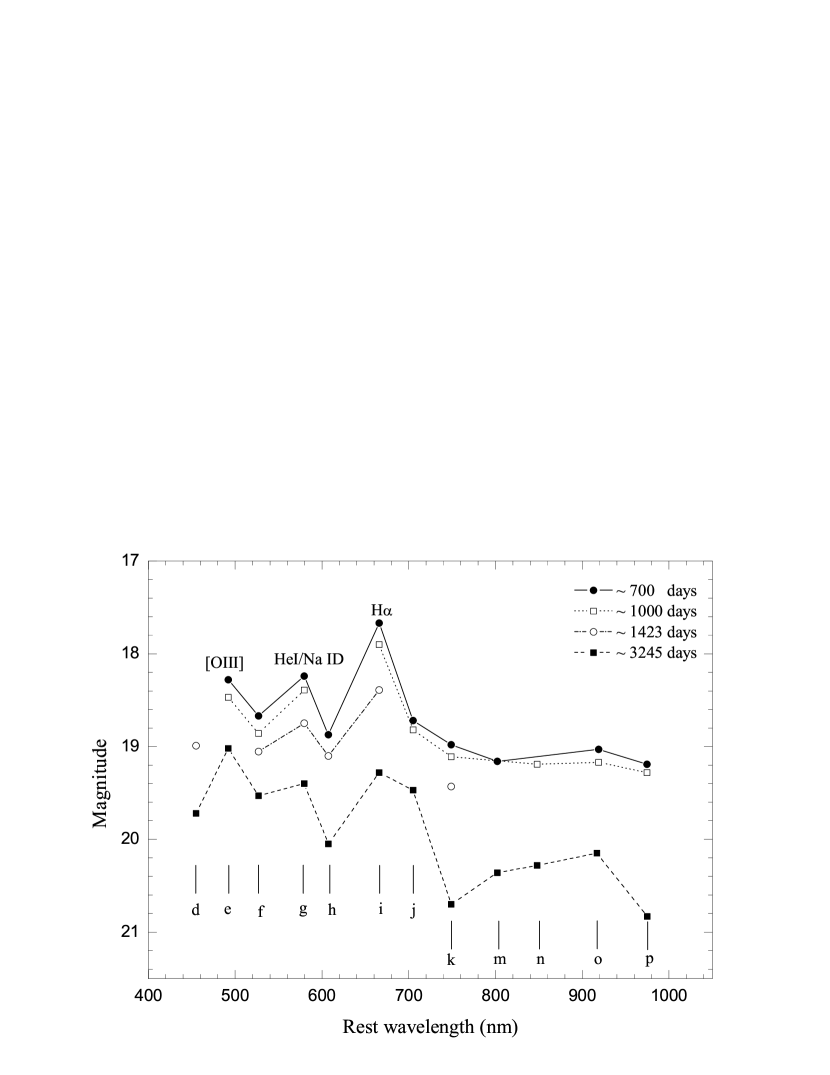
Figure 6 shows the SEDs of SN 1993J at 700, 1000, 1423, and 3245 days after explosion, respectively. The prominent feature in the SEDs is the strong emission from the band, which is an order of magnitude brighter than the neighboring and bands. The emissions in the and bands are also apparent. There is an apparent evolution in the shape of the SED: at 700 to 1000 days after explosion, the SED peaks at the band, while at 3245 day after explosion, the band has the strongest emission.
Figure 1 overplots the transmission curves of the BATC system on the spectral sequence of SN 1993J from Matheson et al. (2000b), and it can be seen that our intermediate-band filters have the advantage of properly covering some of the flat-topped lines of SN 1993J. Because of M81’s small heliocentric velocity (34 km s-1), the filter covers the emission lines near 4900 Å ([OIII] 4959, 5007 and H), the filter covers emission lines of He I 5876 and Na I 5890, 5896, while the filter covers the strong H emission. Thus each of the flux peaks seen in the SEDs corresponds to one or more strong emission lines in the spectra.
4 Discussion
4.1 The late-time emission lines
We can gain some knowledge about the evolution of some emission lines from our multicolor intermediate-band light curves. In theory, measuring the emission-line intensity directly from the photometry is difficult when there is no companion knowledge of the evolution of the line profile. This problem is somewhat mitigated because our photometric passbands are intermediate in size and the transmission curves are essentially flat in each band. Moreover, the late-time spectral sequence published by Matheson et al. (2000b) provides some useful information on the evolution of the line profiles. The detected emission lines, in order of decreasing strength, are listed below.
4.1.1 H emission
The total line flux is calculated by summing the contributions from each unit wavelength over a range determined by the FWHM. We estimate the FWHM of the H line profile at different epochs from the published spectra Matheson et al. (2000b). the FWHM of the H after 2500 day is unknown. According to the angular expansion revealed by The Very Long Baseline Interferometry (VLBI) observations (Bartel et al., 2002), the expansion velocity of SN 1993J’s radio shell does not change significantly after 1600 day, we therefore assume that the H line profile does not change after 2500 day. The effect of changing line width on the estimation of H flux will not exceed 10% even if we allow a decrease of 30 Å for the FWHM between 2500 and 3600 days.
Adopting a distance of 3.63 Mpc (Freedman et al., 1994) and mag toward SN 1993J (Richmond et al., 1994), we estimated the reddening corrected H luminosity from the -band light curve. Figure 7 shows the results of our calculations. Note that the calculation does not consider the contribution by the continuum. As a result, all measurements suffer from relatively large uncertainties. We estimate the uncertainty could be as large as if we consider the fluxes measured in the to bands as the continuum.
The current H emission corresponds to a luminosity of erg s-1. In particular, the evolution of the H emission from SN 1993J bears a strong resemblance to SN 1980K (Fesen, Hurford, & Matonick, 1995). The implication of a strong persistent H emission at late times for SN 1993J will be discussed in §4.2.
4.1.2 He I 5876/Na I 5890, 5896 emissions
The -band light curve traces the emission lines of He I 5876 and/or Na I 5890, 5896. The luminosity of the blended lines fades very slowly from year 1995 to 2002, decreasing by only mag. The total flux measured at the last observation (2002 Mar 3 UT) is erg cm-2 s-1, which corresponds to a luminosity of erg s-1. Detailed analysis of the spectrum on day 976 shows that He I 5876 and Na I 5890, 5896 contribute approximately equally to the broad emission feature around 5800Å (Matheson et al., 2000b). Assuming the two components have relatively the same intensity at all times, the above luminosity suggests that at the age of 8.9 yr after the SN outburst, the emission line intensity of He I 5876 or Na I D is about half of the H.
4.1.3 [O III] 4959, 5007 and H emissions
The -band light curve traces the evolution of [O III] 4959, 5007 and H. Matheson et al. (2000b) suggested that the contribution of Hβ to the total flux peak near 4900Å may be as high as 30-40% before day 976 (e.g. about 40% at day 670), and decreased significantly in the following several years (e.g. 22% at day 1766 and 9% at day 2454). As a result, the late-time -band light curve measures primarily the emission from the [O III] 4959, 5007 doublets. At an earlier stage, i.e. 2-3 yrs after explosion, the [O III] line emission is much weaker than H and the He I 5876 + Na I D blends. At the later stage, i.e. 8-9 yrs after explosion, however, the [O III] emission seems to gain predominance over the other emission lines so that it is the strongest after the age of 8.9 yr. The latest -band measurement (2002 Mar 3 UT) indicates an [O III] 4959, 5007 luminosity of erg s-1, which is higher than the H emission at the same epoch. This is also consistent with the spectral evolution reported by Matheson et al. (2000b).
4.2 The energy sources for the late-time optical emissions
Few SNe have had optical observations up to an age of 10 yr after explosion. The late-time photometry, especially through more than one filter, provides useful information on the underlying physics for the lingering light, such as the radioactive decay of long-lived isotopes, interaction with the circumstellar medium (CSM), light echoes and delayed optical input by finite recombination time. The question is how significant each component it is.
A slow late-time decline of H luminosity is in agreement with the predicted energy input from 44Ti decay (Woosely, Pinto, & Hartman, 1989). However, 44Ti or other long-lived radioactive species (56Co, 57Co, and 22Na) are unlikely to be important energy sources for SN 1993J’s optical emission at t 10 yr, as the amount of 44Ti (half-life 60 yr) needed to produce the current optical emissions (i.e. -band emission) is /3.63 Mpc), far greater than that predicted from models (Thielemann, Nomoto, & Hashimoto, 1996) or produced in SN 1987A (Woosely, Pinto, & Hartman, 1989). Thus the radioactive mechanism is unable to explain the bulk of the optical emission of SN 1993J at the age of 10 yr. This means that some other mechanisms must dominate the ionization and excitation of hydrogen.
If the progenitor of SNe emit materials for an extended period of time prior to exploding as a SN, they should be surrounded by a dusty CSM. The light from the SN explosion will scatter off this dust and produce a light echo. Since SN 1993J exploded near a spiral arm, it is expected to illuminate the interstellar and circumstellar material in the form of light echoes. It is likely that a light echo component exists in the light curves of many Type II SNe, the question is how significant the echo component is (Roscherr & Schaefer, 2000). Sugerman & Crotts (2002) revealed some light echo structures around SN 1993J by analyzing archival Hubble Space Telescope data. They derived an observed flux from the echoes as 4.3 ergs cm-2 s-1 Å-1 in years 2001, which is only about 5.4% of the H flux derived from our i-band observations at the same time ( ergs cm-2 s-1 Å-1). This suggests that the light echoes cannot account for the slow decay of the late-time light curves of SN 1993J.
The recombination emission might give some contribution to the optical input of supernova at late times due to the longer recombination time scales, as Kozma & Fransson (1992) showed for SN 1987A. However, the delayed recombination should not be responsible for SN 1993J’s late-time energy. Comparison of the H luminosity from model calculations (Kozma & Fransson, 1992) and observations of SN 1993J shows that the former is far smaller than the latter, e.g. 1.5erg s-1 vs. 2.8 erg s-1 at day 700. Moreover, non-thermal emission from a young pulsar appears an equally unlikely late-time energy source. Pulsar photoionization nebulae should produce narrow emission lines ( 1000 km s-1, Chevalier & Fransson 1992), in contrast to the broad emission features seen in SN 1993J’s late-time spectra (Matheson et al., 2000b).
Chevalier & Fransson 1994 (hereafter CF94) studied mass loss before the explosion of a SN and suggested that the interaction of the SN ejecta with the circumstellar wind could provide persistent energy to power the late-time light curves. In the models CF94 studied, cool, freely expanding SN ejecta colliding with CSM from a preexpansion stellar wind. A forward shock propagates into the wind, while a reverse shock moves back into the ejecta. The SN ejecta have a fairly steep density gradient, leading to a slow reverse shock with emission at far-UV wavelengths (possibly in X-rays, with a different gradient). This produces emission from highly ionized species. Absorption by a shell formed at the shock boundary can yield low-ionized lines, although these can also originate in the ejecta themselves. The fact that all late-time, optically detectable SNe (e.g., SNe 1957D, 1970G, 1979C, 1980K, 1993J) exhibit strong radio emission is consistent with the idea that the main late-time energy comes from the interaction between the expanding SN shell and slow moving CSM. Two different models of density profile have been considered for the structure of the wind. One is a power law, most applicable to a relatively compact progenitor, while the other uses the density structure of a red supergiant (RSG) from stellar evolution models. They make specific predictions, including the line intensity ratios and line profiles.
Table 5 list the observed line flux ratio (relative to H) and the predicted values from the CF94 model, both for the power-law wind structure and the RSG model. The measured flux ratios from our data extend from 1.9 to 9.6 yrs after the explosion of SN 1993J, thus providing a comparison with several epochs of the models. The flux ratios are corrected for the reddening of mag.
In general, the power-law density structure model provides better fits to the observed line ratios than the RSG wind model. In particular, the decrease in H emission from 1.9 to 9.9 yrs is well produced (the dashed lines in Figure 7). Assuming Na I D contributes to half of the intensity of the emission at 5800 Å, its observed flux matches the model prediction at 2 to 5 yrs after explosion, but falls short of the prediction at 10 yr (only about 50%). Part of the reason for this discrepancy could be caused by the changing ratio between Na I D and He I 5876 at very late times. The power-law density structure model of CF94, for example, predicts the Na I D line would be twice strong as He I 5876 at late times. Allowing a relatively large contribution of H to the [O III] 4959, 5007+H blend before day 1766 (), the observed [O III] 4959, 5007 flux matches the model prediction at 2 to 5 yrs after explosion. At 6.7 yr, the contribution of H to [O III]+ H blend is less than 10%. If we assume that all flux at 5000 Å are caused by [O III] at 10 yr, we found that the observed [O III] flux does not deviate significantly from the power-law model predictions. The RSG wind model (the last column in Table 5B) generally produces much stronger lines of [O III] 4959, 5000 and much weaker Na I D lines than observed.
5 Conclusions
We present intermediate-band photometry of SN 1993J from 692 to 3620 days after discovery, greatly extending the coverage of its evolution in the optical bands. The intermediate-band light curves show a very slow decline after day 700, fading at mag 100 d-1.
We constructed the SEDs of SN 1993J from the measured flux of the multicolor light curves. The SEDs show flux peaks near 4900 Å, 5800 Å, and 6600 Å in order of increasing strength, which are associated with the line emissions of [O III] 4959, 5007, Na I D/He I 5876, and H, respectively. The [O III] doublet emission gains dominance over time so that it becomes the strongest emission at day 3245.
Several emission lines seen in the SEDs of SN 1993J and their evolution provide evidences that the interaction of the ejecta with the CSM is the primary energy source to power the late-time optical emission. We also found that the power-law density profile model of the interaction model gives quantitative agreement with the observations. In particular, the line ratio of [O III] doublet and Na I D relative to H are well reproduced by the model.
In the years to come, it will still be interesting to monitor the evolution of the optical emission of SN 1993J. In particular, the strength of [O III] 4959, 5007 will increase continuously according to the circumstellar interaction model. Continued observations of old SNe such as SN 1993J offer us an opportunity to study the transition of evolved SNe into supernova remnants.
Appendix A Appendix: The numerical solution of the Laplace equation
The Laplace equation is:
| (A1) |
one needs the appropriate boundary conditions to solve this equation for . To solve the equation on a digital computer, it is usual to discretize the equation and to work with a finite lattice. The finite difference version to the Laplace’s equation is obtained by using the well known approximations:
| (A2) |
| (A3) |
Here we use for a row subscript, for a column subscript, and is the pixel value at each node of the mesh. Adding these two equations and setting the result equal to zero, yields the condition that the value at any mesh point must be equal to the average of its neighbors. This is another way of defining what is known technically as a ‘harmonic’ function. Expressed in symbols, using four grid neighbors, this gives the equation:
| (A4) |
References
- Barbon et al. (1995) Barbon, R., et al. 1995, A&AS, 110, 513
- Bartel et al. (2002) Bartel, N., Beitenholz M. F., Rupen M. P., et al. 2002, ApJ, 581, 404
- Benson et al. (1994) Benson, P., et al. 1994, AJ, 107, 1453
- Chevalier & Fransson (1992) Chevalier, R. A. & Fransson, C. 1992, ApJ, 395, 540
- Chevalier & Fransson (1994) Chevalier, R. A. & Fransson, C. 1994, ApJ, 420, 268
- Fan et al. (1996) Fan, X., Burstein, D., Chen J., et al. 1996, AJ, 112, 628
- Fesen, Hurford, & Matonick (1995) Fesen R. A., Hurford A. P. & Matonick D. M. 1995, AJ, 109, 2608
- Filippenko, Matheson, & Ho (1993) Filippenko, A. V., Matheson T., & Ho, L. C. 1993, ApJ, 415, L103
- Filippenko, Matheson, & Barth (1994) Filippenko, A. V., Matheson, T., & Barth, A., J. 1994, AJ, 108, 2220
- Freedman et al. (1994) Freedman, W. L., et al. 1994, ApJ, 427, 628
- Garcia (1993) Garcia, F., 1993, IAU Circ, 5731
- Kozma & Fransson (1992) Kozma C., & Fransson C. 1992, ApJ, 390, 602
- Lewis et al. (1994) Lewis, J. R., Walton, N. A., Meikle, W. P. S., et al. 1994, MNRAS, 266, L27
- Li et al. (2002) Li, W. D., Filippenko A. V., Van Dyk, S. D., et al. 2002, PASP, 114, 403
- Matheson et al. (2000a) Matheson, T., Filippenko, A. V., Barth, A. J., et al. 2000a, AJ, 120, 1487
- Matheson et al. (2000b) Matheson, T., Filippenko, A. V., Barth, A. J., et al. 2000b, AJ, 120, 1499
- Nomoto et al. (1993) Nomoto, K., et al. 1993, Nature, 354, 507
- Oke & Gunn (1983) Oke, J. B., & Gunn, J. E., 1983, ApJ, 266, 713
- Prabhu et al. (1995) Prabhu, T. P., Mayya, Y. D., Singh, K. P., et al. 1995, A&A, 295, 403
- Podsiadlowski et al. (1993) Podsiadlowski, Ph., Hsu, J. J. L., Joss, P. C., & Ross, R. R. 1993, Nature, 364, 509
- Richmond et al. (1994) Richmond, M. W., Treffers, R. R., Filippenko, A. V., et al. 1994, AJ, 107, 1022
- Richmond et al. (1996) Richmond, M. W., et al. 1996, AJ, 112, 732
- Roscherr & Schaefer (2000) Roscherr, B. & Schaefer, B. E. 2000, ApJ, 532, 415
- Schmidt et al. (1993) Schmidt, B. P., et al. 1993, Nature, 364, 600
- Stetson (1987) Stetson, P. B. 1987, PASP, 99, 191
- Sugerman & Crotts (2002) Sugerman, B. E. K., Crotts, A. P. S. 2002, ApJ, 581, L97
- Swartz et al. (1993) Swartz, D. A., et al. 1993, Nature, 365, 232
- Thielemann, Nomoto, & Hashimoto (1996) Thielemann F. K., Nomoto K., & Hashimoto M. A. 1996, ApJ, 460, 408
- Wheeler et al. (1993) Wheeler, J. C., et al. 1993, ApJ, 417, L71
- Woosely, Pinto, & Hartman (1989) Woosley, S. E., Pinto, P. A., & Hartmann, D. 1989, ApJ, 346, 395
- Woosley et al. (1994) Woosley, S. E., Eastman, R. G., Weaver, T. A., et al. 1994, ApJ, 429, 300
- Yan et al. (1999) Yan, H., Burstein, D., Fan X., et al. 2000, PASP, 112, 691
- Zhou et al. (2001) Zhou, X., Jiang Z., Xue, S., et al. CJAA, 1, 372
- Zhou et al. (2003) Zhou, X., Jiang, Z., Ma, J., et al. 2003, A&A, 397, 361

| Filter name | () | FWHM() | Limiting (mag) | aaThe number of images. | bbThe number of photometric nights. |
|---|---|---|---|---|---|
| d | 4540 | 332 | 20.5 | 6 | 6 |
| e | 4925 | 374 | 20.0 | 8 | 7 |
| f | 5267 | 344 | 20.0 | 7 | 4 |
| g | 5790 | 289 | 20.0 | 9 | 5 |
| h | 6074 | 308 | 20.0 | 5 | 3 |
| i | 6656 | 491 | 20.0 | 13 | 8 |
| j | 7057 | 238 | 20.0 | 7 | 7 |
| k | 7546 | 192 | 19.0 | 6 | 2 |
| m | 8023 | 255 | 19.0 | 4 | 2 |
| n | 8484 | 167 | 19.0 | 3 | 3 |
| o | 9182 | 247 | 19.0 | 5 | 3 |
| p | 9739 | 275 | 18.5 | 4 | 4 |
| ID. | (2000.0) | (2000.0) | d | e | f | g | h | i | j | k | m | n | o | p |
|---|---|---|---|---|---|---|---|---|---|---|---|---|---|---|
| 1 | 09:51:20.65 | 68:58:09.3 | 13.998(04) | 13.995(05) | 13.779(09) | 13.511(09) | 13.263(08) | 13.338(02) | 13.267(08) | 13.128(08) | 13.169(05) | 13.160(08) | 13.013(10) | 13.025(21) |
| 2 | 09:52:10.73 | 69:00:10.1 | 15.366(10) | 15.287(10) | 15.065(26) | 14.808(23) | 14.552(23) | 14.561(05) | 14.476(21) | 14.316(23) | 14.330(12) | 14.222(20) | 14.209(28) | 14.153(26) |
| 3 | 09:52:55.42 | 69:01:01.6 | 14.874(07) | 14.849(08) | 14.646(17) | 14.560(18) | 14.329(19) | 14.397(05) | 14.328(17) | 14.152(22) | 14.239(10) | 14.165(19) | 14.116(22) | 13.996(17) |
| 4 | 09:59:31.29 | 69:01:57.3 | 14.038(04) | 14.022(05) | 13.811(09) | 13.583(10) | 13.364(08) | 13.422(02) | 13.424(10) | 13.195(09) | 13.330(06) | 13.244(09) | 13.166(11) | 13.141(24) |
| 5 | 09:51:37.55 | 69:03:52.7 | 15.669(13) | 15.557(12) | 15.364(31) | 15.038(27) | 14.772(26) | 14.781(06) | 14.797(24) | 14.516(28) | 14.513(13) | 14.476(24) | 14.321(29) | 14.357(28) |
| 6 | 10:00:30.51 | 69:07:47.0 | 16.313(20) | 16.301(21) | 16.030(56) | 15.584(42) | 15.232(24) | 15.198(08) | 15.043(34) | 14.848(41) | 14.890(19) | 14.803(38) | 14.714(40) | 14.543(30) |
| 7 | 09:53:16.90 | 69:07:02.6 | 15.102(08) | 14.965(08) | 14.831(21) | 14.244(16) | 13.942(13) | 13.892(03) | 13.770(12) | 13.532(12) | 13.543(06) | 13.447(10) | 13.354(13) | 13.339(27) |
| 8 | 09:53:41.00 | 69:08:06.6 | 14.193(05) | 14.086(05) | 13.895(09) | 13.685(10) | 13.431(09) | 13.470(03) | 13.421(09) | 13.267(09) | 13.296(05) | 13.214(09) | 13.177(11) | 13.084(23) |
| 9 | 09:56:44.92 | 69:09:00.9 | 15.521(11) | 15.505(12) | 15.267(28) | 15.010(28) | 14.759(26) | 14.739(06) | 14.706(23) | 14.514(27) | 14.571(14) | 14.484(28) | 14.406(30) | 14.333(33) |
| 10 | 09:57:15.44 | 69:11:29.4 | 16.928(34) | 16.809(34) | 16.605(47) | 15.928(34) | 15.698(31) | 15.681(12) | 15.564(27) | 15.331(25) | 15.341(27) | 15.212(28) | 14.948(18) | 14.971(16) |
| 11 | 09:59:20.78 | 69:13:19.8 | 15.619(12) | 15.652(13) | 15.449(37) | 15.240(34) | 15.093(37) | 15.183(08) | 15.102(35) | 14.932(23) | 15.025(22) | 14.918(37) | 14.797(45) | 14.715(33) |
| 12 | 09:59:03.06 | 69:13:53.5 | 16.890(33) | 16.858(36) | 16.651(32) | 16.460(28) | 15.951(27) | 16.074(26) | 16.076(21) | 15.660(18) | 15.730(28) | 15.641(24) | 15.519(22) | 15.834(30) |
| 13 | 09:53:27.32 | 69:13:53.6 | 14.982(08) | 14.846(07) | 14.712(19) | 14.320(15) | 13.970(14) | 14.005(04) | 13.947(12) | 13.768(15) | 13.826(08) | 13.744(15) | 13.637(17) | 13.572(29) |
| 14 | 09:55:14.89 | 69:19:26.4 | 14.223(05) | 14.241(05) | 14.102(11) | 13.974(12) | 13.779(13) | 13.836(03) | 13.814(11) | 13.651(14) | 13.742(07) | 13.709(14) | 13.641(17) | 13.682(33) |
| 15 | 09:58:12.20 | 69:20:11.3 | 14.744(07) | 14.750(07) | 14.624(17) | 14.358(16) | 14.158(15) | 14.279(04) | 14.309(17) | 14.076(18) | 14.154(10) | 14.108(19) | 14.050(23) | 14.007(25) |
| 16 | 09:58:35.66 | 69:20:47.4 | 14.920(08) | 14.899(08) | 14.789(20) | 14.610(19) | 14.376(20) | 14.456(05) | 14.413(19) | 14.217(22) | 14.354(11) | 14.332(23) | 14.157(26) | 14.298(27) |
| 17 | 09:56:16.90 | 69:20:43.4 | 15.441(11) | 15.362(11) | 15.132(25) | 14.954(28) | 14.747(28) | 14.753(06) | 14.700(24) | 14.564(29) | 14.542(13) | 14.540(26) | 14.457(31) | 14.284(24) |
| 18 | 09:52:54.07 | 69:21:15.9 | 14.846(07) | 14.783(07) | 14.660(19) | 14.523(17) | 14.311(18) | 14.400(04) | 14.354(17) | 14.189(22) | 14.321(10) | 14.271(21) | 14.134(25) | 14.280(28) |
| 19 | 09:56:18.84 | 69:23:43.7 | 15.508(12) | 15.470(12) | 15.344(31) | 15.135(27) | 14.849(29) | 14.937(07) | 14.818(25) | 14.705(38) | 14.769(17) | 14.773(29) | 14.783(34) | 14.520(32) |
| 20 | 09:52:21.53 | 69:29:30.6 | 15.478(12) | 15.389(11) | 15.317(30) | 14.989(24) | 14.794(28) | 14.880(06) | 14.783(26) | 14.701(35) | 14.723(16) | 14.616(29) | 14.628(38) | 14.616(39) |
| 21 | 09:52:09.61 | 69:29:56.3 | 17.335(46) | 17.178(43) | 17.083(35) | 16.537(39) | 16.625(37) | 16.796(37) | 16.493(31) | 16.497(33) | 16.593(34) | 16.530(34) | 16.219(29) | 16.798(45) |
| 22 | 09:58:47.33 | 69:33:14.1 | 15.606(12) | 15.640(12) | 15.499(35) | 15.342(35) | 15.039(34) | 15.160(08) | 15.099(33) | 14.984(39) | 14.940(18) | 14.942(42) | 14.957(50) | 14.767(30) |
| 23 | 09:53:49.38 | 69:33:56.8 | 15.591(13) | 15.617(12) | 15.366(33) | 15.405(35) | 15.122(39) | 15.291(09) | 15.236(35) | 15.124(35) | 15.192(26) | 15.133(43) | 15.023(25) | 15.333(34) |
| 24 | 09:59:56.37 | 69:39:19.1 | 14.634(06) | 14.690(07) | 14.495(17) | 14.349(15) | 14.161(17) | 14.265(04) | 14.246(17) | 14.015(19) | 14.139(10) | 14.117(20) | 14.072(22) | 14.028(48) |
| 25 | 09:58:21.48 | 69:41:17.9 | 15.042(08) | 14.989(08) | 14.789(20) | 14.584(20) | 14.407(21) | 14.477(05) | 14.492(19) | 14.234(22) | 14.297(11) | 14.367(24) | 14.218(25) | 14.125(50) |
| 26 | 10:00:03.31 | 69:42:44.3 | 16.437(24) | 16.227(19) | 15.894(50) | 15.214(32) | 14.981(31) | 14.761(06) | 14.632(22) | 14.105(20) | 14.054(09) | 13.915(17) | 13.796(18) | 13.675(36) |
| 27 | 09:56:49.93 | 69:43:51.6 | 17.125(41) | 17.137(41) | 16.736(35) | 16.514(34) | 16.164(37) | 16.093(16) | 15.933(23) | 15.935(26) | 15.710(34) | 15.523(22) | 15.456(22) | 15.700(35) |
| 28 | 09:50:16.86 | 69:42:54.6 | 16.029(17) | 16.014(18) | 15.900(31) | 15.640(20) | 15.422(25) | 15.509(09) | 15.486(29) | 15.283(32) | 15.322(28) | 15.199(20) | 15.269(19) | 14.967(23) |
| 29 | 09:59:21.70 | 69:48:37.8 | 15.739(13) | 15.699(13) | 15.504(37) | 15.253(35) | 15.033(35) | 15.056(07) | 15.017(32) | 14.843(37) | 14.864(17) | 14.873(38) | 14.752(39) | 14.745(35) |
| 30 | 09:54:34.19 | 69:48:36.3 | 15.108(09) | 15.158(09) | 14.927(22) | 14.771(23) | 14.571(24) | 14.637(05) | 14.604(23) | 14.438(26) | 14.464(13) | 14.437(24) | 14.438(32) | 14.470(27) |
Note. All quantities are magnitudes. Uncertainties in the last two digits are indicated in parentheses.
| Datea | d | e | f | g | h | i | j | ||||||||
|---|---|---|---|---|---|---|---|---|---|---|---|---|---|---|---|
| 692 | 18.66(15) | 18.24(23) | 18.87(16) | 17.69(05) | 18.87(30) | 18.25 | 17.79 | ||||||||
| 708 | 18.28(11) | 17.71(08) | 18.72(26) | 19.10(44) | 19.16(46) | 19.03(54) | 19.19(68) | 17.81 | |||||||
| 757 | 18.88(20) | 18.42(10) | 19.22(32) | 18.36 | |||||||||||
| 982 | 18.47(18) | 18.39(08) | |||||||||||||
| 1000 | 18.56(19) | 18.96(09) | 17.91(04) | 19.11(15) | 19.14(37) | 18.01 | |||||||||
| 1016 | 18.05(11) | 18.82(29) | 18.15 | ||||||||||||
| 1050 | 17.78(05) | 19.19(48) | 19.17(43) | 19.28(52) | 17.88 | 18.80 | |||||||||
| 1105 | 18.49(07) | 19.21(58) | 19.44(37) | 18.85(60) | 18.95(57) | ||||||||||
| 1306 | 19.35(38) | 19.20(61) | 18.15(15) | 18.25 | |||||||||||
| 1358 | 18.84(22) | 18.50(18) | 18.60 | ||||||||||||
| 1423 | 18.99(41) | 19.08(46) | 18.81(30) | 19.09(64) | 18.38(21) | 19.43(54) | 18.85 | 18.48 | |||||||
| 1721 | 19.19(10) | 18.64(46) | 19.50(83) | 19.43(99) | 18.59 | ||||||||||
| 1780 | 18.62(15) | 20.14(96) | 18.72 | ||||||||||||
| 2059 | 18.83(25) | ||||||||||||||
| 2126 | 19.24(31) | 19.10(26) | 19.11(20) | 19.01(94) | 19.21 | ||||||||||
| 2436 | 19.54(63) | 20.11(82) | |||||||||||||
| 2487 | 18.97(35) | ||||||||||||||
| 2563 | 19.25(41) | ||||||||||||||
| 2755 | 19.38(97) | ||||||||||||||
| 2888 | 19.59(13) | ||||||||||||||
| 3245 | 19.72(24) | 19.02(19) | 19.53(14) | 19.40(12) | 20.05(23) | 19.28(11) | 19.47(68) | 20.70(99) | 20.36(74) | 20.28(95) | 20.15(110) | 20.83(126) | 19.28 | 19.38 | 19.46 |
| 3504 | 19.15(24) | 19.44(41) | 19.44(41) | 19.54 | |||||||||||
| 3620 | 19.44(17) | 20.35(100) | 19.54 |
aDays after explosion, 1993 March UT27.5.
| Band | PhaseaaDays after explosion, 1993 March UT27.5. (days) | Decline rate (mag 100d-1) |
|---|---|---|
| d | 1358-3245 | |
| e | 708-3504 | |
| f | 692-3245 | |
| g | 692-3245 | |
| h | 692-3245 | |
| i | 692-3600 | |
| j | 708-3600 | |
| k | 692-3245 | |
| m | 708-3245 | |
| n | 1000-3245 | |
| o | 708-3245 | |
| p | 708-3245 |
| Age (year) | ||||||
|---|---|---|---|---|---|---|
| Emission Line | 1.9 | 2.7 | 4.8 | 5.7 | 8.9 | 9.6 |
| aaThe luminosity of in erg . | 2.84 | 2.10 | 1.03 | 0.63 | 0.45 | 0.41 |
| Na I D+He I5876 | 0.60 | 0.71 | 0.86 | 1.12 | 1.06 | |
| 4959-5007+ | 0.58 | 0.69 | 1.50 | 1.69 | 1.72 | |
| Age (year) | ||||
|---|---|---|---|---|
| Emission Line | 2 | 5 | 10 | 10(RSG)bbRSG is the red supergiant model at 10 yr. |
| aaThe luminosity of in erg . | 0.96 | 0.19 | 0.09 | 0.49 |
| Na I D | 0.38 | 0.61 | 1.00 | 0.17 |
| 4959-5007 | 0.27 | 1.00 | 2.20 | 3.40 |