Gravitational Lensing Signatures of Supermassive Black Holes in Future Radio Surveys
Abstract
Observational measurements of the relationship between supermassive black holes (SMBHs) and the properties of their host galaxies are an important method for probing theoretical hierarchical growth models. Gravitational lensing is a unique mechanism for acquiring this information in systems at cosmologically significant redshifts. We review the calculations required to include SMBHs in two standard galactic lens models, a cored isothermal sphere and a broken power law. The presence of the SMBH produces two primary effects depending on the lens configuration, either blocking the “core” image that is usually predicted to form from a softened lens model, or adding an extra, highly demagnified, image to the predictions of the unaltered lens model. The magnitudes of these effects are very sensitive to galaxy core sizes and SMBH masses. Therefore, observations of these lenses would probe the properties of the inner regions of galaxies, including their SMBHs. Lensing cross-sections and optical depth calculations indicate that in order to fully observe these characteristic signatures, flux ratios of order or more between the brightest and faintest images of the lens must be detectable, and thus the next generation of radio telescope technology offers the first opportunity for a serious observational campaign. Core images, however, are already detectable and with additional observations their statistics may be used to guide future SMBH searches.
Subject headings:
black hole physics — galaxies:evolution — gravitational lensing — surveys — telescopes1. INTRODUCTION
The central regions of galaxies contain a great deal of information regarding their formation and evolution. The mass-density profiles of these inner regions have been recognized for sometime as important measures of cold dark matter models (Navarro et al., 1997; Keeton & Madau, 2001), and more recently, the properties of central supermassive black holes (SMBHs) have emerged as important probes into the history of hierarchical growth models.
SMBHs are inferred compact objects with masses between and solar masses. Several empirical correlations have been identified between SMBH masses and the properties of their host galaxies, including correlations with the mass or luminosity of the galactic bulge (Magorrian et al., 1998; Kormendy et al., 2000; Laor, 2001), with the bulge velocity dispersion (Gebhardt et al., 2000; Merritt & Ferrarese, 2001), and also with the light concentration of the bulge (Graham et al., 2001). Recent analysis suggests that SMBH mass may additionally be correlated with the circular velocity of the host galaxy, even beyond the optical radius (Ferrarese, 2002; Baes et al., 2003), and thus there may be a link between the SMBH mass the total mass of the galaxy. Because of this apparently tight link between SMBHs and their host galaxies, including dark matter halos, it is likely that the formation of both were closely related. Most contemporary hierarchical growth models do in fact reflect this property (Silk & Rees, 1998; Kauffmann & Haehnelt, 2000; Burkert & Silk, 2001; MacMillan & Henriksen, 2002; Wyithe & Loeb, 2002; Volonteri et al., 2003; Di Matteo et al., 2003).
The detection of SMBHs is difficult and traditionally has been achieved using stellar kinematics in the very central regions of galaxies. These techniques have been feasible only for relatively nearby galaxies ( Mpc, ) (Tremaine et al., 2002) in which the cores can be resolved. SMBHs are presumed to be the inactive relics of active galactic nuclei, and thus, have evolved over a long redshift history ( to present). Motivated, in part, by the desire to observe this evolution, additional techniques for deducing SMBH mass in more distance galaxies have been developed. The most prominent of these is the use of gravitationally broadened emission lines in active galactic nuclei to infer SMBH mass in these objects (McLure & Dunlop, 2001).
Gravitational lensing offers a compelling mechanism to explore the relationship between the properties of SMBHs and their host galaxies at intermediate redshifts, extending to or greater. Examination of strong galaxy-galaxy (or galaxy-quasar) gravitational lenses under proper circumstances may yield the mass of the SMBH, information on the inner mass-density profile of the host galaxy, and the total mass of the galaxy simultaneously, greatly simplifying existing observational hurdles.
Relatively minimal consideration has been given to the gravitational lensing properties of SMBHs in galaxies, however. Alexander & Loeb (2001) have considered the SMBH in the Milky Way, discussing the influence of stellar neighbors on its lensing properties, as well as the effects of its gravitational shear on the microlensing of individual stars. For galaxy-galaxy lensing, only Mao et al. (2001) and Chen (2003) have made general analyses. The former demonstrate calculations for adding a SMBH to a standard galactic lensing potential and the latter shows how SMBHs can affect image separations in lenses. Keeton (2003) considers a sample population of 73 mock lenses and calculates lensing statistics including SMBHs effects. He is interested in observing core images, which contain information about the inner mass-density profiles of galaxies, and finds that SMBHs should reduce the probability of observing the faintest of these images, but otherwise not generally affect core images. Using observational data, Rusin & Ma (2001) show that explicitly including SMBHs in models weakens constraints on mass profiles in the inner regions of galaxies and Winn et al. (2004) have achieved an upper bound of solar masses for any SMBH in the lens system, PMN J1632-0033. Wambsganss & Paczynski (1992) discussed using VLBI observations to detect SMBHs in galaxy halos, and Wilkinson et al. (2001) and Augusto & Wilkinson (2001) placed limits on the abundance of supermassive compact objects in the universe.
In this paper we expand upon these initial efforts and provide a general context for interpreting SMBH effects in lensing studies. In particular, we will elaborate on the discussions of Keeton (2003) and Mao et al. (2001) regarding the impact of SMBHs on observing core images and also perform calculations to determine the likelihood of directly observing SMBH lensing signatures. We begin in Section 2 by presenting two common galactic lens models and performing the calculations to describe the addition of a SMBH to each. From these modified models we establish criteria which a lens-source system must meet in order for SMBH effects to be detectable. In Section 3 we use these criteria to compute cross-sections for the production of observable lensing events. Using the observed local relation between SMBH mass and bulge velocity dispersion, these cross-sections are convolved with the velocity dispersion distribution of galaxies to establish estimated optical depths to lensing. We conclude, in Sections 4 and 5, by summarizing the lensing signatures of SMBHs and discussing their effects on other lensing studies, such as the search for core images, and also how SMBH signatures themselves might be observed with existing and proposed future facilities.
2. ANALYTICAL TREATMENT OF LENS MODELS
2.1. Lensing by a Single Galaxy with a SMBH
In order to determine the statistics of lensing by a supermassive black hole in a galaxy core, we must first address the mechanics of the lensing. In this section we review the properties of combined galaxy and black hole lensing, emphasizing those aspects that are important for the determination of cross-sections for lensing statistics. The SMBH is modeled as a point mass and we consider two models for the potential of a lensing galaxy, a cored isothermal sphere and a broken power law. It has been recognized for some time that the observable surface brightnesses in the central regions of galaxies do not actually approach zero slope as implied by the canonical cored isothermal potential. This has been the motivation for various broken power law parameterizations for surface brightness, such as the “Nuker Law” (Lauer et al., 1995; Byun et al., 1996; Faber et al., 1997; Zhao, 1997). While surface brightness has indeed been shown to be well represented by a broken power law, the actual mass-density distribution remains largely unknown and hence we will treat both models in parallel for this paper.
2.1.1 Point Mass and Cored Isothermal Sphere (PM+CIS)
We begin by considering a point mass potential added to a cored isothermal sphere potential. A similar treatment has already been performed by Mao et al. (2001) starting from a cored isothermal sphere mass-density. The distinction is subtle and the resulting behavior is quite similar. The advantage to the approach followed here is that the characteristic equations are straightforward.
Assuming the lensing occurs in the weak field limit, the standard one-dimensional lens equation is (Scheider et al., 1992, Section 5.1)
| (1) |
where is the position of the image, is the position of the source as measured from the center of the lens, is the two-dimensional projected potential of the lens, and represents the deflection angle. For an isolated point mass,
| (2) |
and for an isolated galaxy with a cored isothermal lensing potential,
| (3) |
(Narayan & Bartelmann, 1996, Table 2). The core radius of the galaxy potential is denoted by and the Einstein radii of the black hole and galaxy are denoted by and , respectively:
| (4) | |||
| (5) |
The velocity dispersion of the galaxy is , the mass of the black hole is , and the distances from observer to lens, lens to source, and observer to source are , , and , respectively.
For the weak field limit, lensing potentials add linearly, thus a reasonable projected potential for lensing by a galaxy with an SMBH is obtained by simply combining these two potentials to give
| (6) |
and results in the lens equation,
| (7) |
For circularly symmetric lens potentials the magnification at any image position is given by (Scheider et al., 1992, Section 2.3)
| (8) |
where is the magnification. The critical curves in the image plane can be found by setting this equation equal to zero (), which yields two conditions:
| (9) |
and
| (10) |
The first condition produces a single caustic point at the origin of the source plane, while the second condition produces two concentric caustic circles. In the image plane, the first condition is responsible for the outer of two critical curves, and the second condition for the inner plus a critical point at the origin. Figure 1 illustrates the transformation from the CIS potential to the PM+CIS potential in terms of the image positions and magnifications as a function .
2.1.2 Point Mass and Broken Power Law Isothermal Sphere (PM+POW)
We now derive a similar set of expressions for lensing by a point mass potential added to a circularly symmetric broken power law. In this case, the surface mass density is a more natural starting point and is given by (Keeton, 2003)
| (11) |
where and are inner and outer power law indices, respectively, is the break radius between the power laws, is the surface brightness at the break radius, gives the sharpness of the break, and is the mass-to-light ratio. This yields (Keeton, 2003) a lensing deflection angle,
| (12) | |||||
where is the critical surface density for lensing and is the hypergeometric function. This model has introduced several new parameters that are not present in the cored isothermal sphere. Later, we shall wish to explore the effects of these new parameters and compare the outcome back to the cored isothermal model. To facilitate that effort we now restrict the outer power index to its isothermal equivalent, , and recognize that, under this condition, in the limit the surface mass density must match that for the singular isothermal sphere. Doing so, we have
| (13) |
Using
| (14) |
we find the relation
| (15) |
and are able to write the deflection angle for the combined point mass and broken power law in terms of :
| (16) | |||||
2.1.3 Typical Values of , , , , and
The empirical correlation in the local universe between the masses of SMBHs and the velocity dispersions of their host galaxy bulges can be exploited to determine a typical value of . Observable lenses are dominated by elliptical lensing galaxies (Turner et al., 1984). For elliptical galaxies we can ignore the distinction between the velocity dispersion of the bulge and the galaxy as a whole. Therefore, we assign the SMBH its mass according to (Merritt & Ferrarese, 2001):
| (17) |
where is equal to the (bulge) velocity dispersion and is the solar mass. If we temporarily assume that this relationship holds for all galaxies, even beyond the local universe, we can generate characteristic curves for as a function of , , , and by substituting the above result into Equation 4. Figure 2 illustrates the behavior of for different lens and source galaxy distances. For lenses located roughly halfway to the source, which because it is most efficient for lensing will dominate (Turner et al., 1984, Figure 5), there is not much variation in for a fixed velocity dispersion. Galaxies with different velocity dispersions will produce different ratios.
There is to date no empirical understanding of any relationship between galaxy cores and other observables similar to that for SMBHs. The parameterizations we have chosen use angular measures for the core and break radii which, when mapped back to physical lengths, are dependent on the redshifts of the lens and source galaxies, complicating their interpretations. Figure 3 gives the relationship between the angular and linear radii. (From here on we will simply refer to and as the core radius regardless of the model under discussion.)
For the PM+POW model, we have already restricted the outer power law index, , to match the isothermal potential, but left and unconstrained. Figure 4 illustrates the effects of varying these parameters. Drawing on the reported ”Nuker Law” model fits, we can calculate average values for these parameters. In Table 1 we compute the mean and median values for the 26 ”cored” galaxies listed in Faber et al. (1997, Table 2).
| Parameter | Mean | Median |
|---|---|---|
| 2.35 | 2.03 | |
| 0.09 | 0.08 | |
| 1.28 | 1.33 | |
| (arcsec) | 1.71 | 1.29 |
Note. — These averages were calculated for the “cored” galaxies listed in Faber et al. (1997, Table 2). Those authors use to indicate the outer power law index, whereas we have used .
Based on these findings, we will take and for all subsequent calculations. From Table 1, it is also apparent that forcing , as we did above, was not a bad approximation to these observational results.
2.1.4 Shear and Ellipticity
We constrain our analysis to circularly symmetric lensing potentials for this paper in order to better illustrate the dependence on fundamental parameters. As it is well known, however, gravitational lenses seem to rarely display such simple symmetry and are often best modeled by elliptical mass density potentials or by including a gravitational shear in the local environment. In Appendix A we present a justification for neglecting the contribution of these higher order factors in our exploration of the fundamental behavior of these systems.
2.2. Signatures of SMBH Lensing
The addition of a SMBH to an otherwise typical galactic lensing potential produces three significant effects: 1) two-image lensing extends infinitely beyond the Einstein radius of the galaxy, 2) the maximum number of images increases from three to four, and 3) the area of the region in the source plane expected to produce more than two images is reduced compared to a cored or broken power law galactic potential with no SMBH. In general, for most source positions, , the lensing characteristics of the combined SMBH and galaxy act as if they were merely superimposed, and only conspire in the central regions of the source plane to cancel out the secondary images that either would have produced alone.
Both the cored and broken power law potentials demonstrate these properties. In both models, the source plane is divided into three regions by two concentric circular caustics and a degenerate caustic point at the origin. In fact, as shown in Figure 1 with the PM+CIS model, for different values of the source position, either one or three secondary images may form opposite the position of the primary image. For the cases in which we are interested, the core radius and point mass have little effect on the properties of the primary image (“A”), but can dramatically change the properties of the three possible secondary images (“B”, “C”, and “D”).
Image B, where it exists, will be a saddle point in the light travel time and will have negative magnification. It will lie very close to the location of the secondary image that would form from a singular isothermal sphere potential alone, and therefore, provides little information about the properties of the core of the galaxy or the SMBH. Image C will be a maximum of the light travel time and will have positive magnification. It will carry information about the degree of softening of the galaxy’s potential, generally becoming brighter for larger cores and fainter for smaller cores. Image D will be another saddle point in the light travel time and again will have negative magnification. For most source positions, it will track the position and magnification of the image that would form from an isolated point mass potential, thus providing information about the SMBH. Image D is present even without images B and C for source positions with sufficiently large .
Keeton (2003) points out that including SMBHs in lensing calculations has the affect of ”swallowing” faint core images. Figure 1 demonstrates that for sufficiently small impact parameters, where core images would be faintest, the SMBH does indeed eliminate the core image that would have formed in its absence. Furthermore, Figures 4 and 5 demonstrate that, for a given , the size of the region excluding core images is dependent on the other properties (, or , , and ) of the inner region of the host galaxy. Referring again to Figure 5, it is easily seen that for both models, reducing the core radius pushes the caustics out and closer together until ultimately they merge (this actually occurs before the core radius goes to zero, although the exact configuration is not shown in the plotted sequence). Therefore, smaller core radii decrease the likelihood of observing four-image lenses as can be seen in Figure 6 where we have plotted the area between the caustics as a function of core radius for multiple curves of constant . This plot also demonstrates that increasing also acts to reduce the region of four images. This degeneracy accounts for the weakening of constraints on inner mass-profiles discussed by Rusin & Ma (2001).
3. NUMERICAL ANALYSIS OF THE MODELS
3.1. Lensing cross-sections
As we have seen, the PM+CIS and PM+POW models produce lenses with a minimum of two images and a maximum of four images, depending on the source position. We would like now to extend the analysis and gain insight into the likelihood of observing these images, particularly image C and image D. To do so, we must introduce a parameter which relates to the observational ability to detect an image. Let us assume, for simplicity, that an image can be detected if it produces a flux that is above a specified fraction of the flux produced by the primary image:
| (18) |
where is the maximum detectable dynamic range between images and is the parameter we will use in the following calculations. The cross-section for detection is then defined as the area in the source plane that produces images which meet this requirement, and is in general characterized by two extreme source positions, and , such that the total angular area, , is given by
| (19) |
In this expression, , , and are implicitly dependent on the core radius, the SMBH Einstein radius, the galaxy Einstein radius, and the maximum dynamic range.
We are now in a position to calculate the characteristic lensing cross-sections for the PM+CIS and PM+POW models. We consider three cross-sections: 1) for detecting two images (A and B, or A and D), 2) for detecting three images (A, B, and C), and 3) for detecting four images (A, B, C, and D). The cross-section for observing three images is, in fact, the sum of two of the annuli discussed above, one along the inner caustic and the other along the outer caustic. Due to the nature of the lensing potential equations, numerical methods were employed to determine and for a range of model parameters to a precision of . The results are discussed below.
3.1.1 Two Images
It is clear from Figure 5 that combining a point mass and isothermal sphere produces the possibility for a very large two-image cross-section. In fact, without a maximum dynamic range constraint the cross-section would be theoretically unbounded, and even for finite dynamic range constraints, may be well beyond the standard singular isothermal sphere limit of . To see more quantitatively how dynamic range affects the cross-section, Figure 7 plots as a function of core radius for several values of , ranging from to , with fixed at . There are two striking features in this plot. First, there is a degeneracy of cross-section curves, around (the same feature is visible in Figure 8). This is caused by the disparity in magnification between image B and the image D tail, both of which can contribute to the two-image cross-section. The disparity reduces as the core radius is reduced and eventually, for cores less than about , disappears because the source plane is no longer divided into three regions, but only one that always produces two images (see Figure 5, particularly the bottom row). This situation eliminates the distinction between our labels “B” and “D” for images, although, for the secondary image has properties similar to those of a typical image B and, for , the magnification drops toward that of a typical image D. This smooth decrease in magnification near for lenses with small core radii is responsible for the second noticeable feature: cross-sections increase rapidly with dynamic range for small core radii since there is no step function in magnification to overcome as is the case for larger core radii.
The SMBH has an effect on the cross-section, as well. Figure 8 specifically addresses this dependence, and from it we see that the two-image cross-section increases with . This is due to the image D tail increasing in magnification for larger SMBH mass scales. The effect is most dramatic for small core radii.
3.1.2 Three Images
For the three-image cross-section, it is also useful to begin by examining the limit of no dynamic range constraints. In this case, the region in the source plane that produces three observable images is defined completely by the two concentric caustics as discussed at the end of Section 2 and plotted in Figure 6. This represents an upper bound for the three-image cross-section which is plotted in Figures 8 and 7. Large dynamic ranges will saturate to this limit. As the dynamic range is lowered, the cross-section reduces with the most rapid decline at small core radii. This can be understood from examination of Figure 5, once again noting that the magnification of the image C generally decreases as core radius decreases. It is no coincidence that the range of core radii that produce a significant three-image cross-section corresponds to the range where the two-image cross-section is highly degenerate since both trace the portion of parameter space that is dominated by the region in the source plane between the two concentric caustics.
Unlike the two-image cross-section, increasing the SMBH mass scale decreases the three-image cross-section. This is another manifestation of the image “swallowing” previously described in Section 2.
3.1.3 Four Images
3.2. Lensing Statistics
In this section we derive the optical depth to lensing for a given source using the calculated cross-sections from above and following the standard method (Turner et al., 1984; Scheider et al., 1992, Chapters 11 and 12). If we assume that the lensing objects have a local comoving number density that can be written as , then the differential optical depth of a lensing event occurring at a redshift for a source at is
| (20) |
Here we constrain according to Equation 17 and have explicitly written the cross-section, A, as a function of velocity dispersion, lens redshift, and source redshift to highlight its dependence on these parameters. It is, of course, still dependent on the choice of core radius and dynamic range, as well. is again the angular diameter distance between the observer and lens, and, in a homogeneous, isotropic universe we have (Hogg, 1999)
| (21) |
where is the speed of light, is the lookback time, and , , , and are the standard cosmological parameters with . Conceptually, all that remains is to select the form of the density distribution function. It is common in gravitational lens studies to utilize either the Press-Schechter formalism (Press & Schechter, 1974) or the Schechter luminosity function (Schechter, 1976) to generate this distribution. We have chosen to use the Schechter luminosity function combined with the Faber-Jackson relation and have also assumed no number density evolution with redshift to cast the density distribution in terms only of velocity dispersion giving:
| (22) |
We use the same choices of parameters , , and , and abundances, , of spiral, SO, and elliptical galaxy types as Ofek et al. (2003) and have reprinted them in Table 3.2.
The redshift distribution function of extragalactic flat-spectrum radio sources is localized around and has a mean value of (Muñoz et al., 2003). We will assume that treating all sources as if they were at the mean redshift is sufficient and take . We are now prepared to calculated the optical depth to lensing for each cross-section of interest by integrating over velocity dispersion and redshift. Again these calculations must be carried out numerically because the cross-sections themselves are not analytical.
| Parameter | Spiral | S0 | Elliptical |
|---|---|---|---|
References. — Ofek et al. (2003)
The results of these calculations are presented in Figure 9. For two-image lensing, we see that the optical depth to lensing, , parallels the cross-section curves for this case. For high maximum dynamic range, the probability is quite high, and as the dynamic range is lowered to more typical values of , the probability approaches the expected value for lensing by a population of singular isothermal spheres of (Browne et al., 2003), as it must since this result has been observationally justified.
The optical depth to lensing for three- and four-image cases are also similar to their cross-sections, with the four image case suffering a more rapid decline in optical depth as is decreased. Both probabilities exhibit significant dependence on the assumed core radius of the lensing population, indicating that the addition of a point mass to a softened isothermal lens model, if restricted to the relationship discussed in Section 2.1.3, would not hinder using lens statistics to learn about galaxy cores.
4. EMPIRICAL IMPLICATIONS OF THE MODELS
4.1. Relevant Facilities and Instruments
We have seen that if an intervening lens galaxy contains a SMBH, then an additional faint image is predicted due to the black hole potential which is not present in unmodified models. In fact, even in cases when the source position and the lens are too far apart to create multiple images in the standard way, the SMBH will still produce a faint image of the background object near the center of the foreground galaxy. In this section we discuss the applicability of optical, infrared, and radio facilities to observing these images.
4.1.1 Optical and Infrared
Optical observations of these highly demagnified images would be difficult. In order to obtain a significant cross-section for detecting image D, we saw in Section 3(and Figure 7) that demagnification from the primary image by , or 15 magnitudes, must be observable. In the Hamburg-ESO Survey (Wisotzki et al., 2000) and the Sloan Digital Sky Survey (SDSS), the brightest quasars at redshift greater than 0.5 have magnitudes of 15. The demagnification due to the lensing alone would reduce this to 30th magnitude, and this would be compounded with the extinction that the image would suffer passing through the inner regions of the lensing galaxy. Such faint observations are far beyond the capabilities of current optical telescopes. To observe the lensing of even the brightest quasars would require 30-meter class or larger optical telescopes.
Infrared observations would not suffer the severe extinction of the image passing through the foreground galaxy, however, it would still be problematic to separate the lens image from foreground galaxy emission. The use of spectral lines to distinguish two redshift components may be able mitigate this problem.
4.1.2 Radio
Observations with radio telescopes, while still difficult, are more feasible. The brightest sources above a redshift of in the NRAO-VLA Sky Survey (Condon et al., 1998) and the FIRST sky survey (Becker et al., 1995) have flux densities greater than 20 Jy. The flux density of image D from such a source would be on the order of 20 Jy, and at radio wavelengths any absorption through the lensing galaxy should be negligible. Long integrations with the VLA and VLBI arrays can already achieve sensitivities of 10 Jy per beam (Garrett et al., 2003) or better, sufficient to observe faint images from the very brightest radio sources. Future improvements in radio telescope instrumentation, however, will dramatically increase the predicted number of observable D images. Four projects in particular are relevant to making sensitive observations of lenses and are summarized below.
VLA Expansion Project
The VLA Expansion Project is already underway to supply the VLA with modern electronics and also plans to add up to eight additional antennas to the array at distances out to 350 km from the core facility. The resulting Expanded VLA (ELVA), scheduled for completion by 2012, is intended to improve performance in important areas by a factor of 10. This is expected to extend the detection threshold of faint sources to 1 Jy or less. With this sensitivity, the EVLA should also be able to detect the C images for existing radio lenses.
Square Kilometer Array
The Square Kilometer Array (SKA) is a proposed next generation radio telescope that offers the most promise for observing lenses with faint images. The current design goals for the SKA are to achieve a dynamic range approaching and a detection threshold that could reach to the 10 nJy level.
Low Frequency Array
A low frequency radio telescope array has been proposed that would operate at low frequencies between 30 and 240 MHz. The design is intended to achieve a baseline dynamic range of , extending to in some cases, and a detection threshold of less than 1 Jy. However, due to the low frequencies used, the expected best-case angular resolution of about 1 arcsec (at 240 MHz) of the instrument would prevent some lens configurations from being resolved.
Atacama Large Millimeter Array
The Atacama Large Millimeter Array (ALMA) is a millimeter wavelength telescope under design by Europe and North America. It will be located in Llano de Chagnantor, Chile, and consist of at least 64, 12-meter antennas. The intended resolution is mas with a sensitivity approximately 20 times greater than the VLA. (Tofani, 2003)
4.2. Lensing Expectations
Despite the limitations of current technology, it is not too early to consider candidate SMBH lensing targets. The first step is to estimate the predicted total number of lenses that should be observable. We can use the optical depth calculations from the previous section along with the known flux distribution of radio sources to accomplish this. To estimate the number of lenses an instrument with a limiting sensitivity, , should be able to detect, we integrate the product of the differential source flux distribution, , and the optical depth, . The appropriate dynamic range, , is given by the ratio between the sensitivity of the instrument and the flux of the source ():
| (23) |
We are neglecting the dependence on source redshift of both and . Again, we will assume that treating all sources as if they were at the mean redshift, , is sufficient. We still cannot perform this integral fully because we have only evaluated for specific values of . However, we can achieve an approximate evaluation by converting the integral to a sum over flux bins centered on equivalent values:
| (24) |
The differential number of radio sources as a function of flux in the range Jy is (Windhorst et al., 1993):
| (25) |
We will use this relation for all flux densities, although it is likely to overestimate the the number of faint sources ( nJy) and underestimate the number of bright sources ( mJy) as discussed by Windhorst et al. (1993). Finally, in order to perform the sum, we must choose a core radius and an image of interest. Two diagnostic core radii regimes are evident from Section 3. We begin by considering: 1) the limit of vanishing cores, and 2) the core radius that produces the maximum likelihood of observing three- and four-image lenses. The first regime is approached by setting and performing the sums described above. Using the PM+CIS model we calculate, for each image, the number of observable lenses per steradian.
| S (Jy) | Example | ||||
|---|---|---|---|---|---|
| 1000 | FIRST Survey | 4 | 0 | 0 | 0 |
| 100 | Typical VLA | 74 | 0 | 0 | 0 |
| 10 | 1,500 | 0 | 0 | 2 | |
| 1 | EVLA | 30,000 | 0 | 0 | 34 |
| 0.1 | 590,000 | 0 | 0 | 670 | |
| 0.01 | SKA | 12,000,000 | 0 | 0 | 13,000 |
Note. — This table indicates the predicted number of gravitational lenses per steradian for a search with sensitivity, , using the optical depth calculations for the PM+CIS potential from the previous section and the empirical flux distribution of known radio sources. The choice of core radius is to approximate the limiting case of no galaxy cores. is the number of two-image lenses predicted, is the number of lenses in the subset where a third, core image is detectable, and is the number of lenses in the subset with a fourth, SMBH image. The last column, labelled , is the number of two-image lenses where the fainter image is due directly to the SMBH.
Table 3 illustrates that no lenses with more than two images are expected. This is readily explained by noting in Figure 9 that the optical depths for three- and four-image lenses at are negligible for all flux ratios. The last column in the table, labelled “”, indicates the number of two-image lenses where the secondary image would not be present without the SMBH and, therefore, may still be able to provide useful information about the SMBH.
The second core radius regime is that of maximum likelihood to produce three- and four-image lenses. For the PM+CIS model, this occurs near . The calculated values for this core radius are listed in Table 4.
| S (Jy) | Example | ||||
|---|---|---|---|---|---|
| 1000 | FIRST Survey | 4 | 0 | 0 | 0 |
| 100 | Typical VLA | 73 | 1 | 0 | 0 |
| 10 | 1,400 | 18 | 0 | 0 | |
| 1 | EVLA | 29,000 | 360 | 1 | 1 |
| 0.1 | 580,000 | 7,100 | 13 | 16 | |
| 0.01 | SKA | 12,000,000 | 140,000 | 260 | 330 |
Note. — This table indicates the predicted number of gravitational lenses per steradian for a search with sensitivity, . The choice of core radius is , which is the value of that produces the largest optical depths for core and SMBH images.
These values indicate that if typical core radii for galaxies are in this range, we would expect to find, with an SKA-like instrument, no more than about 260 lenses per steradian with a fourth, SMBH image out of about 12 million. On the other hand, 140,000 lenses per steradian with a third image bright enough to detect would be expected.
4.2.1 Limiting Candidate Targets
Despite the tremendous number of lenses capable of providing information about an SMBH that an extremely sensitive search is predicted to detect, it would be operationally infeasible due to the required long integrations times to conduct such a campaign without first reducing the number of candidate targets.
If only sources in a radio catalog are under consideration as possible targets, the sensitivity limit of the catalog will restrict the number of two-image lenses and increase the overall ratio of three- and four-image lenses to the total number of lenses.
There are over 800,000 sources in the FIRST radio catalog (White et al., 1997) which has a detection limit of 1 mJy and covers nearly square degrees of the sky, mostly in the northern hemisphere. For this analysis, we will assume as we did earlier, that all the sources in the catalog are at redshift, , and follow the same procedure as above. We divide the catalog into eight flux bins, shown in Table 5,
| Bin | Flux (mJy) | |
|---|---|---|
| 8 | 27 | |
| 7 | 227 | |
| 6 | 1,444 | |
| 5 | 7,418 | |
| 4 | 26,914 | |
| 3 | 75,756 | |
| 2 | 181,766 | |
| 1 | 1 | 517,565 |
Note. — The number of sources in the FIRST radio catalog are divided into 8 bins by flux. The flux values listed in the table represent the floor of each bin. The number of sources in each bin is used in combination with optical depth calculations for the PM+CIS lensing potential to calculate the predicted number of lenses contained in the catalog (Tables 6 and 7).
and perform the sum for the two diagnostic core radii regimes.
The first regime, with and using the PM+CIS model, predicts the number of observable lenses for the area of the sky covered by the FIRST survey given in Table 6.
| S (Jy) | Example | ||||
|---|---|---|---|---|---|
| 1000 | FIRST Survey | 100 | 0 | 0 | 0 |
| 100 | Typical VLA | 470 | 0 | 0 | 4 |
| 10 | – | 650 | 0 | 0 | 40 |
| 1 | EVLA | 790 | 0 | 0 | 180 |
| 0.1 | – | 1100 | 0 | 0 | 460 |
| 0.01 | SKA | 1700 | 0 | 0 | 1100 |
Note. — This table indicates the predicted number of gravitational lenses for a search with sensitivity, , in the FIRST catalog of radio sources. The choice of core radius is .
Immediately it is clear that, compared to Table 3, the number of total lenses detectable by sensitive instruments has been drastically reduced. This is because the FIRST survey contains no sources with flux below mJy and, therefore, the extra sensitivity has no accessible faint sources on which to operate.
The second core radius regime of interest is where . The calculated values for this core radius are in Table 7.
| S (Jy) | Example | ||||
|---|---|---|---|---|---|
| 1000 | FIRST Survey | 90 | 2 | 0 | 0 |
| 100 | Typical VLA | 410 | 20 | 0 | 0 |
| 10 | – | 410 | 130 | 1 | 0 |
| 1 | EVLA | 410 | 320 | 12 | 1 |
| 0.1 | – | 430 | 320 | 70 | 7 |
| 0.01 | SKA | 580 | 320 | 230 | 86 |
Note. — This table indicates the predicted number of gravitational lenses for a search with sensitivity, , in the FIRST catalog of radio sources. The choice of core radius is .
Although significantly fewer lenses are likely to be contained in the catalog, the relative number with an observable core image is much higher (between 50% and 80% for EVLA or better levels). In addition, most of the two-image lenses should already be detectable with the VLA. It is plausible, under these circumstances, that an appropriate search guided by the FIRST catalog would be able to detect and characterize, today, a population of two-image lenses that will yield a significant number of third and fourth images when re-observed with future technology.
The above calculations were performed for two specific core radii of particular interest, but they can be repeated for all the core radii we considered in Section 3. This has been done and is plotted in Figure 10 for S=1 Jy. The ratios of and are plotted as well. For sensitivities better than 10 Jy, the increases rapidly with core radius in the region and approaches unity for and S=10 Jy. Similarly, increases in the same region, although it reaches a maximum of only approximately .
Searching for 500 lenses out of a catalog of over 800,000 sources is still a daunting task. We suggest that another object catalog may help reduce the list of candidates even more. The Sloan Digital Sky Survey (SDSS) covers 3324 square degrees as of Data Release 2, overlapping the FIRST survey, and will eventually cover nearly 10,000 square degrees. It has identified over 88 million objects at optical wavelengths, many of which are extragalactic sources with estimated redshifts between (Stoughton et al., 2002). This population of extragalactic objects makes an ideal foreground of potential lens galaxies for background radio sources in the FIRST catalog. Ivezić et al. (2002) have shown that the error in position between the two surveys is arcsec per coordinate, and the SDSS has included in its database a special flag to indicate objects that are spatially collocated with FIRST radio sources.. If pairs of neighboring objects within approximately of each other could be found in the SDSS database where one is marked with the FIRST flag, then this would represent a sample of targets with an elevated likelihood of containing radio lenses. If it could be further reduced to pairs where the radio source is known to be behind the neighboring object, the likelihood would be higher, yet. Fortuitously, the SDSS aims to acquire 1 million spectra of galaxies, preferentially targeting identified optical counterparts of FIRST radio sources. Thus, redshift information may be available for one or both of the objects in a pair directly from the database.
A complimentary approach to finding new lens candidates has been described by Bolton et al. (2004). They have been able to identify multiple emission lines at two redshifts in a number of SDSS spectra, indicating a foreground and background galaxy within the 3 arcsec field of view, and are using these objects in an optical lens search.
4.2.2 Galaxy Cores
It is clear from the preceding estimates that the size of galaxy cores greatly affects the likelihood of observing core and SMBH images. It is beneficial, therefore, to consider what is known about galaxy cores to date. The structure of the central regions of galaxies has been studied extensively through surface brightness measurements and a number of attempts have already been made to deduce the properties of galaxy cores from gravitational lensing studies.
Fits to the “Nuker Law” surface brightness models, which we used earlier as the basis of our second lens model, have given the result that galaxies appear to be of two types, those that are “cored” and those that are not. The cored galaxies are those that are luminous, slowly rotating ellipticals with boxy isophotes; the non-cored, power law galaxies are faint, rapidly rotating galaxies with disky isophotes. There is a fairly tight correlation between break radius and luminosity. Large elliptical galaxies dominate the lensing cross-section, implying that the galaxies that are important for SMBH lensing are also those that have cores. In fact, it has been hypothesized that in the hierarchical merger process involved in galaxy formation, SMBH binary systems will form and spiral toward the center of the new system, cooling and possibly ejecting starts near the center. The SMBHs may, therefore, even be responsible for the existence of the cores.
The presence of a core image (image C) in gravitational lenses, however, is exceedingly rare, with candidate images observed only in PMN J1632-0033 (Winn et al., 2004), MG 1131+0456 (Chen & Hewitt, 1993), and APM 08279+5255 (Ibata et al., 1999). For the latter two systems, it remains uncertain whether third component is an image or emission from the lens galaxy. If we do take the third components in MG 1131+0456 and APM 08279+5255 as lens images, best fit values of (Chen et al., 1995) and (Egami et al., 2000), respectively, are calculated.
The only system with convincing evidence of a core image detection is PMN J1632-0033 (Winn et al., 2004). Radio spectra of all three image components have been acquired and the flux ratios and are nearly constant across the high frequency measurements indicating the components are likely from the same source. The only discrepancy is with the lowest frequency measurement at 1.7 GHz, but as Winn et al. (2004) argue, this is where absorption from passing through the dense part of the lens galaxy would be strongest. They have, furthermore, been able to place constraints on several quantities of interest (Winn et al., 2003). Using a broken power law model, the relation between break radius and inner power law slope is constrained; and using a cored isothermal mass-density model, a core radius of mas or pc, is derived. Compared to the estimated Einstein radius of the lens galaxy of arcsec (Winn et al., 2002), the core radius corresponds to , although this is not directly comparable to our core radius due to the differing model.
Keeton (2003) discusses in detail the implications of the behavior of the mass-density profile at the core to the detectability of a third image, and concludes that the paucity of third images in lens systems is consistent with observed surface density profiles. Rusin & Ma (2001) have studied six double lens systems in which the third image is not detected. Using the known detection limits for each of these sources, they employ a singular mass profile with variable slope to determine how steep the inner density profile must be to explain the lack of this image. They find that for these six sources the inner region must be quite steep. However, it is not clear that the constraints on the inner slope are relevant in constraining the possible flattening of the mass distribution that might occur right at the SMBH.
The above attempts have tended to be specific case studies of individual lenses and therefore it is difficult to get a sense for the overall probability of any particular core radius. The results of our modelling are in a position then, to provide the backdrop for interpreting these results. For example the results of a systematic lens survey with 1 mJy sensitivity could be compared to the ratio of in Figure 10 to learn about typical core radii values.
4.3. Structure in Image D
To this point we have considered only the overall magnification and position of image D. If these images are detected, however, any observed structure in them will be capable of providing additional important information about the lens system. The properties of observed structure in a lens image should be distinct from the properties of any radio emission from the foreground galaxy, and thus, resolved structure in faint emission at the center of a lens could be used to reduce confusion as to whether an image or foreground emission had observed. Additionally, structure in image D is capable of indicating the presence of binary SMBHs in the lensing galaxy. Both of these are discussed in detail below, but first we will examine the ability to resolve structure in these images.
4.3.1 Detecting Structure in Image D
The flux density of image D, as we have seen, is demagnified typically by a factor of at least from that of the original source. Since surface brightness is conserved by lensing, this corresponds to a reduction in the surface area of the image compared to the original source. Therefore, we expect each of the two spatial dimensions on the sky to be reduced by a factor of order .
VLBI measurements achieve angular resolutions approaching mas. Thus a radio source with arcsec scale structure would produce an image D with mas scale structure, which should easily be distinguished by the VLBI.
4.3.2 Foreground Galaxy Emission
Observing a faint signal near the center of a lens galaxy does not provide sufficient evidence to prove that image D has been detected. It is possible that the signal may be explained by a lens model without a SMBH or that the emission may be from the lens galaxy itself.
In the former case, an analysis for plausible lens models of the probability of producing a faint image close to the center of the lens galaxy should typically be sufficient to remove confusion. For example, a standard singular isothermal sphere model produces a faint secondary image in rare cases where the source impact parameter is just inside the Einstein radius. This image, in principle, could be confused with the image D tail of the models we have discussed above. However, the probability of such a configuration in the SIS model is extremely low compared to that for the PM+CIS and PM+POW models.
In the latter case, structure in the signal could be used to rule out the possibility that the detected signal is emission from the foreground galaxy. Gravitational lenses produce a characteristic arcing in images that are resolved. In addition, structure in secondary images should be correlated with structure in the primary image.
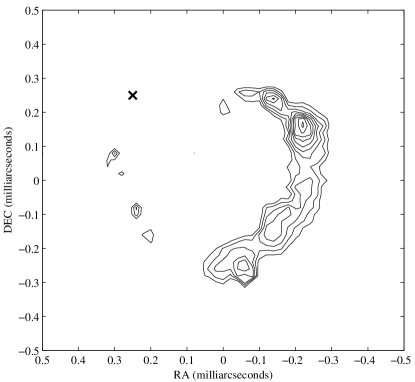
As an illustrative example of the lensing that we expect to occur due to a SMBH within a galaxy, we consider a radio-jet QSO that is known to have nearby foreground galaxies. The radio and optical observations of 3C9 are discussed in detail by Kronberg et al. (1991). This source lies at a redshift of , has total flux of approximately 190 mJy, and its radio jets are approximately 10 arcsec across. A radio map of the source is shown in Figure 11, which was constructed from data provided by P. Kronberg. The especially interesting feature of 3C9 is that there are two foreground galaxies near the jets. One (galaxy 1) lies approximately 10 arcsec from the jets, has an R-band magnitude of 19.5, and has a measured redshift of . The other (galaxy 2) lies only about 3 arcsec from the jets, has a R-band magnitude of 23.0, and has a less well determined redshift. We will assume that the two galaxies lie at the same redshift (). Using a simple ray tracing algorithm, we simulated the lensing that would occur from a SMBH in the center of each galaxy. Since the foreground galaxies are far from the radio source, and in such cases the properties of image D are determined almost entirely by the SMBH without influence from the host galaxy potential, we are able to work in the simplifying approximation of treating the SMBH as an isolated point mass. Figure 12 shows the image that would result from a SMBH in the center of galaxy 1. The total flux from this image is approximately 0.03 nJy. A SMBH with the same mass in galaxy 2 would produce a much brighter image with total flux about 3 nJy. Figure 13 shows this case.
These faint images of 3C9 would not be detectable, even with the anticipated sensitivity of the SKA, and are presented merely as examples of how structure could be identified. 3C9, therefore, is not a realistic candidate for future SMBH lensing studies.
4.3.3 Mergers and Binary SMBHs
An interesting question arising from the hierarchical formation of SMBHs is how long the black holes of two merging galaxies take to coalesce. Indeed, if the time scale is long enough we would expect some galaxies to contain binary SMBHs. Yu (2002) has carried out theoretical studies that determine how these merger time scales vary according to the type of host galaxy, its velocity dispersion, and the mass ratios of the SMBHs involved. The “surviving” binary systems (those whose merger time is larger than the Hubble time) are found to occur predominantly in galaxies that are not highly flattened and that have dispersion velocities greater than 90 km/s. In addition, SMBH pairs with equal masses are more likely to survive.
The separations of most of the remaining binary systems range from 0.01 to 10 pc. From Equation 4, we calculate that for SMBHs with masses between and , typical values of correspond to physical distances between 10 and 400 pc. The binary separations, therefore, may be significant fractions of the SMBH Einstein radii and binaries may be distinguishable in some lenses. Binary SMBHs with the widest anticipated separations may be sufficient to alter not only properties of image D, but also image C (and therefore the lensing statistics of these images), because for small source impact parameters image C is predicted to form typically within about 10 pc of the center of the lens (see Figures 1 and 3). For large source impact parameters, however, image C does not exist and only image D will be affected.
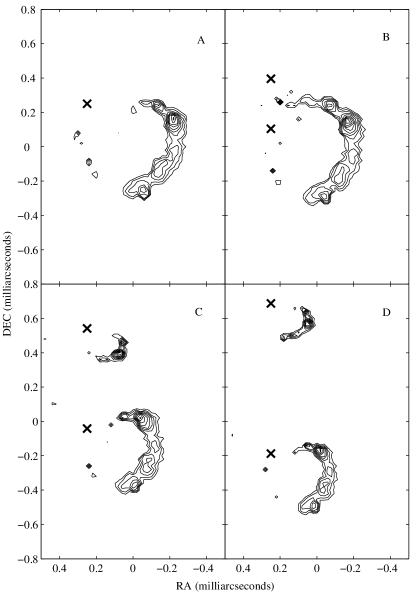
Figure 14 demonstrates the results of considering two SMBHs in galaxy 2 of the 3C9 example considered above. We calculate for these SMBHs that the Einstein radii correspond to 250 pc (using , , and km/s). It is evident that, even for separations of a few parsecs, noticeable effects are visible in this scenario. A survey of a large number of these faint lenses would provide insight not only into the distribution of the masses of SMBHs, but also whether the SMBHs occur as individual or binary systems and their correlation to the morphological type of the host galaxy.
It is also evident from theoretical simulations that, either through mergers or initial conditions, individual SMBHs may not be located precisely at the center of their host galaxies. If a SMBH has formed at a distance greater than approximately 100 pc (or more, depending on its mass) from the center of its host galaxy, Ullio et al. (2001, Figure 3) have predicted that dynamical friction is insufficient to produce spiral-in timescales shorter than the Hubble time. Additionally, Brownian motion may cause a SMBH or binary pair to wander around the nucleus of a galaxy within a radius of order 0.01 pc (Merritt, 2001). Observational evidence, on the other hand, suggests that in nearby galaxies SMBHs are within 0.1 pc of galaxy centers (Milosavljević & Merritt, 2001, Section 1). As was the case for binary systems, non-centrally located SMBHs may affect the magnifications curves for small source impact parameters, and thus the lensing statistics for images C and D. However, they are not likely to significantly alter the properties of systems with large source impact parameters since, in this limit, the properties of image D approach those of an image from an isolated SMBH (see Appendix A.3 for a justification). Therefore, an off-center SMBH should not complicate detection or identification of a SMBH image in a two-image system with large source impact parameter.
5. CONCLUSION
Observational measurements of the relationship between SMBHs and the properties of their host galaxies are an important method for probing theoretical hierarchical growth models. Gravitational lensing is a unique mechanism for acquiring the this information in systems at cosmologically significant redshifts.
We have reviewed the calculations required to transform historically popular galactic lens models in order to account for the presence of SMBHs. The modified models, PM+CIS and PM+POW, exhibit an inner disk in the source plane where only two bright images are produced, surrounded by an anulus where two additional faint images are added near the center of the lens for a total of four images. For all source positions outside this region, the models predict the presence of one primary image and one highly demagnified image deep in the center of the lens which traces very nearly the secondary image of an isolated SMBH. The relative cross-sections of these three regions are very sensitive to galaxy core sizes and SMBH masses. We used these characteristic signatures to demonstrate the origin of the SMBH lensing effects reported previously in Rusin & Ma (2001), Keeton (2003), and Mao et al. (2001).
Determination of lensing cross-sections over a range of parameter space and subsequent optical depth calculations revealed that, even for the most favorable lens configurations, observations of the highly demagnified fourth images will remain elusive until the next generation of radio telescopes are in use. Two scenarios, however, offer more immediate results. Since core images are detectable now, if galaxies tend to have large cores, deep VLBI observations (or EVLA) should make accessible a sufficiently large population of core images to provide meaningful statistics. On the other hand, if galaxies tend to have very small cores, then two-image lenses where the secondary image is the highly demagnified SMBH image already may be observable. For any scenario, there is strong evidence suggesting that a targeted search today for new lenses, utilizing sky surveys such as FIRST to limit the number of candidate objects, should yield a precursory sample of two-image lenses that will, with improved technology, provide a significant number of third and fourth images. And finally, if these images are detected they may even reveal binary SMBH systems.
We would like to thank Philipp Kronberg for providing the radio map of 3C9. Support for this work was provided by the NSF through grant AST-0071181.
A. MORE ON NON-CIRCULARLY SYMMETRIC POTENTIALS
Many observed gravitational lenses do not produce simply two bright images as a circularly symmetric potential would predict. Instead, four or more bright images are often observed. Two effective and common explanations are: 1) that the lensing galaxies are indeed not circularly symmetric but rather elliptical, and 2) that the lensing galaxies lie in an external gravitational shear. In this section we provide a cursory analysis of how ellipticity and shear will modify the results of the previous sections. In addition, we treat the case of an off-center SMBH in the large source impact parameter limit.
We have seen in the case of circularly symmetric potentials that, for large impact parameters (), the magnification of image D is essentially independent of the lensing properties of the galaxy that contains the image. We will show that neither ellipticity nor shear, will significantly alter the magnification of this image or the primary image, and therefore, the optical depths and statistics pertaining to observing these images calculated for the circularly symmetric potentials do not need to be altered. The properties of any other faint images, however, will be complicated by the addition of the more complex potentials and our previous calculations may not necessarily hold. Similarly, an off-center SMBH is shown not to alter the magnification of image D in the large source impact parameter limit, but other configurations and other images may be affected.
A.1. Ellipticity
It has been demonstrated (Evans & Hunter, 2002) that an elliptical lensing potential derived from a cored isothermal sphere increases the maximum number of images produced from three to five. For our PM+CIS potential, considering ellipticity does not actually increase the maximum number of images, but rather complicates the caustics in the source plane considerably (Mao et al., 2001). We expect that the magnification of the SMBH image, where it exists, and of the primary image will be affected little by this change, but to demonstrate this quantitatively we must return to the lens equation. Recalling from Equation 1, but this time in two dimensions, the lens equation is:
| (A-1) |
In order to describe a galaxy with an elliptical density distribution, we will modify the circularly symmetric cored isothermal sphere lensing potential to (Narayan & Bartelmann, 1996, Section 3.5.1):
| (A-2) |
In this equation the variables and are the angular distances along the principal axes of the ellipse, and is the ellipticity of the potential. The cored elliptical lensing potential is not entirely realistic since, for large ellipticity, it results in dumb-bell shaped mass-density contours. For small ellipticity, however, the contours are generally elliptical and the potential is quite acceptable. Combining this with the point mass potential yields the complete lensing potential for an elliptical galaxy with a SMBH:
| (A-3) |
Using the lens equation, we find for the components of :
| (A-4) | |||
| (A-5) |
Since we are interested only in magnification of images for the present purposes, we can forgo completely solving the lens equation. For non-circularly symmetric potentials, the magnification of any image is given by (Scheider et al., 1992, Equation 5.21):
| (A-6) |
where is the Jacobian matrix which describes the lens properties, and is:
| (A-7) |
Unfortunately, writing out and calculating its determinant is not particularly illuminating as it is difficult to see past the algebra. As a simplification, we consider the limiting cases of and the opposite extreme . The former happens to correspond to the region of the image plane where SMBH images are expected to be observed because, from our earlier analysis, we might reasonably assume , , and for SMBH images, . The latter corresponds to the region where the primary image is observed since for such images and the other parameters, of course, do not change.
For the case of the inner region of the image plane, where the SMBH image is expected to form, the components of reduce to:
| (A-8) | |||
| (A-9) |
and thus the magnification for an image in this region is given by:
| (A-10) |
The magnification of these images would not, therefore, be affected by the ellipticity of the lens galaxy. It should be noted, however, that this approximation breaks down in this region if is sufficiently small ().
For the case of the outer region of the image plane, where a primary image forms, the components of reduce to another pair of relatively simple expressions:
| (A-11) | |||
| (A-12) |
Along the axes, and , the magnification in this region is given by:
| (A-13) |
We can consider that, in effect, the addition of ellipticity simply modifies the value of depending on the position of the primary image. Since the value of is at the very greatest 1, and is usually much smaller, we can ignore this contribution as a minor correction.
A.2. Gravitational Shear
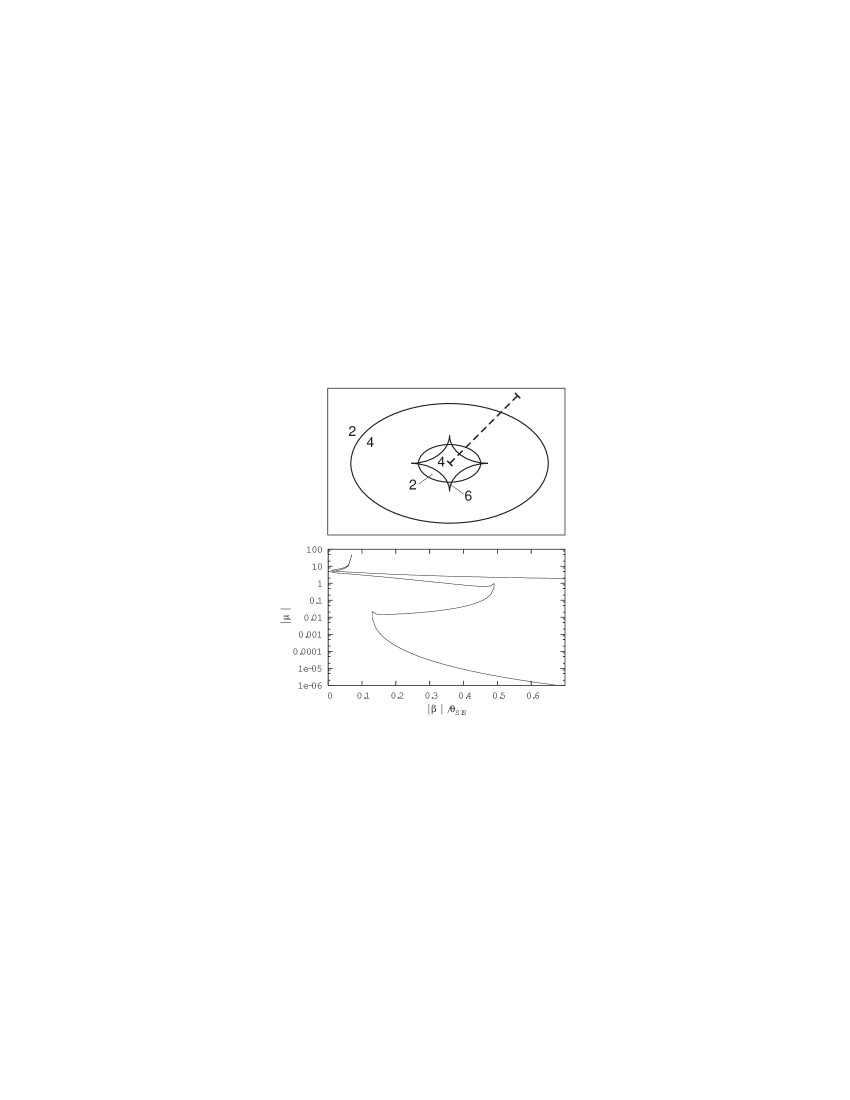
The lensing galaxy might be residing, on the other hand, in the presence of an external gravitational shear. It has been demonstrated (Evans & Hunter, 2002) that the addition of an external shear to a cored isothermal sphere potential increases the maximum number of images produced from three to five, just as did the consideration of ellipticity. For our PM+CIS potential, the maximum number of images increases again to six, however four images is a more probable outcome for most configurations, as shown in Figure 15. Again we expect that the SMBH image and the primary image will be affected little by this change. Returning to the two-dimensional lens equation, we begin by characterizing an external shear with (Narayan & Bartelmann, 1996, Section 3.5.2):
| (A-14) |
Here is the magnitude of the shear and, as in the case of the ellipticity, the angular distances and measure along the axes of the shear. In order to consider how this affects the images, we begin by adding this contribution to the potential for a PM+CIS giving:
| (A-15) |
From the lens equation we again can calculate the components of :
| (A-16) | |||
| (A-17) |
and for convenience we will define an angle which measures the position of the image with respect to the positive axis such that:
| (A-18) | |||
| (A-19) |
Calculating the determinant of the Jacobian matrix and grouping the terms by powers of yields, after some simplification,
| (A-20) | |||||
Following the same approximations here as we did for the elliptical case, we consider the two regions of the image plane where and . For the inner region of the image plane where an SMBH image is expected to be observed, and , we substitute, as we did before, the values of , , and . In this limit, the above expression reduces to:
| (A-21) |
Typical values of the shear parameter are generally of order (Casertano et al., 2003). Thus, it is sufficient to keep only the leading term of the expression for the magnification:
| (A-22) |
This is identical to the elliptical result for this region and we conclude that shear will not substantially alter the magnification of an SMBH image for such a lens configuration.
For the case of the outer region of the image plane, where a primary image forms, and , we proceed by repeating the above simplification, but with typical values of . The determinate of is then reduced to:
| (A-23) |
and using ,
| (A-24) |
The angular dependence in this equation makes sense, because symmetry dictates that two points separated by 180 degrees must have the same magnification. As was the case for the elliptical potential, this can be considered to be a small correction to and, therefore, the presence of an external shear has not altered the ratio of the magnification of a SMBH image to a primary image in these limiting cases. Figure 15 plots the image magnifications for a representative system with as function of source position for a path extending away from the center of the lens. Comparison with the top-left plot in Figure 5, which has no shear but is otherwise the same configuration, demonstrates the minimal effect of shear on image magnifications for both core images in this case.
A.3. Off-Center SMBH
Another possible departure from circular symmetry, raised in Section 4.3.3, is that the SMBH may not be located in the center of the host galaxy. Returning to the lensing potential given in Equation 6, we can explore the consequences of such an occurrence by inserting an offset, , between the point mass and the galaxy potential,
| (A-25) |
This yields the lens equation,
| (A-26) |
Following a similar approximation here as we did for the elliptical and shear cases, we consider the region of the image plane which corresponds to large source impact parameters. In this limit, we expect that an image will form near the point mass, and thus will be small. The last term in the lens equation, therefore, will dominate and we can simplify the lens equation to,
| (A-27) |
and rearrange to solve for the image position,
| (A-28) |
The position of the SMBH image as a function of source impact parameter is merely offset from the original location by the same amount as the SMBH itself. The magnification of the image,
| (A-29) |
will also have the familiar form, but with respect to the new SMBH location.
A.4. Remarks
Neither ellipticity nor external shear (nor, under proper circumstances, an off-center SMBH) significantly change the probability of observing lensing by a SMBH. The cross-sections, optical depths, and statistics we calculated for the circularly symmetric models, therefore, remain a reasonably good representation even under these more general circumstances. Other core images, however, do not necessarily lie in the limiting case regions of the image plane and may be affected by ellipticity and shear. We cannot assume that the results of the circularly symmetric calculations can be applied to deduce their statistics for these configurations, but postpone further analysis for future work.
References
- Alexander & Loeb (2001) Alexander, T., & Loeb, A. 2001, ApJ, 551, 223
- Augusto & Wilkinson (2001) Augusto, P., & Wilkinson, P. N. 2001, MNRAS, 320, L40
- Baes et al. (2003) Baes, M., Buyle, P., Hau, G. K. T., & Dejonghe, H. 2003, MNRAS, 341, L44
- Becker et al. (1995) Becker, R. H., White, R. L., & Helfand, D. J. 1995, ApJ, 450, 559
- Bolton et al. (2004) Bolton, A. S., Burles, S., Schlegel, D. J., Eisenstein, D. J., & Brinkmann, J. 2004, AJ, 127, 1860
- Browne et al. (2003) Browne, I. W. A., et al. 2003, MNRAS, 341, 13
- Burkert & Silk (2001) Burkert, A., & Silk, J. 2001, ApJ, 554, L151
- Byun et al. (1996) Byun, Y.-I., et al. 1996, AJ, 111, 1889
- Casertano et al. (2003) Casertano, S., Ratnatunga, K. U., & Griffiths, R. E. 2003, ApJ, 598, L71
- Chen (2003) Chen, D. 2003, ApJ, 587, L55
- Chen & Hewitt (1993) Chen, G. H., & Hewitt, J. N. 1993, AJ, 106, 1719
- Chen et al. (1995) Chen, G. H., Kochanek, C. S., & Hewitt, J. N. 1995, ApJ, 447, 62
- Condon et al. (1998) Condon, J. J., Cotton, W. D., Greisen, E. W., Yin, Q. F., Perley, R. A., Taylor, G. B., & Broderick, J. J. 1998, AJ, 115, 1693
- Di Matteo et al. (2003) Di Matteo, T., Croft, R. A. C., Springel, V., & Hernquist, L. 2003, ApJ, 593, 56
- Egami et al. (2000) Egami, E., Neugebauer, G., Soifer, B. T., Matthews, K., Ressler, M., Becklin, E. E., Murphy, T. W., & Dale, D. A. 2000, ApJ, 535, 561
- Evans & Hunter (2002) Evans, N. W., & Hunter, C. 2002, ApJ, 575, 68
- Faber et al. (1997) Faber, S. M., et al. 1997, AJ, 114, 1771
- Ferrarese (2002) Ferrarese, L. 2002, ApJ, 578, 90
- Garrett et al. (2003) Garrett, M. A., Wrobel, J. M., & Morganti, R. 2003, New Astronomy Review, 47, 385
- Gebhardt et al. (2000) Gebhardt, K., et al. 2000, ApJ, 539, L13
- Graham et al. (2001) Graham, A. W., Erwin, P., Caon, N., & Trujillo, I. 2001, ApJ, 563, L11
- Hogg (1999) Hogg, D. 1999, preprint (astro-ph/9905116)
- Ibata et al. (1999) Ibata, R. A., Lewis, G. F., Irwin, M. J., Lehár, J., & Totten, E. J. 1999, AJ, 118, 1922
- Ivezić et al. (2002) Ivezić, Ž., et al. 2002, AJ, 124, 2364
- Kauffmann & Haehnelt (2000) Kauffmann, G., & Haehnelt, M. 2000, MNRAS, 311, 576
- Keeton (2003) Keeton, C. R. 2003, ApJ, 582, 17
- Keeton & Madau (2001) Keeton, C. R., & Madau, P. 2001, ApJ, 549, L25
- Kormendy et al. (2000) Kormendy, J., Gebhardt, K., & Richstone, D. 2000, Bulletin of the American Astronomical Society, 32, 702
- Kronberg et al. (1991) Kronberg, P. P., Dyer, C. C., Burbidge, E. M., & Junkkarinen, V. T. 1991, ApJ, 367, L1
- Laor (2001) Laor, A. 2001, ApJ, 553, 677
- Lauer et al. (1995) Lauer, T. R., et al. 1995, AJ, 110, 2622
- MacMillan & Henriksen (2002) MacMillan, J. D., & Henriksen, R. N. 2002, ApJ, 569, 83
- Magorrian et al. (1998) Magorrian, J., et al. 1998, AJ, 115, 2285
- Mao et al. (2001) Mao, S., Witt, H. J., & Koopmans, L. V. E. 2001, MNRAS, 323, 301
- McLure & Dunlop (2001) McLure, R. J., & Dunlop, J. S. 2001, MNRAS, 327, 199
- Merritt (2001) Merritt, D. 2001, ApJ, 556, 245
- Merritt & Ferrarese (2001) Merritt, D., & Ferrarese, L. 2001, in ASP Conf. Ser. 249: The Central Kiloparsec of Starbursts and AGN: The La Palma Connection, 335
- Milosavljević & Merritt (2001) Milosavljević, M., & Merritt, D. 2001, ApJ, 563, 34
- Muñoz et al. (2003) Muñoz, J. A., Falco, E. E., Kochanek, C. S., Lehár, J., & Mediavilla, E. 2003, ApJ, 594, 684
- Narayan & Bartelmann (1996) Narayan, R., & Bartelmann, M. 1996, preprint (astro-ph/9606001)
- Navarro et al. (1997) Navarro, J. F., Frenk, C. S., & White, S. D. M. 1997, ApJ, 490, 493
- Ofek et al. (2003) Ofek, E. O., Rix, H., & Maoz, D. 2003, MNRAS, 343, 639
- Press & Schechter (1974) Press, W. H., & Schechter, P. 1974, ApJ, 187, 425
- Rusin & Ma (2001) Rusin, D., & Ma, C. 2001, ApJ, 549, L33
- Schechter (1976) Schechter, P. 1976, ApJ, 203, 297
- Scheider et al. (1992) Scheider, P., Ehlers, J., & Falco, E. E. 1992, Gravitational Lenses (Springer-Verlag)
- Silk & Rees (1998) Silk, J., & Rees, M. J. 1998, A&A, 331, L1
- Stoughton et al. (2002) Stoughton, C., et al. 2002, AJ, 123, 485
- Tofani (2003) Tofani, G. 2003, Societa Astronomica Italiana Memorie Supplement, 3, 292
- Tremaine et al. (2002) Tremaine, S., et al. 2002, ApJ, 574, 740
- Turner et al. (1984) Turner, E. L., Ostriker, J. P., & Gott, J. R. 1984, ApJ, 284, 1
- Ullio et al. (2001) Ullio, P., Zhao, H., & Kamionkowski, M. 2001, Phys. Rev. D, 64, 043504
- Volonteri et al. (2003) Volonteri, M., Haardt, F., & Madau, P. 2003, ApJ, 582, 559
- Wambsganss & Paczynski (1992) Wambsganss, J., & Paczynski, B. 1992, ApJ, 397, L1
- White et al. (1997) White, R. L., Becker, R. H., Helfand, D. J., & Gregg, M. D. 1997, ApJ, 475, 479
- Wilkinson et al. (2001) Wilkinson, P. N., et al. 2001, Physical Review Letters, 86, 584
- Windhorst et al. (1993) Windhorst, R. A., Fomalont, E. B., Partridge, R. B., & Lowenthal, J. D. 1993, ApJ, 405, 498
- Winn et al. (2002) Winn, J. N., et al. 2002, AJ, 123, 10
- Winn et al. (2003) Winn, J. N., Rusin, D., & Kochanek, C. S. 2003, ApJ, 587, 80
- Winn et al. (2004) Winn, J. N., Rusin, D., & Kochanek, C. S. 2004, Nature, 427, 613
- Wisotzki et al. (2000) Wisotzki, L., Christlieb, N., Bade, N., Beckmann, V., Köhler, T., Vanelle, C., & Reimers, D. 2000, A&A, 358, 77
- Wyithe & Loeb (2002) Wyithe, J. S. B., & Loeb, A. 2002, ApJ, 581, 886
- Yu (2002) Yu, Q. 2002, MNRAS, 331, 935
- Zhao (1997) Zhao, H. 1997, MNRAS, 287, 525