Near Infrared Spectroscopy of High Redshift Active Galactic Nuclei.
II. Disappearing Narrow Line Regions and the Role of Accretion
Abstract
We present new near infrared spectroscopic measurements for 29 luminous high-redshift active galactic nuclei (AGNs) and use the data to discuss the size and other properties of the narrow line regions (NLRs) in those sources. The high resolution spectra have been used to carefully model the Fe II blends and to provide reliable [O iii] , Fe ii and H measurements. We find that about 2/3 of all very high luminosity sources show strong [O iii] lines while the remaining objects show no or very weak such line. While weak [O iii] emitters are also found among lower luminosity AGNs, we argue that the implications for very high luminosity objects are different. In particular, we suggest that the averaging of these two populations in other works gave rise to claims of a Baldwin relationship in [O iii] which is not confirmed by our data. We also argue that earlier proposed relations of the type , where is the radius of the NLR, are theoretically sound yet they must break down for exceeding a few kpc. This suggests that the NLR properties in high luminosity sources are very different from those observed in nearby AGNs. In particular, we suggest that some sources lost their very large, dynamically unbound NLR while others are in a phase of violent star-forming events that produce a large quantity of high density gas in the central kpc. This gas is ionized and excited by the central radiation source and its spectroscopic properties may be different from those observed in nearby, lower luminosity NLRs. We also discuss the dependence of EW(H) and Fe II/H on luminosity, black hole mass, and accretion rate for a large sample of AGNs. The strongest dependence of the two quantities is on the accretion rate and the Fe II/H correlation is probably due to the EW(H) dependence on accretion rate. We show the most extreme values measured so far of Fe II/H and address its correlation with EW([O iii] ).
Subject headings:
galaxies: active – galaxies: nuclei – galaxies: Seyfert – quasars: emission lines – galaxies: starburst1. Introduction
The narrow line regions (NLRs) of active galactic nuclei (AGNs) have been studied, extensively, from the ground and from space. This component of the nucleus is spatially resolved from the ground in nearby sources and HST observations extend the range to a redshift of about 0.5. Thus, detailed NLR mappings are now available for a large number of sources covering a large range of luminosity and redshift (Falcke, Wilson, & Simpson 1998; Bennert et al. 2002, hereafter B02, Schmitt et al. 2003).
The spectroscopic characteristics of the NLR gas have been studied, extensively, over several decades and high quality data are now available (e.g., Veilleux & Osterbrock 1987). The main source of excitation of the NLR gas is photoionization by the the central continuum (see review and references in Netzer 1990) but shock excitation must be important in some parts of this region, most notably is NLRs that are associated with jet-like radio structures (Schiano 1986; Dopita et al. 2002 and references therein). The gas dynamics has been studied too with detailed results concerning the profiles of various emission lines and their dependence on the level of ionization, the density and the dust content of the gas (e.g., Veilleux 1991; Nelson & Whittle 1996; Barth et al., 2001). A major emphasis in recent years has been the extension of such works to higher luminosity sources. Some such studies suggest that the [O iii] line width is correlated with the stellar velocity distribution in the bulge and thus also with the mass of the central black hole (Nelson, 2000; Shields et al., 2003).
Several recent attempts to study NLRs in large samples of AGNs lead to apparently conflicting results. B02 obtained narrow band HST images of seven luminous radio-quiet Palomar-Green (PG) quasars with . They argued, on the basis of comparison with nearby less luminous sources, that the NLR size (radius) scales with the [O iii] and the H line luminosities roughly as . The measured NLR sizes in their most luminous sources approached 10 kpc (throughout this work we assume km s-1 Mpc-1, , and ). This dependence has been questioned by Schmitt et al. (2003) who studied a much larger sample (22 Seyfert 1’s and 38 Seyfert 2’s), albeit with much lower luminosity, and found . Croom et al. (2002) analyzed the spectra of AGNs from the 2dF quasar redshift survey (2QZ) and claimed to see a decrease in the equivalent width (EW) of several narrow lines ([O II], [Ne V], and [Ne III]) with source luminosity. They suggested that at least part of this “Baldwin effect” (Baldwin 1977) is due to the increase in NLR size with source luminosity which leads to galactic-scale dimensions in the most luminous objects. Such NLRs are likely to escape the system leading to AGNs with weak or no NLR emission. Testing this idea for the most intense narrow line, [O iii] , was limited by the low redshift, and hence relatively low luminosity in the Croom et al. (2002) ground-based sample.
This paper addresses the issues of “the disappearing NLRs” and the Fe II/H ratio in high luminosity AGNs. The work complements the Shemmer et al. (2004; hereafter Paper I) study and is based on the same data set. The paper is arranged as follows: § 2 presents the new observations, § 3 shows various correlations involving the [O iii] , H, and Fe ii lines and § 4 discusses the implications regarding the size and the physics of the NLR as well as the Fe II/H ratio in the most luminous AGNs.
| Quasar Name | zaaSystemic redshift (see Paper I). | Log | EW([O iii]) | FWHM([O iii) | Fe ii/H | |||||
|---|---|---|---|---|---|---|---|---|---|---|
| Best Fit | Direct | Best Fit | Direct | Best Fit | Direct | Best Fit | ||||
| [erg s-1] | [Å] | [Å] | [erg s-1] | [erg s-1] | [km s-1] | [km s-1] | [erg s-1] | |||
| (1) | (2) | (3) | (4) | (5) | (6) | (7) | (8) | (9) | (10) | (11) |
| 2QZ J001221.1283630 | 2.339 | 46.26 | 44.29 | 1.27 | ||||||
| 2QZ J002830.4281706 | 2.401 | 46.58 | 32 | 31 | 44.40 | 44.38 | 1511 | 1823 | 44.63 | 0.37 |
| UM 667 | 3.132 | 46.28 | 16 | 16 | 43.78 | 43.79 | 759 | 1468 | 44.44 | 2.08 |
| LBQS 01090213 | 2.349 | 46.80 | 25 | 31 | 44.50 | 44.59 | 1398 | 1341 | 44.93 | 0.14 |
| [HB89] 0123257 | 2.369 | 46.57 | 27 | 27 | 44.31 | 44.32 | 587 | 532 | 44.75 | 0.26 |
| 2QZ J023805.8274337 | 2.471 | 46.57 | 44.70 | 1.57 | ||||||
| SDSS J024933.42083454.4 | 2.491 | 46.38 | 27 | 27 | 44.11 | 44.10 | 815 | 394 | 44.54 | |
| [HB89] 0329385 | 2.435 | 46.71 | 20 | 24 | 44.30 | 44.37 | 491 | 450 | 44.82 | 0.30 |
| [HB89] 0504030 | 2.473 | 46.32 | 73 | 74 | 44.49 | 44.51 | 1065 | 836 | 44.38 | 0.49 |
| SDSS J100428.43001825.6 | 3.046 | 46.44 | 54 | 60 | 44.46 | 44.51 | 527 | 996 | 44.76 | 0.59 |
| TON 618 | 2.226 | 47.31 | 45.42 | 0.65 | ||||||
| [HB89] 1246057 | 2.240 | 47.16 | 45.14 | 1.20 | ||||||
| [HB89] 1318113 | 2.306 | 46.89 | 14 | 13 | 44.31 | 44.28 | 1903 | 2303 | 44.84 | |
| [HB89] 1346036 | 2.370 | 46.88 | 45.02 | 0.87 | ||||||
| SDSS J135445.66002050.2 | 2.531 | 46.49 | 44.52 | 0.63 | ||||||
| UM 629 | 2.460 | 46.56 | 35 | 23 | 44.40 | 44.23 | 1413 | 929 | 44.77 | 1.29 |
| UM 632 | 2.517 | 46.54 | 15 | 16 | 44.03 | 44.05 | 196 | 492 | 44.85 | 0.35 |
| UM 642 | 2.361 | 46.29 | 11 | 14 | 43.63 | 43.74 | 1696 | 1859 | 44.53 | 0.41 |
| UM 645 | 2.257 | 46.31 | 23 | 30 | 43.98 | 44.09 | 525 | 633 | 44.67 | 0.10 |
| SBS 1425606 | 3.202 | 47.38 | 23 | 19 | 45.03 | 44.96 | 1382 | 659 | 45.37 | 0.34 |
| SDSS J170102.18612301.0 | 2.301 | 46.34 | 44.50 | 1.06 | ||||||
| SDSS J173352.22540030.5 | 3.428 | 47.00 | 11 | 8 | 44.34 | 44.22 | 1335 | 833 | 44.99 | 0.39 |
| [HB89] 2126158 | 3.282 | 47.25 | 13 | 9 | 44.64 | 44.51 | 1327 | 1040 | 45.47 | 0.49 |
| [HB89] 2132014 | 3.199 | 45.77 | 59 | 52 | 43.83 | 43.77 | 1315 | 1328 | 44.27 | 0.54 |
| 2QZ J221814.4300306 | 2.389 | 46.54 | 12 | 13 | 43.94 | 43.96 | 1791 | 2343 | 44.54 | 0.57 |
| 2QZ J222006.7280324 | 2.414 | 47.22 | 13 | 16 | 44.63 | 44.73 | 1019 | 908 | 45.14 | 0.42 |
| [HB89] 2254024 | 2.083 | 46.45 | 15 | 13 | 43.94 | 43.86 | 612 | 1390 | 44.78 | 1.27 |
| 2QZ J231456.8280102 | 2.400 | 46.31 | 15 | 15 | 43.79 | 43.81 | 1267 | 1654 | 44.47 | |
| 2QZ J234510.3293155 | 2.382 | 46.32 | 20 | 28 | 43.96 | 44.11 | 887 | 758 | 44.79 | 0.82 |
Note. — The methods used to obtain ’Best Fit’ and ’Direct’ measurements are outlined in Paper I.
2. Observations
We obtained new near infrared (IR) spectroscopic observations for a sample of 29 high-redshift, high-luminosity AGNs at the Anglo-Australian Telescope (AAT) in Australia and at Telescopio Nazionale Galileo (TNG) in Spain. The observations and data reduction are described in Paper I where all IR spectra are also shown (their Figures 1–3).
In this work we focus on the [O iii] emission line that, when observed, is the strongest narrow line in the spectrum (all numbers given in this paper refer to the 5007Å component only). We also show and discuss various correlations involving the broad Fe II lines. The measurement of the [O iii] line is complicated due to the presence of strong, broad Fe II blends in this part of the spectrum. The accurate modeling of these blends is crucial to our study of the Fe II spectrum as well as the measurement of the [O iii] line. Below we give a detailed description of this process and illustrate the results for the case of [HB89] 1346036.
The near-IR spectrum of the quasar [HB89] 1346036 (z=2.370) was observed by McIntosh et al. (1999). The same observation was later used by Yuan & Wills (2003) who remeasured the McIntosh et al. (1999) spectrum and used it in their study of the Eddington ratio in quasars. Both McIntosh et al. (1999) and Yuan & Wills (2003) found an [O iii] line in this source, which was later used in several of their correlations. Our superior, high S/N, better resolution IR spectroscopy of the source shows broad lines due to H and Fe II and a weak emission feature very close to the putative [O iii] position (Fig. 1 top curve). We have used the empirical Fe II emission template of Boroson & Green (1992; hereafter BG92), scaled to the intensity of the strongest iron features in order to remove those Fe II lines. The broadened template is shown in the diagram and the Fe II subtracted spectrum is given below the original spectrum. As seen in the diagram, the process completely removed all trace of [O iii] emission. We applied a similar procedure to the spectra of all other sources and the results listed below are all corrected for the Fe II blends. We suspect that other sources in the McIntosh et al. (1999) and the Yuan and Wills (2003) samples suffer from a similar problem and hence decided not to include these objects in our analysis. We note that Sulentic et al. (2004) also question some of the McIntosh et al. (1999) measurements.
Table 1 gives a summary of the data used in this paper. It includes the object name (column 1), systemic redshift (column 2), continuum luminosity defined as at rest wavelength 5100Å (column 3) and the basic [O iii] line measurements (rest-frame EW in columns 4 & 5, luminosity in columns 6 & 7, and FWHM in columns 8 & 9). Table 1 also gives the best-fit H luminosity in column 10, and the Fe ii/H flux ratio111This ratio matches the BG92 definition of R Fe ii, i.e., the ratio between the EW of the Fe ii blends in the – band and EW(H) in column 11. Regarding the uncertainties on those numbers, some of those are discussed in Paper I and the others, related to the [O iii] line, were obtained using the procedure explained in Paper I as applied to this line.

The main result, which is apparent in Table 1, is that the population of high-redshift, high-luminosity quasars is divided into two distinct groups. One group (22 sources) contains objects with strong [O iii] lines (EW Å) and with I([O iii] )/I(broad H) similar to the ratio observed in many low luminosity type-I AGNs. The second group (seven sources) shows no [O iii] line within the observational uncertainty. To obtain the upper limits on EW([O iii] ) in those sources, we assumed a “typical” [O iii] line with FWHM of 1000 km s-1 (about the median in our sample, see below) and looked for the weakest such feature that would have been detected in our spectra after the removal of the Fe II blends. For the best S/N spectra (three sources), this translates to an EW which is approximately EW(H). For the other four cases the upper limits correspond to EW(H). The luminosities corresponding to these upper limits are listed in Table 1.
The division into two distinct groups of very high luminosity AGNs is further confirmed by the Dietrich et al. (2002a) observations. These authors found that two out of the six luminous quasars in their sample have prominent [O iii] lines while the remaining four had no trace of this line. Combining with our new data we find that out of 35 high luminosity quasars, 24 show strong [O iii] and 11 others are consistent with no such line in their spectrum.
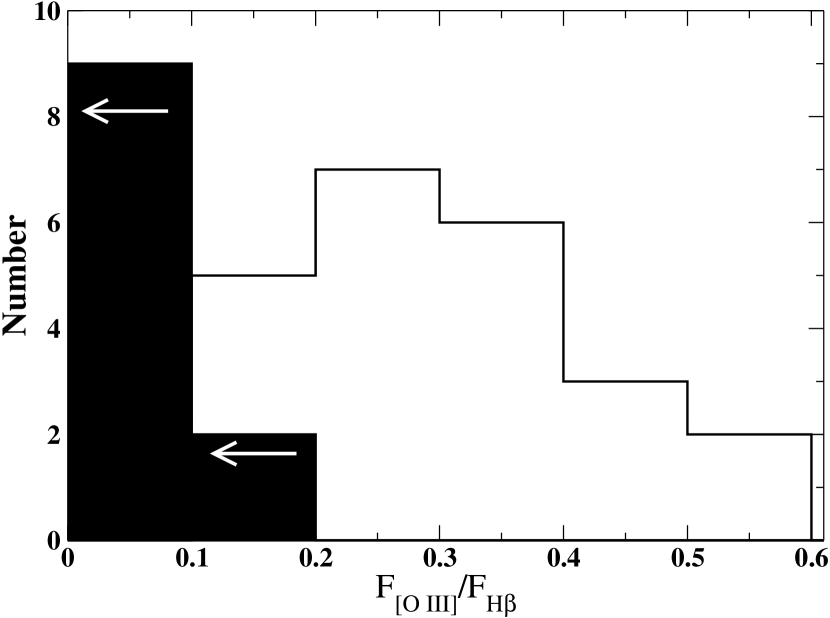
We have checked this finding in various ways. In particular, we have examined the distribution of I([O iii] )/I(H) which is shown in Fig. 2. The histogram is made up of a broad distribution centered at about 0.3 and a group of sources with I([O iii] )/I(H). Unfortunately, the uncertainty on the upper limit of I([O iii] ) in two of the sources is very large and those objects bridge the gap between the strong and the very weak [O iii] emitters. We must therefore consider two hypotheses: one is a real dichotomy in the [O iii] line intensity and the other, a continuous distribution in EW([O iii] ) which has a long tail at very small EWs.
Very high luminosity sources that are also weak [O iii] emitters have been found by Yuan and Wills (2003) in their IR study of high redshift quasars. However, most of those objects are broad absorption line quasars (BALQSOs) that are known to have a weak [O iii] line. Regarding intermediate luminosity AGNs, BG92 find that 26 out of the 87 sources in their PG quasar sample show EW([O iii] )Å and 12 show EW([O iii] )Å. In addition, about half of the quasars in the new Sulentic et al. (2004) high- sample have EW([O iii] )Å. Assuming the upper limits we obtained can be translated to actual EW measurements, we conclude that the EW distribution in our sample is not very different from that of BG92. Combining with the information about nearby Seyfert 1s we conclude that there are very few weak [O iii] emitters among low luminosity AGNs, but their fraction increases towards intermediate and high luminosity. However, of the very luminous sources in our sample is two orders of magnitude larger than observed in the most luminous BG92 objects. This has important implications for the physics and the structure of the NLR in these extreme cases as discussed in the following sections.
3. Luminosity, Equivalent-Width, and Size Correlations
3.1. Measured and predicted NLR sizes
B02 measured NLR sizes in seven PG quasars and compared them with sizes obtained by Falcke et al. (1998) in nearby Seyfert 2 galaxies. Their main finding is a strong correlation between the NLR radius () and the [O iii] line luminosity. Their relationship (B02 Eq. 1) scaled to the somewhat different cosmology adopted here, can be written as
| (1) |
where . This is in perfect agreement with (the uncertainty on the constant 2.1 kpc is of order 15%). For reasons that shall become apparent later, we prefer to use the equivalent relation involving the H luminosity (B02 Eq. 3 converted to our assumed cosmology)
| (2) |
where .
The recent, more detailed work of Schmitt et al. (2003) use a sample of 60 Seyfert 1 and Seyfert 2 galaxies and discuss in detail the differences between the two sub-groups, the concentration of the [O iii] emission, etc. The main finding which is relevant to our work is the following relationship (adjusted to the cosmology used here)
| (3) |
where is the size of the semi-major axis of the [O iii] nebulosity. This is significantly different from the B02 results in both the dependence and the normalization. Schmitt et al. (2003) have also investigated the correlation when the seven B02 sources are added to their sample. The result is a steeper dependence of the form . A new work by Bennert et al. (2004) argues that much of the difference is due to orientation since most of the sources in Schmitt et al. (2003) are Seyfert 2s while the more luminous sources in B02 are all type-I AGNs. We shall return to this issue in § 4.

Theoretical suggestions that the NLR size should scale with , where is the ionizing source luminosity, have been discussed in many papers (see Netzer 1990 for references prior to 1990 and Dopita et al 2002 for more recent publications). This is based on the assumption that both the broad line region (BLR) gas and the NLR gas are photoionized by a central source whose spectral energy distribution changes only slightly with source luminosity. Spectroscopic studies show a remarkable similarity between the emission line spectrum of high and low luminosity AGNs. This suggests that the ionization parameter, (defined here as the ratio of the Lyman continuum photon density to the hydrogen number density ), and the typical gas density, are basically the same in all sources. Since , we find . An additional assumption is that most of the [O iii] emission originates in radiation-bounded clouds, because of the fairly uniform value of I([O iii] )/I(narrow H). This allows to replace by the luminosity of any hydrogen recombination line, e.g., H. We note that there is a well established correlation for the BLR gas (e.g., Kaspi et al. 2000) where reverberation mappings show that .
A real physical explanation of any dependence is still lacking since the mechanism controlling the gas density and location is unknown. Some papers assume a stratified, radiation bounded NLR with a pre-chosen run of density and hence level of ionization (e.g., Netzer 1990; Komossa & Schulz 1997). Such models are naturally normalized in incident flux units () and can be tuned to produce the same mean for all sources. However, some narrow emission lines are probably produced in density bounded gas (e.g., Binette, Wilson, & Storchi-Bergmann 1996) which considerably complicate the models. It is also clear (e.g., Alexander et al. 1999) that well studied NLRs contain a large range of conditions with a spread in ionization parameter and gas density. An almost orthogonal approach is provided by the “locally optimally emitting cloud” (LOC) model (Ferguson et al. 1997). The assumption in this case is of a large range of conditions (density and covering factor) at each location, where the intensities of the various lines reflect the line production efficiency at each location. This efficiency is the highest for densities that are close to the critical density of the line in question. The model provides a natural scaling of with provided there is a large reservoir of gas with similar properties in all AGNs and on all scales. Finally, there are equally complex NLR models where shock excited gas contributes significantly to the observed NLR emission (e.g., Contini, Prieto, & Viegas 1998; Schiano 1986; Dopita and Sutherland 1995) but no natural scaling.
The recent papers by Dopita et al. (2002) and Groves et al. (2004) provide a more solid foundation to NLR modeling. These authors assumed dusty, stratified NLR clouds where the external radiation pressure acts mostly on the dust particles and forces the local ionization parameter to certain specific values such that in the [O iii] producing gas, . The model suggests a natural dependence. It also implies that the composition and temperature of the gas are rather different from those assumed in other models because of metal depletion.
3.2. New [O iii] and measurements
The combination of the B02 observations and the recent theoretical developments point to a “natural” dependence yet raises a severe problem regarding the NLR size in high luminosity AGNs. Any such scaling will lead, at large enough , to sizes that are larger than galactic sizes. The B02 results addressed here are used for normalizing this relationship, but the problem exists at high luminosity whether or not their scaling is correct. Given this, we would not expect to see any strong [O iii] emitters in high luminosity sources, yet our new observations clearly show such objects.
To define the problem in a more quantitative way we plot in Fig. 3 three quantities vs. (luminosity of the entire emission line). The first is the measured from the B02 sample (seven sources) where we also show the best (modified) B02 fit (Eq. 2). The second is from our newly observed H and [O iii] lines with two additional sources from Dietrich et al. (2002a). For these we use Eq. 1 to guess , given the observed . The predicted for most sources in this group lie close to the value predicted from (the straight line) confirming the small scatter in I([O iii] )/I(H). The third group includes the seven sources from our sample and the four sources from Dietrich et al. (2002a) where no [O iii] has been detected. For these we use derived from the upper limits on . The upper limits on obtained in this way are a factor of smaller than those derived from .
The implications of Fig. 3 are clear. For those sources with measured H and [O iii] lines, the derived is enormous, exceeding 70 kpc in the most luminous sources. We consider those sizes completely unreasonable for reasons that are discussed in the next section. Like Fig. 2, this diagram suggest a dichotomy in the properties of the high luminosity quasars, where some sources show strong [O iii] lines and others show no or very weak such emission.
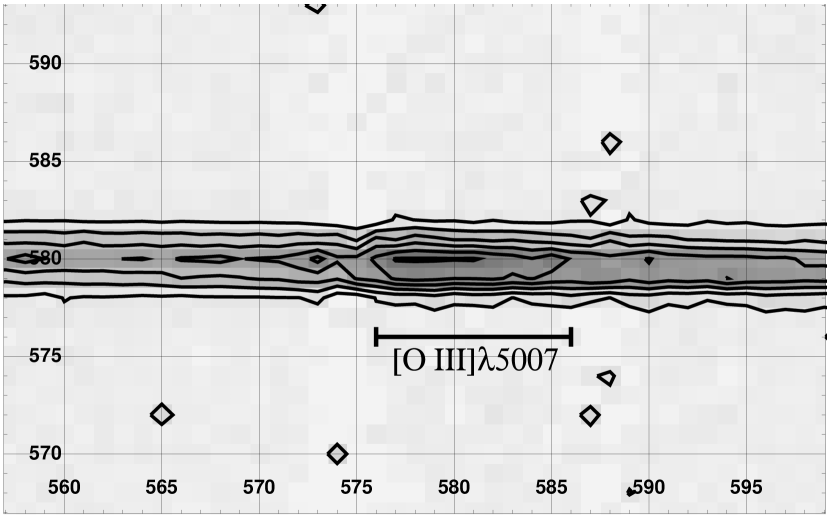
There are two other ways to verify, experimentally, the B02 claim. Most of our sample is at . At this redshift, and the chosen cosmology, the angular diameter distance is a weak function of redshift and corresponds to about 7 kpc per arc-sec. The predicted , using the B02 relationships and our measured [O iii] luminosities, corresponds to a total extent of 2″-10″. This can be tested by spatially resolved space and ground-based observations. The 2D spectra of two of our sources ([HB89] 0329385, and 2QZ J222006.7280324) show prominent [O iii] emission which allow such measurements (see Fig. 4). In these cases, most of the line flux (%) is emitted within the central four pixels corresponding to a radius of kpc at each source. This size is a strong upper limit since much of the flux is likely to be due to the PSF (corresponding to ″ at the time of observations). The two upper limits on obtained in this way are a factor of smaller than the radii derived from the B02 relationships.
The term “NLR radius” used by B02 is ambiguous since those authors used very low surface brightness features to define the dimension of the [O iii] nebulosity. We used the HST archive to extract and re-analyze the B02 images. In particular, we examined the source showing the largest [O iii] nebulosity, PG 1049005, and remeasured its observed [O iii] image. We found that 95% of the line emission is encircled within a radius of 1.1″ which corresponds to a radius of 5.5 kpc at the source. This is half of the radius deduced by B02 and suggests that the bulk of the NLR emission is emitted within a volume which is much smaller than inferred by their relationships. The different way of measuring the [O iii] nebulosity is probably the main source of discrepancy in normalization (i.e., the NLR radius at ) between the B02 and the Schmitt et al. (2003) works.
In summary, our new observations contradict the B02 results in two ways. First, about one third of the high luminosity sources show no trace of an NLR. Second, there are direct indications in three cases, and sound theoretical reasons (see below), to suggest that most of the NLR emission is restricted to a volume which is much smaller than inferred from the B02 relationships.

3.3. The Baldwin relationship for [O iii]
The new data show the presence of two groups of luminous AGNs, those with strong [O iii] and those with no (or very weak) such line. Out of the 35 sources investigated by us (6 from Dietrich et al. 2002a and 29 from our IR sample), 24 belong to the first group and 11 to the second. As mentioned above, earlier studies, like the Yuan & Wills (2003) work, already found very weak [O iii] in several AGNs. Most or all of these are known BALQSOs while only two of the 10 sources discussed here (one from Dietrich et al. 2002a, [HB89] 0105265 and one, [HB89] 1246057, from our sample) show BALQSO properties. Thus, weak or no [O iii] seems to be a common property of many luminous AGNs.
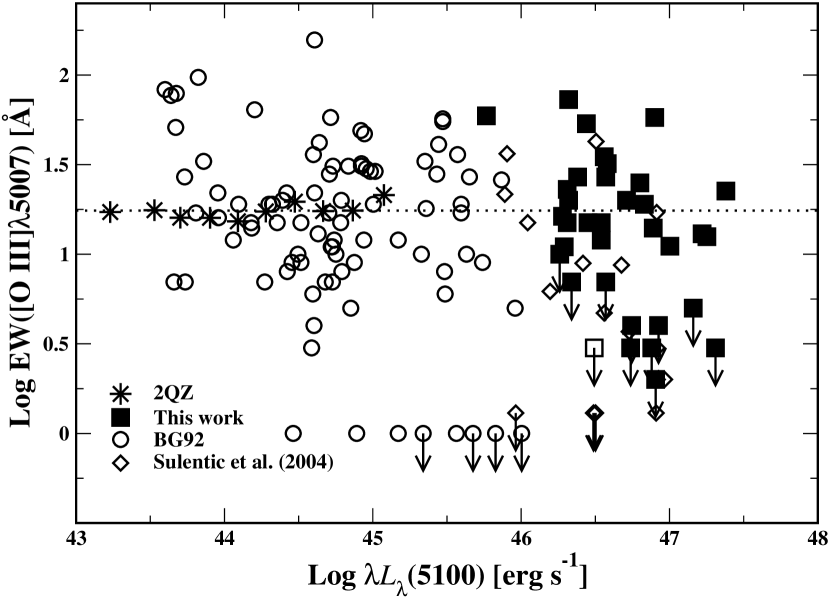
To further illustrate this point we plot in Fig. 5 EW([O iii] ) versus (5100Å) for the high- quasars from our sample and that of Sulentic et al. (2004), for which magnitudes were transformed to (5100) assuming with . We also included the BG92 sample in the diagram, and the 2QZ data of Croom et al. (2002), for which magnitudes were transformed to (5100) using the same methods as above. The diagram shows that for the population of strong [O iii] emitters, there is no reduction of EW([O iii] ) with source luminosity. On the other hand, there are many weak, or no [O iii] emitters at high luminosity that could give the impression that the line EW decreases with increasing source luminosity. (In fact, the Croom et al. 2002 data represent mean EW([O iii] ) in several luminosity bins. Assuming a fraction of weak [O iii] emitters in those bins similar to the one found by BG92, we find that the plotted average may underestimate the typical EW([O iii] ) in those sources by about 25%). We suspect that the Dietrich et al. (2002b) claim of a Baldwin relationship for this line is the result of their averaging together four very weak [O iii] emitters with two sources showing “typical” EW([O iii] ).
For completeness, we tested also the correlation of EW([O iii] ) with accretion rate (in terms of the ratio, hereafter ; see Paper I for more details) Correlations with accretion rate are found to be extremely important in Paper I and in § 3.5 below. For EW([O iii] ), this correlation is not significant (see Table 2).
3.4. FWHM correlations
We have tested our sample for possible correlations of luminosity, black hole (BH) mass, and accretion-rate with FWHM([O iii] ). Such correlations have been investigated in the past (e.g., Shields et al. 2003), and FWHM([O iii] ) has been suggested as a potentially useful surrogate for .
Fig. 6 shows FWHM([O iii] ) vs. source luminosity, , and for our sample and the Shields et al. (2003) sources. To obtain the intrinsic line width we assumed
| (4) |
where is the instrumental resolution. Since the slit-width and the seeing disk sizes were comparable during the time of observations, this is a reasonable assumption for line profiles that are indistinguishable from a Gaussian. The uncertainty on FWHM([O iii] ) is quite large for the poorer S/N spectra and is of the order of the instrumental (or rebinned instrumental) resolution ( km s-1). BH masses and for all sources on these diagrams were calculated as prescribed in Paper I.
On their own, the measured FWHM([O iii] ) for our high- sources show no correlation with luminosity, BH mass, or accretion-rate, due to the narrow luminosity range of our sample. The additional Shields et al. (2003) data increase this range considerably and show significant correlations with all three parameters. The strongest correlation is between FWHM([O iii] ) and luminosity. The strength of the correlation increases with the dependence on luminosity, i.e. less significant correlations as one goes from to () to ).
3.5. Correlations involving H and Fe ii
In Paper I and in Table 1 we give , which we transformed to EW(H), and Fe II/H. Here, again, we have tested the correlations of these quantities against , , and using our sample, and the samples of Sulentic et al. (2004) and BG92 (accretion rates for the BG92 sample were calculated as prescribed in Paper I). For EW(H) we find significant correlations with both and . Details of the correlations are given in Table 2 and in Fig. 7. In the case of Fe II/H the only significant correlation is with . Details of those correlations are also given in Table 2. Fig. 8 shows the strongest correlation of Fe II/H (against the accretion rate) for our new sources combined with those of BG92.
| Property vs. | Fe ii/H | EW([O iii]) | EW(H) | ||
|---|---|---|---|---|---|
| (1) | (2) | (3) | (4) | (5) | (6) |
| (5100) | 0.85aa118 sources from BG92 and this work | 0.48aa118 sources from BG92 and this work | -0.04bb124 sources from BG92, Sulentic et al. (2004), and this work | -0.09dd121 sources from BG92, Sulentic et al. (2004), and this work | -0.37gg135 sources from BG92, Sulentic et al. (2004), and this work |
| 0.03aa118 sources from BG92 and this work | -0.22cc107 sources from BG92 and this work | 0.14ee104 sources from BG92 and this work | -0.15hh118 sources from BG92 and this work | ||
| 0.48cc107 sources from BG92 and this work | -0.13ee104 sources from BG92 and this work | -0.47hh118 sources from BG92 and this work | |||
| Fe ii/H | -0.39ff110 sources from BG92, Sulentic et al. (2004), and this work | -0.33bb124 sources from BG92, Sulentic et al. (2004), and this work | |||
| EW([O iii]) | 0.28dd121 sources from BG92, Sulentic et al. (2004), and this work | ||||
| EW(H) |
Note. — Significant correlations with chance probabilities smaller than 1% are given in bold face. Upper limits were not included in the correlations.
The Baldwin relationship found here for EW(H), and shown in Fig. 7 is interesting since it is in contradiction with the Croom et al. (2002) finding for this line. However, our combined sample is far from being complete, in particular at the high luminosity range where we specifically chose to observe high luminosity sources. Thus it is likely that lower luminosity sources at high redshift would have a larger EW(H) that will spoil the correlation. Regarding the dependence on accretion rate, similar selection effects may be operating but the observed correlation is so strong that we suggest that this may be a real effect. We also note that in Fig. 7, the narrow-line Seyfert 1 galaxies (NLS1s) are situated very close to the high luminosity, high accretion rate sources. The situation resembles the Baskin & Laor (2004) finding that EW(C iv ) depends strongly on even in low luminosity AGNs that do not show the Baldwin relationship for this line.
Fig. 8 is hard to interpret. Considering only sources with measurable Fe II/H (i.e., a ratio larger than ) we find a clear trend of increased Fe II/H for higher accretion rates (see Table 2). In particular, we note the similar location on the diagram of our high- quasars and the NLS1s. However, there is a significant number of sources with very small Fe II/H and very large . We note, in this respect, that our new observations extend the measurement of Fe II/H to values of never investigated before. The only exceptions, perhaps, are a few BALQSOs in the Yuan & Wills (2003) sample with spectral properties very different from those of our (non-BAL) sources (note that these authors measured the entire optical Fe II blends and their values must be scaled down by a factor 3.58 for comparison with the measurements presented in our work; B. Wills private communication).

The above two findings suggest that the main reason for the increase of Fe II/H with the accretion rate is the decrease of EW(H) with . In fact, looking at EW(Fe II) against (not shown here) we find no correlation at all. The fractional increase in Fe II/H with accretion rate is also consistent with the decrease in EW(H). However, we cannot rule out the possibility that changes in the Fe/H abundance ratio are involved too, as shown, in Paper I, to be the case for N/C.

In Fig. 9 we plot the well known anti-correlation between EW([O iii] ) and Fe II/H (e.g., BG92) for our sources, for the low- BG92 sources, and for the new intermediate- sample of Sulentic et al. (2004). Our sources are consistent with this trend. Fe II/H for our sources is generally higher than in BG92 and Sulentic et al. (2004) indicating, perhaps, the strong dependence of this property on the total luminosity. However, there are clear exceptions, i.e., sources with very high luminosity, yet relatively small Fe II/H. Here, again, we note similar large values of Fe II/H in several of the BALQSOs of Yuan & Wills (2003) .
4. Discussion
4.1. Do enormous NLRs really exist?
A major goal of the present investigation is to test the NLR properties and the NLR spectrum in very high luminosity sources where the theoretically predicted , as well as the empirical B02 relationship, results in unreasonably large dimensions. The B02 sample already included claims for sources with kpc and our bright [O iii] emitters would continue this relationship to enormously large NLRs (more than 100 kpc in diameter, see Fig. 3). There are, however, fundamental problems in this suggested size-luminosity interpretation on both observational and theoretical grounds.
B02 suggested two estimates of the NLR size (Eq. 1 & 2). We separate the discussion of those claims into two, according to the two sub-groups discovered here (the weak and the strong [O iii] emitters). For the weak [O iii] emitters we find a clear contradiction between the based on the observed H luminosity and the one based on the observed (or the upper limit on) [O iii] luminosity (Fig. 3). As for the strong [O iii] emitters, 2D spectra of two of our sources rule out the large predicted dimensions (§ 3.2). Moreover, our new measurements of the largest [O iii] nebula in the B02 sample are also in conflict with the B02 relationships. Based on the evidence in hand we suspect that the dependence breaks down at some intermediate luminosity scale and that the “true” NLR radius, defined here as the radius encompassing 95% of the line emission, does not exceed a few kpc even in the most luminous quasars.
There are other predictions that make us question the existence of such enormous NLRs. The suggested relationship would predict NLR sizes, in the most luminous AGNs, that exceed the size of the largest known bulges and, in fact, the size of the largest known galaxies (except for some cD galaxies). Such sizes are unacceptable for several reasons. First, the escape velocity from a spherical galaxy is roughly km s-1, where is the mass in units of and the radial distance in units of 10 kpc. The new FWHMs listed in Table 1 and shown in Fig. 6, compared with the predicted , suggest therefore, dynamically unbounded NLRs. Given those velocities and dimensions, the dynamical time for the most luminous [O iii] emitters, is a few years suggesting a short lived phenomenon. The inferred amount of ionized gas in such NLRs, given radiation bounded gas and a “typical” ionization parameter, is
| (5) |
where is the covering fraction and the column density in units of cm-2. Simple photoionization arguments show that for strong [O iii] emitters . This would give for all of our sources and for the most luminous [O iii] emitters. Judging by the observed FWHM, most of this material is probably unbound and thus flows from the center at outflow rates approaching assuming a density of . All those numbers seem incompatible with long term mass ejection in AGN-hosting galaxies.
The Schmitt et al. (2003) results alleviate some of these difficulties because of the smaller size normalization and the flatter - dependence. However, it is not at all clear that extrapolating their results to much higher luminosity with the suggested dependence (Eq. 3) is justified in view of the B02 measurements.
We are facing a situation where sound physical arguments (the narrow line spectrum, the Groves et al. 2004 dusty NLR model, etc.) support the expected relationship, yet its application to the most luminous quasars give unreasonably large sizes, masses and mass outflow rates. As explained below, the most likely explanation in our opinion is that “typical” NLRs (i.e., those similar in their properties to the ones observed in Seyfert 1 galaxies) cannot last very long in high and perhaps also in intermediate luminosity AGNs. This means that the [O iii] emitting regions in our sample may be of a different origin and physical properties.

4.2. Luminous NLRs as star forming regions
If compact NLRs are indeed typical of many high luminosity AGNs, then their properties must be very different from the properties of those NLRs observed in nearby sources. In particular, the gas density in the highest luminosity NLRs must be several orders of magnitude larger. Consider for example a maximum NLR size of kpc and assume a similar ionization parameter in all NLRs. This would mean that the gas density in the most luminous [O iii] emitters is times larger than the density in nearby Seyfert 1 galaxies. The spectroscopic properties must be very different too which can, in principle, be tested by accurate observations. Unfortunately, present day IR spectroscopy is very limited in this respect because of the restricted wavelength bands available to ground-based observations.
A possible origin of a high density gas in kpc-scale nuclear regions is violent star-forming activity. Such events can produce high density, large column density, non-solar composition dusty gas. The overall spectrum of such regions is likely to differ from the spectrum of nearby, lower density NLRs. At present we can only observe [O iii] which is the strongest emission line under a variety of conditions. Future, space-born spectroscopy, will be able to test this idea by looking for other emission lines.
The scenario we propose to explain the observations of our high luminosity AGNs, and the apparent break down of the relationship, is of two distinct populations. One where such scaling continues to high luminosity due to radiation pressure force or other effects. This results in short-lived enormous NLRs that will show basically no nuclear narrow emission lines during most of their life. The other group is those sources where starburst or another unknown process ejects high density gas into their nuclear region. This gas is ionized and excited by the central radiation source and produces the observed strong [O iii] lines. Such “star-forming NLRs” would have spectral properties that are rather different from those observed in nearby less luminous sources. Given the similar fraction of weak [O iii] emitters in BG92 and in our new sample, we suggest that the phenomenon is of a continuous nature and starts at some intermediate luminosity. Its clearest manifestation is in the highest luminosity sources such as the ones observed here.
4.3. Correlations involving Fe ii, H, and [O iii]
The sample used here, which combines data from various different sources, is not complete. However, it allows the best test, so far, of the BG92 Fe II/H –[O iii] relationship and several other suggested correlations at the high end of the AGN luminosity function. The results presented here suggest that the most extreme values of Fe II/H require very high luminosity. They also suggest that higher accretion rate results in larger Fe II/H (Fig. 8) and that is the most important factor for determining several other correlations. There are, however, some exceptions, i.e., sources with large yet small Fe II/H. Our work shows that the decrease of EW(H) with increasing in the present sample is probably the cause for the increase of Fe II/H with the accretion rate. EW(Fe II) by itself does not depend on the accretion rate and it is therefore possible that the iron-to-hydrogen abundance ratio plays no role in this correlation. On the other hand, we do not have the data or a good enough theory (e.g., Verner et al. 2004 and references therein) to completely rule out the possibility that the iron abundance depends on luminosity or on the accretion rate. In a similar way, EW([O iii] ) is not correlated with , but we suggest that the Fe II/H – EW([O iii] ) anti-correlation is driven by the accretion rate.
Sulentic et al. (2004) and others argued that the general AGN population should be divided into two sub-groups according to the so-called Eigenvector 1 (E1, see BG92) which contains four main observables. According to this scheme, group A sources show the strongest E1 properties. Most radio-loud AGNs belong to group B, i.e., those with weaker E1 properties. Here we are not interested in E1 as such since our sample is not complete and so is the combination of our sample with the BG92 and the Sulentic et al. (2004) samples. We are however in a position to look at the extreme end of the distribution in and in and test for those quantities that depend on them. We have already discussed all the relevant correlations. Here we note that all those involving show that NLS1s occupy the same part of parameter space as the high luminosity, high accretion rate AGNs observed by us. These sources are thus the high luminosity analogs of NLS1s and should, perhaps, be referred to as narrow-line type 1 quasars (NLQ1s).
5. Conclusions
We have discussed the near-IR spectra of 29 newly observed high-luminosity high-redshift AGNs and used the data to argue that previous claims for expected and observed dependence are in conflict with the observations. About 2/3 of all very high luminosity sources show strong [O iii] lines while the remaining objects show no or very weak such line. We suggest that the NLR properties in high luminosity, strong [O iii] emitters are very different from those observed in nearby AGNs, and possibly imply denser than “usual” NLRs. The origin of the high density gas is likely to be a violent star-forming event in the nucleus. We also investigated Fe II/H and EW([O iii] ) at the high end of the luminosity and in AGNs and showed that the first of those is probably driven by the overall accretion rate while the second is independent of source luminosity (i.e., no Baldwin relationship) or accretion rate. The Fe II/H ratio may be an iron abundance indicator but this cannot be proven observationally because of the EW(H) dependence on accretion rate.
References
- Alexander et al. (1999) Alexander, T., Sturm, E., Lutz, D., Sternberg, A., Netzer, H., & Genzel, R. 1999, ApJ, 512, 204
- Baldwin (1977) Baldwin, J. A. 1977, ApJ, 214, 679
- Barth et al. (2001) Barth, A. J., Ho, L. C., Filippenko, A. V., Rix, H., & Sargent, W. L. W. 2001, ApJ, 546, 205
- Baskin & Laor (2004) Baskin, A. & Laor, A. 2004, MNRAS, 350, L31
- Bennert et al. (2002) Bennert, N., Falcke, H., Schulz, H., Wilson, A. S., & Wills, B. J. 2002, ApJ, 574, L105
- Bennert et al. (2004) Bennert, N., Falcke, H., Shchekinov, Y., & Wilson, A. S. 2004, in The Interplay among Black Holes, Stars and ISM in Galactic Nuclei, IAU 222, eds. T. Storchi-Bergmann, L.C. Ho, and H.R. Schmitt
- Binette, Wilson, & Storchi-Bergmann (1996) Binette, L., Wilson, A. S., & Storchi-Bergmann, T. 1996, A&A, 312, 365
- Boroson & Green (1992) Boroson, T. A. & Green, R. F. 1992, ApJS, 80, 109
- Contini, Prieto, & Viegas (1998) Contini, M., Prieto, M. A., & Viegas, S. M. 1998, ApJ, 492, 511
- Croom et al. (2002) Croom, S. M. et al. 2002, MNRAS, 337, 275
- Dietrich, Appenzeller, Vestergaard, & Wagner (2002) Dietrich, M., Appenzeller, I., Vestergaard, M., & Wagner, S. J. 2002a, ApJ, 564, 581
- Dietrich et al. (2002) Dietrich, M., Hamann, F., Shields, J. C., Constantin, A., Vestergaard, M., Chaffee, F., Foltz, C. B., & Junkkarinen, V. T. 2002b, ApJ, 581, 912
- Dopita & Sutherland (1995) Dopita, M. A. & Sutherland, R. S. 1995, ApJ, 455, 468
- Dopita et al. (2002) Dopita, M. A., Groves, B. A., Sutherland, R. S., Binette, L., & Cecil, G. 2002, ApJ, 572, 753
- Falcke, Wilson, & Simpson (1998) Falcke, H., Wilson, A. S., & Simpson, C. 1998, ApJ, 502, 199
- Ferguson, Korista, Baldwin, & Ferland (1997) Ferguson, J. W., Korista, K. T., Baldwin, J. A., & Ferland, G. J. 1997, ApJ, 487, 122
- (17) Groves, B. A., Dopita, M. A., & Sutherland, R. S. 2004 (submitted to ApJ)
- Kaspi et al. (2000) Kaspi, S., Smith, P. S., Netzer, H., Maoz, D., Jannuzi, B. T., & Giveon, U. 2000, ApJ, 533, 631
- Komossa & Schulz (1997) Komossa, S. & Schulz, H. 1997, A&A, 323, 31
- McIntosh et al. (1999) McIntosh, D. H., Rieke, M. J., Rix, H.-W., Foltz, C. B., & Weymann, R. J. 1999, ApJ, 514, 40
- Nelson (2000) Nelson, C. H. 2000, ApJ, 544, L91
- Nelson & Whittle (1996) Nelson, C. H. & Whittle, M. 1996, ApJ, 465, 96
- Netzer (1990) Netzer, H. 1990, in Active Galactic Nuclei, ed., T. J.-L. Courvoisier & M. Mayor (Berlin: Springer), 57
- Netzer (2003) Netzer, H. 2003, ApJ, 583, L5
- Schiano (1986) Schiano, A. V. R. 1986, ApJ, 302, 81
- Schmitt et al. (2003) Schmitt, H. R., Donley, J. L., Antonucci, R. R. J., Hutchings, J. B., Kinney, A. L., & Pringle, J. E. 2003, ApJ, 597, 768
- Shemmer et al. (2004) Shemmer, O., Netzer, H., Maiolino, R., Croom, S., Oliva, T., & Di Fabrizio, L. 2004, ApJ, in press (Paper I)
- Shields et al. (2003) Shields, G. A., Gebhardt, K., Salviander, S., Wills, B. J., Xie, B., Brotherton, M. S., Yuan, J., & Dietrich, M. 2003, ApJ, 583, 124
- Sulentic et al. (2004) Sulentic, J. W., Stirpe, G. M., Marziani, P., Zamanov, R., Calvani, M., & Braito, V. 2004, A&A, in press (astro-ph/0405279)
- Veilleux (1991) Veilleux, S. 1991, ApJS, 75, 383
- Veilleux & Osterbrock (1987) Veilleux, S. & Osterbrock, D. E. 1987, ApJS, 63, 295
- Verner et al. (2004) Verner, E., Bruhweiler, F., Verner, D., Johansson, S., Kallman, T., & Gull, T. 2004, ApJ, in press
- Yuan & Wills (2003) Yuan, M. J. & Wills, B. J. 2003, ApJ, 593, L11