A new HI catalog of Low Surface Brightness galaxies out to z=0.1
Using both the Arecibo 305m and the Nançay decimetric 100-m class radio telescopes, we have observed the H i line of 116 Low Surface Brightness (LSB) galaxies from the Bothun et al. 1985 subset of LSB galaxies in the Uppsala General Catalog. The observations had a detection rate of 70%, resulting in the new determination of H i properties for 81 galaxies. Surprisingly, roughly half of the detected objects (38) have M M⊙, placing them into the category of massive LSB galaxies. As previously only 18 of these ‘Malin 1 cousins’ were known, our results have more than tripled the number of these fascinating and enigmatic systems known.
Combining our results with previous studies done on the Bothun et al. catalog results in a well-defined catalog of H i properties of 526 LSB galaxies ranging in redshift space from . With this catalog in hand, we have been able to explore the parameter space occupied by LSB galaxies more completely than has been previously possible. In agreement with previous studies, our results show LSB galaxies with some of the most extreme properties of disk galaxies, including MHI/LB ratios often exceeding 10 M⊙/L⊙,B.
Key Words.:
galaxies: distances and redshifts – galaxies: mass –galaxies: spiral – galaxies: spiral – galaxies: luminosity function – galaxies: mass function1 Introduction
Low Surface Brightness (LSB) galaxies, those objects with central surface brightness at least one magnitude fainter than the night sky, are now well established as a real class of galaxies with properties distinct from those that define the Hubble Sequence (e.g. Impey & Bothun impey97 (1997); Bothun et al. bothun97 (1997) and references therein). Yet considerable uncertainty still exists as to both the range in properties of these galaxies and their number density in the z 0.1 Universe. As LSB galaxies encompass many of the ’extremes’ in galaxy properties, gaining a firm understanding of LSB galaxy properties and number counts is vital for testing galaxy formation and evolution theories. Additionally, in this era of precision cosmology (e.g. Spergel et al. spergel03 (2003)) it becomes increasingly important to determine the relative amounts of baryons that are contained in galaxy potentials compared to those that may comprise the Intergalactic Medium. As long as the possibility exists that optical and baryonic luminosity functions are significantly biased toward galaxies with relatively high surface brightness, we will not be able to obtain a clear understanding of the percentage of baryons which lie in galaxies.
The ‘traditional’ perception of LSB galaxies is that they are low mass, fairly blue systems with relatively high MHI/LB values and low metallicities (Bergmann et al. bergmann03 (2003); Bell et al. bell99 (1999); Gerritsen & de Blok gerritsen99 (1999); de Blok et al. deblok95 (1995)). Consequently, LSB galaxies are often equated with young dwarf galaxies (Dekel & Woo dekel03 (2003); Cabanela & Dickey cabanela02 (2002); Jimenez et al. jimenez98 (1998)). However, the simple, consistent, and repeatable observation that LSB disk galaxies can be found at any value of circular velocity (or total mass) is often under-appreciated, reinforcing the erroneous perception that LSB galaxies are strictly low mass systems. The current set of observations for all LSB galaxies shows them to have a remarkably diverse array of properties:
- •
-
•
Recent H i surveys by, e.g. Burkholder et al. (burkholder01 (2001)) and O’Neil et al. (oneil00b (2000)) show no tendency toward LSB systems having lower than average H i masses and/or total dynamical masses. The LSB sources with H i detections in Burkholder et al. (burkholder01 (2001)), for example, have on average = 9.0 0.6, compared to = 9.4 0.6 for that survey’s High Surface Brightness (HSB) galaxy sample – both samples have the same mean and range of values of circular velocity;
- •
-
•
Although the average LSB galaxy does have lower metallicities than the average HSB galaxy, LSB galaxies with near-solar abundances have been found (Bell bell00 (2000));
-
•
While many LSB systems with extremely high MHI/LB values have been found, the argument that may be due more to the nature of the H i LSB galaxy surveys – since redshifts for LSB systems are often found by searching in H i, LSB galaxies without detectable quantities of H i do not make it into databases, artificially raising the value of . Countering this trend, the recent survey of Burkholder et al. (burkholder01 (2001)) obtained optical redshifts for a large sample of LSB galaxies which were also observed in H i. The resultant catalog contains LSB systems with MHI/LB as low as 10-6 M⊙/L⊙,B.
While none of the above results contradict the idea that the average LSB galaxy is less evolved than the average HSB galaxy, they do show that we have not yet come close to fully sampling the LSB galaxy parameter space. In addition, it should be emphasized that there may still be large numbers of LSB galaxies with properties beyond our present detection limits (e.g. Sabatini et al. sabatini03 (2003)).
One issue related to the study of LSB galaxies lies in their potential contribution to the total baryonic content of the Universe. A wide variety of data and opinions have been offered on this topic. Blind H i surveys, such as those done by Kilborn et al. (kilborn02 (2002)), Rosenberg & Schneider (rosenberg00 (2000)), Kraan-Korteweg et al. (kraan99 (1999)), Knezek (knezek99 (1999)) and Zwaan et al. (zwaan97 (1997)) detect no massive LSB galaxies in the local (z 0.025) Universe, leading to the conclusion that LSB galaxies could not be significant contributors to the local H i mass function (HIMF) and subsequently to the baryonic mass function. Similar conclusions have also been reached based on optical surveys (e.g. Blanton et al. blanton03 (2003); Cross et al. cross01 (2001)). Such a conclusion, however, is valid only if one believes that a fair and representative volume of the Universe has been probed in both the optical and 21-cm bands, and that the properties of the objects found in these surveys is well understood.
The analysis of the WMAP results have provided a precision measure of the total baryonic content of the Universe, albeit in a model dependent way. In normalized units, the contribution of baryons to the total energy density of the Universe is 4.5%. This contribution is 12 times higher than that which is contained in optically selected catalogs of galaxies which do not contain LSB galaxies (Shull shull03 (2003); Bothun bothun03 (2003)) which either means that a) we are missing most of the galaxy population in our current catalogs, or b) 95% of the baryonic content of the Universe is in the (presumably warm) IGM. At present, the needed baryons in the warm IGM (alternative b) remain undetected. Moreover, the best fitting 6-parameter WMAP model contains a curious result – the global ratio of baryonic energy density to dark matter energy density is 0.19. This is two times larger than the baryonic mass fraction that is typically found in disk galaxies from analysis of rotation curves and clearly implies the existence of undetected baryons. It is possible that the undetected population is LSB galaxies.
It has been repeatedly shown that the question of how much a galaxy type contributes to the baryon (and matter) density in the Universe is twofold – what is the number density of massive galaxies of that type, and what is the slope of the low mass luminosity/baryon density function. Whereas numerous surveys are (and have been) undertaken to address the latter question (e.g. Sabatini et al. sabatini03 (2003), Mobasher et al. mobasher03 (2003)), here we aim to look into the former. In a nutshell, we would like to examine the questions “How many massive LSB disk galaxies are in the z 0.1 Universe, and what are their properties?”
To shed light on these questions, we have re-investigated one of the first surveys designed to measure the space density of LSB galaxies. Bothun et al. (bothun85 (1985)) measured H I masses and redshifts for a well-defined sample of LSB galaxies chosen from the UGC (Nilson nilson73 (1973)). While that survey was reasonably successful, there were a significant number of 21-cm non-detections which indicated the presence of either a gas poor population of LSB disks or large LSB disks beyond the redshift sensitivity limit of the survey (about 12,000 km s-1). The primary impetus behind our re-investigation, then, was the upgrade of the 305m Arecibo telescope. With its improved sensitivity, baselines, and spectrometer, the Arecibo telescope is able to cover a much larger region of velocity space with higher sensitivity than has previously been achievable at 21-cm. Consequently, we chose re-examine Bothun et al.’s original H i catalog, compiling all objects with published H i properties (both those detected in the original catalogs and those which were not) and re-observing the objects which were originally not detected. The end result is a well-defined catalog of H i properties of 526 LSB galaxies ranging in redshift space from . With this catalog in hand, we are more fully able to explore the parameter space occupied by LSB galaxies.
2 Catalog selection
The objects chosen for observation were taken from the sample of LSB galaxies selected from the UGC by Bothun et al. (bothun85 (1985)), which meet the following criteria:
-
•
Morphological type (as given in UGC) of Sb or later;
-
•
Blue surface brightness of mag arcsec-2 (where mpg is the photographic magnitude from the UGC, is the diameter in arcmin, 8.89 is the conversion from arcmin to arcsec, and 0.26 is an average conversion from mpg to mB.) This definition, used by Bothun et al. (bothun85 (1985)), is typically equivalent to the more commonly used classification of a galaxy as LSB if it has 23.0 mag arcsec-2, although the uncertainty of this equation, combined with the high error of the UGC magnitudes (0.5) means this catalog may contain objects with central surface brightnesses as high as = 22 mag arcsec-2.
-
•
Declination in the range 0∘–36∘.
A total of 1865 galaxies meet the above criteria. Of these, 571 were randomly selected and observed by Bothun et al. (bothun85 (1985)) with 334 being detected (and later confirmed) in H i. In the intervening years, 107 of the galaxies not originally detected by Bothun et al. have had their H i properties published in the literature. The remaining 130 objects break down as follows:
-
•
4 galaxies were rejected from the catalog due to being part of an interacting group (UGC 3737, UGC 11564, UGC 11027, and UGC 11057);
-
•
15 of the objects listed as detections by Bothun et al. (bothun85 (1985)) were not confirmed by follow-up observations and are considered non-detections for this paper;
-
•
86 galaxies from the original list were observed for this paper;
-
•
The remaining 25 galaxies, all of which were listed as non-detections by Bothun et al. (bothun85 (1985)) were not observed for this paper (due to scheduling restrictions), and have had no other follow-up H i observations.
To compensate for the ‘missing’ galaxies, an additional 24 galaxies, randomly chosen from the original catalog of 1865 objects, were observed. Additionally, 6 LSB galaxies from the catalog of O’Neil et al. (oneil97 (1997)) which fit into the scheduled observing time on the Arecibo telescope were also observed. The final result is a catalog of 561 H i observations of LSB galaxies, 116 of which are new observations. A complete list of the 116 newly observed galaxies and their optical properties is given in Table 1 & 2. The H i and optical properties of all other galaxies, both those originally detected by Bothun et al. (bothun85 (1985)) and those later detected in the literature, can be found on-line at http://www.gb.nrao.edu/koneil/data.
3 Observations
For efficiency, observations were made using both the Arecibo 305m and the 100-m class Nançay radio telescopes. Details of observations with the individual telescopes are given below, published properties of the galaxies are given in Table 1, and a complete listing of the observations is given in Table 2.
3.1 Arecibo Observations
Observations with the Arecibo 305m telescope were taken between 16 May, 1999 – 02 April, 2002. Data was taken using the L-wide and L-narrow receivers and two separate polarization channels. Two different correlator set-ups were used – one for galaxies with published velocities and one for galaxies whose velocity was unpublished at the time of the observations. The objects without published velocity were observed using four 50MHz band passes with 2048 lags and 3-level sampling, giving an unsmoothed resolution of 5.2 km/s at 1420 MHz. The frequency range covered for these observations was either 1270 – 1425MHz or 1238 – 1423MHz. (Two different frequency ranges were used due to the increasingly frequent presence of a strong radar at 1240 – 1260 MHz.) In both cases sufficient overlap was given to the individual correlator boards to effectively eliminate any problems which otherwise may have arisen due to poor performance in the outer 50 channels of each correlator.
If an observed galaxy already had a published velocity, only two correlator boards were used. In this case each board was centered at the galaxy’s redshifted H i line, recorded a separate polarization channel, and had a total of 2048 lags across its 12.5 MHz band. Here, all the data had 9-level sampling.
All Arecibo data was observed in position-switched mode, with a minimum of one 10 minute on- and off-source observation pair taken of each galaxy, followed by a 20 second ON/OFF observation of a calibrated noise diode. In most cases a galaxy was observed at least twice using this method, and often as many as 4–6 times. System temperatures were obtained from the noise diode observations, using the predetermined temperature values from Arecibo (available on-line at http://www.naic.edu). A gain curve for the telescope was obtained through reducing all observations taken of standard continuum calibrators, by any project, during the observing period. A complete description of the procedures used to determine the gain curve in this manner can be found in Heiles (heiles01 (2001)). Additionally, observations were made of standard continuum calibrators every 2-3 hours during the project observations, with the results checked against the determined telescope gain, to insure no anomalous behavior occurred in the hardware during observations. As a result we can confidently state that the calibration corrections are good to within 10% (and often much better). A thorough discussion of the errors involved can be found in O’Neil (oneil04 (2004)).


3.2 Nançay Observations
| Galaxy | † | ‡ | † | Type† | i† |
| UGC 00126 | 15.7 | 24.5 | 1.1 | S | 26 |
| UGC 00134 | 17 | 25.6 | 1 | SIV-V | 0 |
| UGC 00189 | 17 | 26.0 | 1.2 | … | 43 |
| UGC 00266 | 16 | 24.8 | 1.1 | S? | 50 |
| UGC 00293 | 17 | 25.8 | 1.1 | … | 71 |
| UGC 00424 | 18 | 26.6 | 1 | … | 0 |
| UGC 00667 | 17 | 26.0 | 1.2 | … | 50 |
| UGC 00795 | 16.5 | 25.1 | 1 | Sb 0 | |
| UGC 01122 | 17 | 25.8 | 1.1 | Sc | 35 |
| UGC 01362 | 18 | 25.6 | 1 | Dwrf Sp | 0 |
| UGC 02299 | 17 | 25.6 | 1 | SA(s)dm | 27 |
| UGC 02580 | 18 | 26.6 | 1 | Pec | 0 |
| UGC 02588 | 17 | 25.6 | 1 | Irr | 0 |
| UGC 02641 | 17 | 26.0 | 1.2 | Sdm | 65 |
| UGC 02671 | 17 | 26.0 | 1.2 | SAB(s)d | 0 |
| UGC 02741 | 16.5 | 25.7 | 1.3 | S? | 0 |
| UGC 02796 | 16.5 | 26.0 | 1.5 | Sbc | 73 |
| UGC 02797 | 16 | 25.0 | 1.2 | … | 41 |
| UGC 02856 | 17 | 25.6 | 1 | Sb | 71 |
| UGC 03119 | 16.5 | 25.5 | 1.2 | Sbc | 69 |
| UGC 03225 | 16.5 | 25.3 | 1.1 | S | 63 |
| UGC 03308 | 16.5 | 25.1 | 1 | Sc | 0 |
| UGC 03585 | 14.7 | 23.3 | 1.0 | Sc | 35 |
| UGC 03710 | 15.6 | 24.8 | 1.3 | … | … |
| UGC 03790 | … | … | 0.8 | SB? | 67 |
| UGC 04109 | 14.5 | 23.3 | 1.1 | SB(r)b | 24 |
| UGC 04131 | 15.7 | 25.1 | 1.4 | SBc | 50 |
| UGC 04144 | 15.6 | 24.4 | 1.1 | Sc | 83 |
| UGC 04288 | 17 | 25.6 | 1 | S0 | 37 |
| UGC 04496 | 15.7 | 25.8 | 2.0 | Sc | 84 |
| UGC 04831 | 15.0 | 23.6 | 1.0 | SABd | 0 |
| UGC 05009 | 14.8 | 23.6 | 1.1 | Scd | 35 |
| UGC 05211 | 15.5 | 24.1 | 1.0 | … | 0 |
| UGC 05361 | 16 | 24.6 | 1 | … | 0 |
| UGC 05440 | 16.5 | 25.7 | 1.3 | Sd | 65 |
| UGC 05583 | 16 | 24.6 | 1 | Sb | 78 |
| UGC 05592 | 15.7 | 24.5 | 1.1 | Sc | 43 |
| UGC 05679 | 15.4 | 25.2 | 1.7 | S | 69 |
| UGC 05710 | 16 | 25.9 | 1.8 | S | 74 |
| UGC 05743 | 16 | 24.8 | 1.1 | Sc | 71 |
| UGC 05769 | 15.4 | 24.2 | 1.1 | … | 25 |
| UGC 05770 | 15.4 | 24.0 | 1.0 | … | 0 |
| UGC 05785 | 15.4 | 23.3 | 0.7 | S? | 60 |
| UGC 05790 | 15.6 | 24.6 | 1.2 | S? | 24 |
| UGC 05801 | 15.7 | 24.5 | 1.1 | … | 0 |
| UGC 05828-1 | 15.7 | 24.5 | 1.1 | Sc | 0 |
| UGC 05828-2 | 14.7 | 23.1 | 0.9 | S? | 80 |
| UGC 05930 | 16.8 | 20.4 | 0.1 | S? | 66 |
| UGC 06031 | 15.7 | 24.5 | 1.1 | S | 0 |
| UGC 06124 | 16.5 | 26.0 | 1.5 | S | 82 |
| UGC 06243 | 16 | 24.6 | 1 | Sc | 46 |
| UGC 06300 | 15.7 | 24.7 | 1.2 | E | 54 |
| UGC 06401 | 14.8 | 23.2 | 0.9 | Scd? | 0 |
| UGC 06425 | 15.4 | 24.6 | 1.3 | Sb | 23 |
| UGC 06524 | 11.6 | 24.8 | 8.1 | SB | 63 |
| UGC 06525-1 | 16.9 | 22.9 | 0.3 | S? | 60 |
| UGC 06525-2 | 16.0 | 22.6 | 0.4 | S? | 73 |
| Galaxy | † | ‡ | † | Type† | i† |
| UGC 06557 | 16 | 24.6 | 1 | Pec | 26 |
| UGC 06559 | 15.7 | 25.4 | 1.7 | Sc | 86 |
| UGC 06748 | 16 | 24.6 | 1 | S | 37 |
| UGC 06842 | 16.5 | 25.5 | 1.2 | S | 41 |
| UGC 06897 | 16 | 25.0 | 1.2 | SBc | 65 |
| UGC 06913 | 15.3 | 25.0 | 1.6 | Sb | 60 |
| UGC 06947 | 16.5 | 25.1 | 1 | Sc | 84 |
| UGC 07084 | 14.9 | 24.6 | 1.6 | S | 51 |
| UGC 07369 | 14.7 | 23.3 | 1.0 | E | 0 |
| UGC 07388 | 16 | 24.6 | 1 | SB | 37 |
| UGC 07425 | 16.5 | 25.5 | 1.2 | Sd | 34 |
| UGC 07437 | 16 | 24.8 | 1.1 | SBc | 60 |
| UGC 07438 | 16 | 25.5 | 1.5 | Sdm | 75 |
| UGC 07457 | 16 | 25.0 | 1.2 | S | 65 |
| UGC 07598 | 15.6 | 25.1 | 1.5 | SBc | 0 |
| UGC 07630 | 16.5 | 26.0 | 1.5 | Dwrf Ir | 48 |
| UGC 07770 | 16.5 | 25.3 | 1.1 | Sc | 84 |
| UGC 07928 | 14.4 | 23.0 | 1.0 | Sab | 48 |
| UGC 07929 | 17 | 25.6 | 1 | Dwarf | 46 |
| UGC 07934 | 16 | 25.0 | 1.2 | S | 60 |
| UGC 08081 | 17 | 25.6 | 1 | Dwarf | 72 |
| UGC 08171 | 15.3 | 23.7 | 0.9 | Sd | 26 |
| UGC 08311 | 15.2 | 23.3 | 0.8 | S? | 37 |
| UGC 08637 | 14.4 | 23.2 | 1.1 | SA(s)d | 0 |
| UGC 08644 | 16 | 24.8 | 1.1 | Sdm | 25 |
| UGC 08762 | 17 | 26.8 | 1.7 | SB(s)d | 50 |
| UGC 08799 | 16.5 | 25.7 | 1.3 | Im? | 48 |
| UGC 08802 | 17 | 26.2 | 1.3 | Sc | 63 |
| UGC 08904 | 16 | 25.9 | 1.8 | … | 44 |
| UGC 09008 | 14.6 | 23.2 | 1.0 | SAd | 0 |
| UGC 09010 | 15.1 | 23.5 | 0.9 | Sd | 37 |
| UGC 09238 | 16 | 25.2 | 1.3 | Sc | 67 |
| UGC 09243 | 15.6 | 25.1 | 1.5 | Sc | 58 |
| UGC 09513 | 15.4 | 24.2 | 1.1 | … | 35 |
| UGC 09676 | 15.7 | 24.5 | 1.1 | SBc | 43 |
| UGC 09680 | 16.5 | 25.7 | 1.3 | Scd | 81 |
| UGC 09767 | 14.2 | 22.8 | 1.0 | BCG | 26 |
| UGC 09770 | 14.9 | 23.7 | 1.1 | SABb | 43 |
| UGC 10217 | 16.0 | 24.6 | 1.0 | SBb | 36 |
| UGC 10365 | 16.0 | 24.6 | 1.0 | S | 73 |
| UGC 10377 | 17 | 26.4 | 1.4 | Pec? | 69 |
| UGC 10673 | 16 | 25.7 | 1.6 | … | 64 |
| UGC 10674-1 | 15.5 | 25.3 | 1.7 | S | 79 |
| UGC 10674-2 | 15.5 | 25.3 | 1.7 | S | 79 |
| UGC 11396 | 17 | 25.6 | 1 | … | 60 |
| UGC 11569 | 16 | 24.8 | 1.1 | Sc | 51 |
| UGC 11625 | 16.5 | 25.5 | 1.2 | S | 24 |
| UGC 11654 | 16.5 | 25.1 | 1 | Pec | 60 |
| UGC 11694 | 15.2 | 25.1 | 1.8 | … | 52 |
| UGC 11742 | 16.5 | 25.5 | 1.2 | S | 0 |
| UGC 11840 | 17 | 25.4 | 0.9 | S? | 27 |
| UGC 12021 | 15.0 | 24.0 | 1.2 | Sb | 65 |
| UGC 12189 | 16.0 | 24.4 | 0.9 | SB? | 48 |
| UGC 12359 | 16.5 | 26.0 | 1.5 | S? | 21 |
| UGC 12424 | 15.2 | 24.0 | 1.1 | S | 35 |
| [OBC97] P06-6 | 18.4 | 23.9 | 0.3 | S | 33 |
| [OBC97] N02-2 | 17.0 | 22.4 | 1.0 | S | 69 |
| Galaxy | † | ‡ | † | Type† | i† |
| [OBC97] N02-3 | 18.2 | 22.2 | 0.4 | S | 27 |
| [OBC97] N10-2 | 16.6 | 22.3 | 0.5 | S | 64 |
| [OBC97] A01-1 | 17.9 | 23.1 | 0.6 | S | 47 |
| †From the UGC (Nilson 1973). | |||||
| ‡Surface brightness () is | |||||
| ; where is the photographic magnitude | |||||
| from the UGC, D is the diameter in arcmin, 8.89 is the | |||||
| conversion from arcmin to arcsec, and 0.26 is an average | |||||
| conversion from mpg to mB. | |||||
The Nançay decimetric radio telescope, a meridian transit-type instrument of the Kraus/Ohio State design, consists of a fixed spherical mirror (300 m long and 35 m high), a tilt-able flat mirror (20040 m), and a focal carriage moving along a curved rail track. Sources on the celestial equator can be tracked for approximately 60 minutes. The telescope’s collecting area is about 7000 m2 (equivalent to a 94-m diameter parabolic dish). Due to the E-W elongated shape of the mirrors, some of the instrument’s characteristics depend on the declination at which one observes. At 21-cm wavelength the telescope’s half-power beam width (HPBW) is in right ascension, independent of declination, while in the north-south direction it is 23′ for declinations up to 20∘, rising to 25′ at = 40∘ (see also Matthews & van Driel matthews00 (2000)). Although the instrument’s effective collecting area and, consequently, its gain, follow the same geometric effect, decreasing correspondingly with declination, this effect is negligible for the declination range of the objects in our sample. All observations for our project were made after a major renovation of the instrument’s focal system (e.g., van Driel et al. vandriel97 (1997)) which resulted in a typical system temperature of 35 K.
The observations were made in the period of January – December 2002. using a total of 59 hours of telescope time. We obtained our observations in total power (position-switching) mode using consecutive pairs of 40 seconds on and 40 seconds off-source integrations. Off-source integrations were taken at a position about 20′ E of the target position.
Only galaxies with published redshifts were observed at Nançay. For all observations the autocorrelator was divided into 1 pair of cross-polarized receiver banks, each with 4096 channels and a 25 MHz bandpass, resulting in a channel spacing of 1.3 km s-1. The center frequencies of the 2 banks were tuned to the redshifted H i line frequency of the target source. These spectra were boxcar smoothed to a channel separation of 17.1 km s-1 during the data reduction in order to increase signal-to-noise.
Flux calibration, i.e., the conversion of observed system temperatures to flux densities in mJy, is determined for the Nançay telescope through regular measurements of a cold load calibrator and periodic monitoring of strong continuum sources by the Nançay staff. Standard calibration procedures include correction for the above mentioned declination-dependent gain variations of the telescope (e.g., Fouqué et al. fouque90 (1990)). Additionally, a number of standard calibrator galaxies were observed throughout our observing runs, showing the gain used to be within 10%.
In order to reduce the effect of radio frequency interference (RFI) in our observations, we used an off-line RFI mitigation program, which is part of the standard NAPS software package, see Monnier Ragaigne et al. (2003) for further details. It should be noted, however, that not all unwanted emissions could be elimination using this method and that residual signals frequently occur around 4700, 8300, 9500, 11300, 12700 and 13600 km s-1 (Monnier-Ragaigne et al. monnier03 (2003)).
4 Observational results
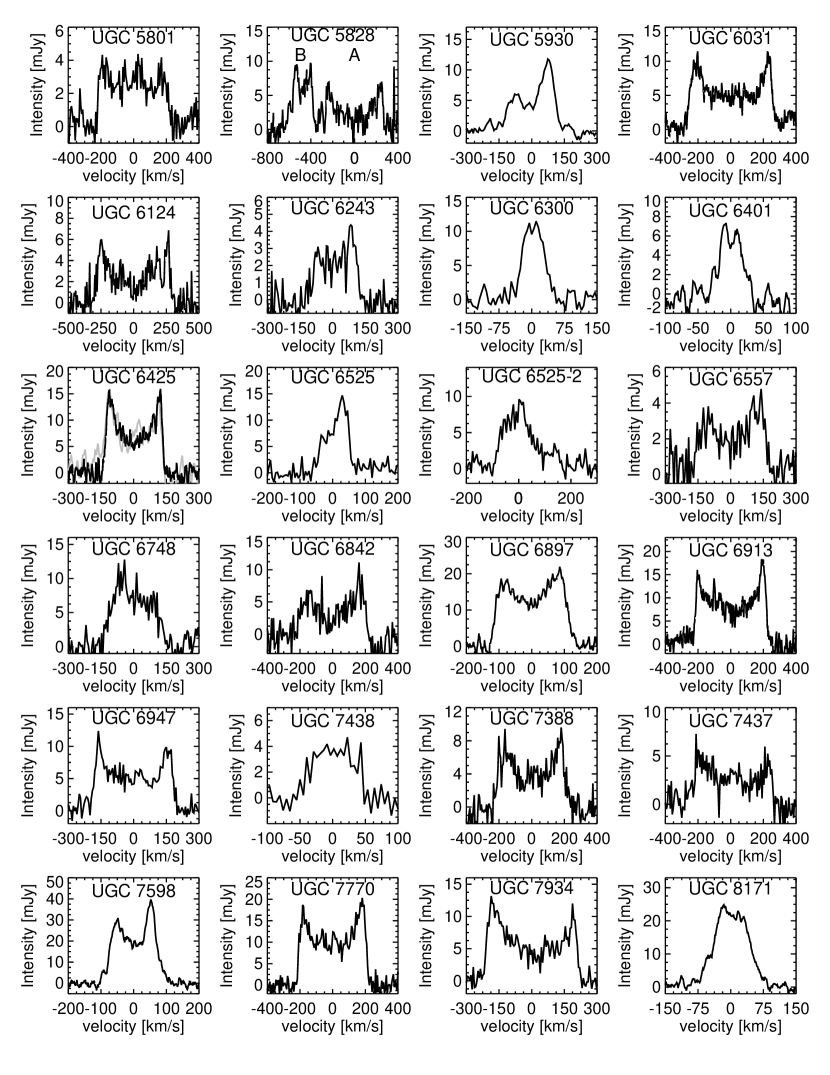
Results of the Arecibo and Nançay observations are given in Tables 2 and 3 and the spectra of all detected galaxies are given in Figures 1 and Figures 2. Notes on the individual galaxies can be found in Appendix A.
Table 2 lists all galaxies observed, as well as the search range, resolution, telescope used, RFI encountered, and the r.m.s. of the RFI-free regions of the spectra. Table 3 lists all observed galaxies which were detected in H i. Table 3 is laid out as follows:
-
•
Column 1: The galaxy name;
-
•
Column 2: The heliocentric velocity as measured by our observations;
-
•
Column 3 & 4: The uncorrected velocity widths at 20% and 50% of the peak or average height of the two peaks (when applicable);
-
•
Column 5: The total measured H i line flux of the galaxy;
-
•
Column 6: The total H i mass of the galaxy, assuming H0=75 km s-1 Mpc-1 and obtained using the standard formula ;
-
•
Column 7: All previously measured velocities of the galaxy, as found in the literature;
-
•
Column 8: Any notes on the observation regarding potential confusion with other sources. Notes are given in Appendix A.
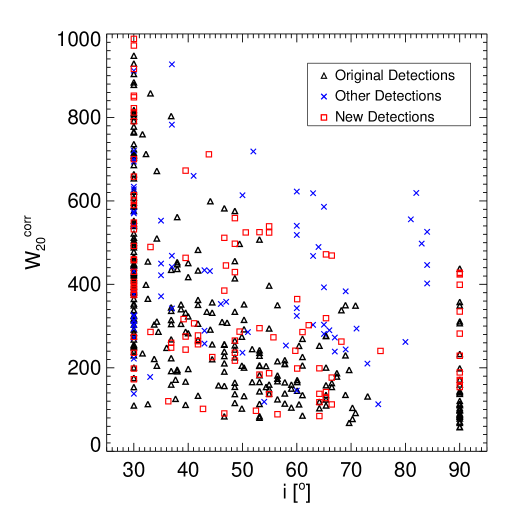
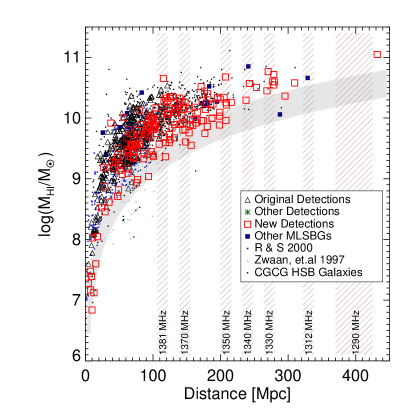
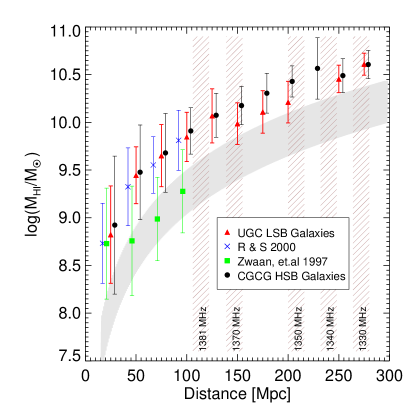
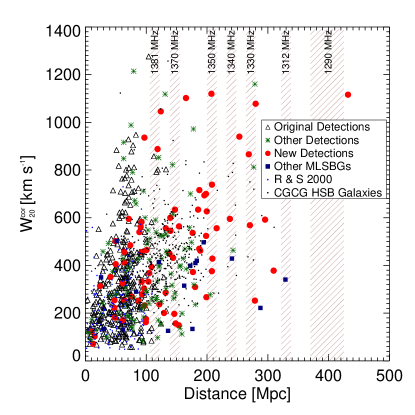
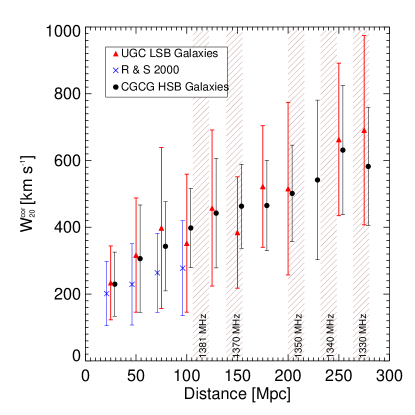
Figures 10 and 11 show the distribution of the H i mass and corrected H i line width for the objects in the survey against distance. For comparison, the plots also included all other massive LSB galaxies found in the literature, as well as three other Arecibo H i surveys – the ’blind’ H i surveys of Zwaan et. al (zwaan97 (1997)) and Rosenberg & Schneider (rosenberg00 (2000)), and a similar survey to look for high surface brightness CGCG galaxies done by Giovanelli & Haynes(giov93 (1993)).
5 H i and Stars in LSB Galaxies
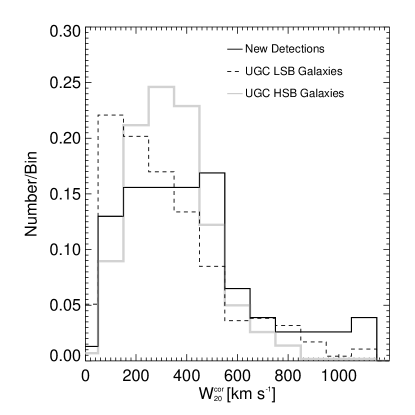
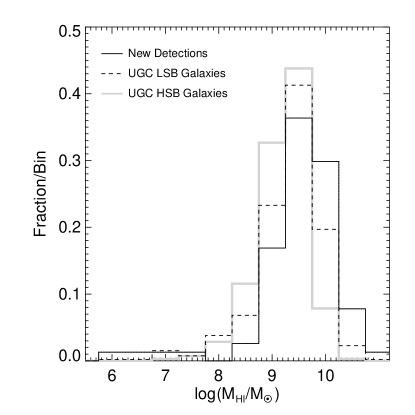
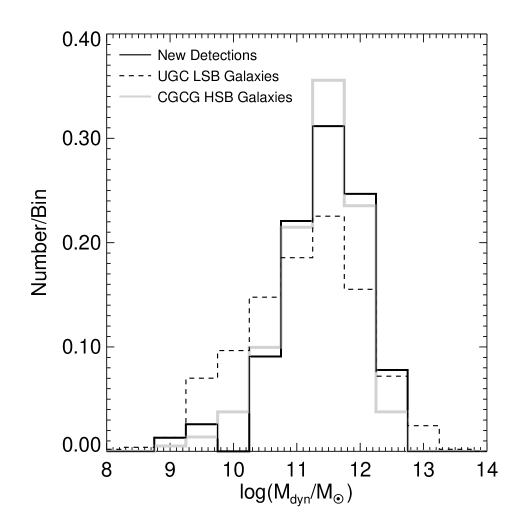
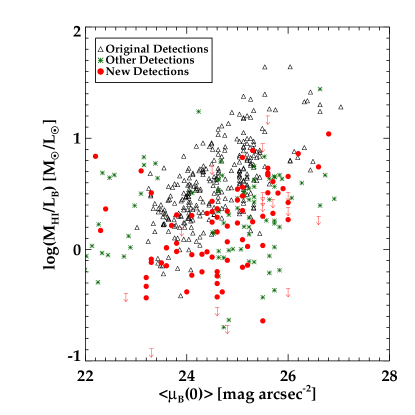
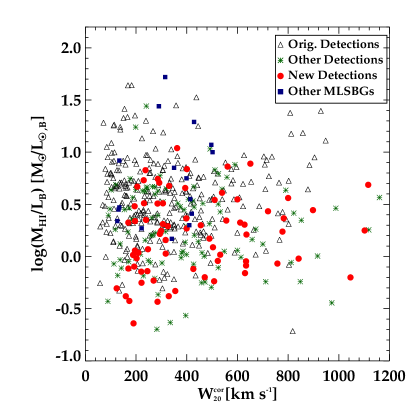
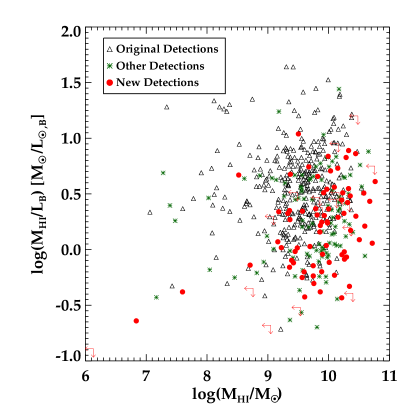
Figures 3 – 9 show the distribution of the H i and optical properties of the galaxies in the Bothun et al. (bothun85 (1985)) catalog for which we have new measurements. From these figures it is clear that the dynamic range of physical properties of LSB disks is large. That is, the UGC LSB galaxy catalog described herein has objects with H i masses ranging from , observed velocity widths of km s-1 (), and H i mass-to-luminosity ratio within the range M⊙/L⊙,B. Thus, we have a catalog of LSB disk galaxies which range from dwarf through massive galaxies, and include objects which are both gas-rich and gas-poor.
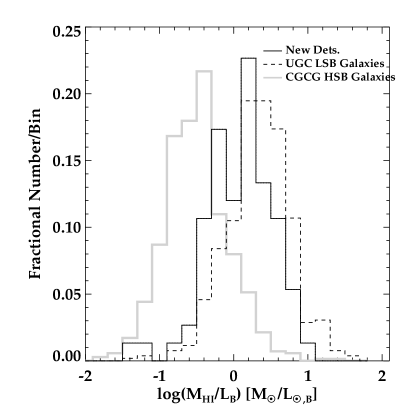
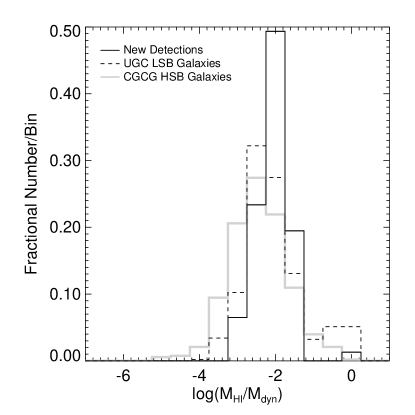
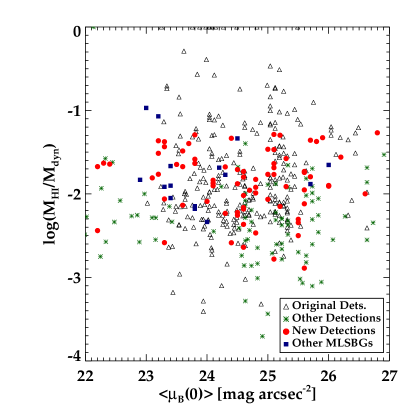
Examining Figures 3 – 6 it is clear that while our UGC LSB galaxy sample has similar gas and dynamical masses to that found with HSB galaxies, the MHI/LB ratios in the LSB galaxies of this survey are much higher than in typical HSB galaxies. More specifically, the median H i mass of the galaxies in this survey is M⊙, close to the median of 3 M⊙ found in a similar survey of HSB galaxies from the Catalog of Galaxies and Clusters of Galaxies (CGCG) (Zwicky et al. zwicky61 (1961)) done by Giovanelli & Haynes (giov93 (1993)). The dynamical masses are also similar, with . Yet the range of mass-to-luminosity ratios for the two samples of galaxies is quite different. The median value for the LSB galaxies is 2.8 M⊙/L⊙,B while = 0.4 M⊙/L⊙,B. The gas-to-dynamical mass ratio shows a similar, albeit smaller, trend with .
The higher H i mass-to-luminosity ratios (MHI/LB) found for the LSB galaxies may be a strong indicator that the LSB systems have evolved differently from their HSB counterparts. This idea is by no means a new one – that LSB galaxies in general have high H i mass-to-luminosity ratios is well established. In romanishin82 (1982), Romanishin et al. first reported that galaxies of lower surface brightness have values approximately 2.4 times higher than for similar HSB samples. This trend has continued for all H i studies undertaken of these diffuse systems (e.g. de Blok et al. deblok96 (1996); O’Neil et al. oneil00 (2000); Schombert et al. schombert01 (2001); Burkholder et al. burkholder01 (2001)) indicating that LSB galaxies are less evolved, less efficient in their star formation, or have otherwise undergone a different evolutionary scenario then their HSB counterparts (see, e.g., the modeling by Boissier et al. boissier03 (2003)).
However, this brings us to a logical paradox that was first explored by de Blok and McGaugh (deblok98 (1998)). Our calculations of dynamical mass (e.g. ) use the tabulated UGC diameter as the basis for calculating R. In general this diameter corresponds to an isophotal limit of 25 mag arcsec-2 (Cornell, et.al cornell87 (1987)). For a typical HSB galaxies with (0) = 21.5, this isophotal radius corresponds to 3 optical disk scale lengths. However, for a typical LSB galaxy with (0) = 23.5, this isophotal radius is only 1-2 scale lengths. This means that for given values of circular velocity, redshift, and apparent diameter, an LSB will have a dynamical mass which is systematically underestimated compared to that of an HSB galaxy. We estimate that this error could be as high as a factor of two or more. Therefore, if a constant number of scale lengths were used in the determination of the radius, the fractional H i content of LSB disks would actually be lower than that of HSB disks. This is another way of saying that LSB disks must have a lower baryonic mass fraction than HSB disks. Similar conclusions, based on mass modeling of LSB galaxies with rotation curves, have been reached by McGaugh & de Blok (mcgaugh98 (1998)) and Pickering et al. (pickering99 (1999)). This lower baryonic mass fraction could result in different star formation histories between LSB and HSB disks.
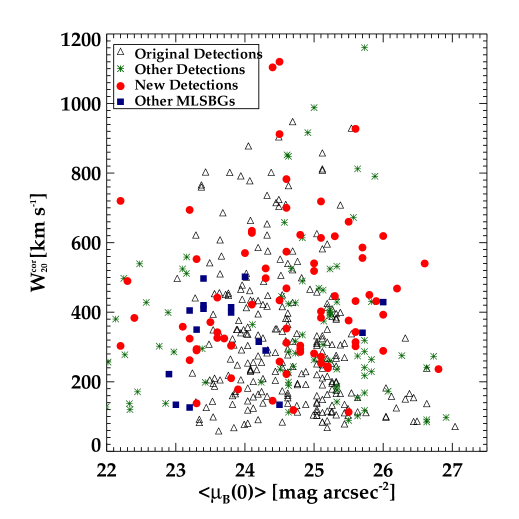
Indeed, Figure 8(a) shows a curious correlation between and , similar to that found by, e.g. Burkholder et al. (burkholder01 (2001)) – an increasing H i mass-to-luminosity ratio with decreasing surface brightness. Although there is a large scatter, the trend seen in this figure is significant. In particular, the mean value of for = 23.0, 24.0 and 25.0 is 0.24, 0.37, and 0.55, respectively. To first order, these trends are physically reasonable. For instance, a purely gaseous disk sitting in some dark matter potential will have very low optical surface brightness and a very high gas to star ratio. However, that simplistic scenario would also predict a correlation between fractional gas content and surface brightness. That is, as star formation begins to consume the gas and thus elevate the surface brightness of the disk, the fractional H I content of the potential would diminish. One should then observe the lowest values of corresponding to the highest values of . However, this is clearly not seen as these two parameters are essentially uncorrelated (Figure 8b).
Thus, while the average gas-to-light ratio of galaxies appears to increase considerably with decreasing surface brightness, the average gas-to-total mass ratio does not show any increase. Indeed, if the dynamical masses of the lower surface brightness galaxies are underestimated, as discussed above, using accurate measurements of Mdyn could result in the inverse – a decrease of with . If the only factor causing the correlation were a slower or less efficient evolution of LSB systems, the correlation should be equally evident between and both and . As this is not the case, additional possibilities for reducing the luminosity of a galaxy with surface brightness while keeping the gas-to-total mass ratio the same must be considered. This is where the physical meaning of surface brightness comes into play, as surface brightness is the convolution of the mean (blue) luminosity of the stellar population and the average separation between the stars. One explanation of these trends is that the process of star formation in LSB disks is sufficiently different than that seen in HSB disks so as to reduce the natural coupling between increased blue luminosity and increased blue surface brightness. This can be accomplished (as has been suggested earlier by O’Neil et al. oneil00 (2000) and Bothun et al. bothun97 (1997)) if star formation in LSB disks occurs in a lower density gas environment which produces a larger than average separation between newly formed stars.
6 Conclusions & Discussion
Our survey, undertaken with both the Arecibo and Nançay radio telescopes, has resulted in the determination of H I properties and redshifts for 81 UGC LSB galaxies, 38 of which can be classified as massive ‘Malin 1 cousins’. This has increased the number of known massive LSB galaxies by a factor of 3. Combining our results with all previous 21-cm observations of the Bothun et al. (bothun85 (1985)) UGC LSB galaxy list results in a final catalog of 526 LSB galaxies, with properties ranging across the known gamut of disk system properties, including numerous extremely gas-rich galaxies with M 10 M⊙/L⊙,B. Comparing the properties of these galaxies with those found in similar H i surveys of HSB galaxies surveys shows the curious fact that while the mean MHI/LB value increases with decreasing surface brightness, the MHI/Mdyn ratio does not. This raises the (currently unanswered) question of whether or not star formation is significantly affected by the low density environment found within LSB galaxies.
With this catalog in hand, we can now ask the question – What do we gain by continuing to look for and study massive LSB systems? The answer to this question is (at least) threefold.
First, as massive LSB galaxies are significant repositories of baryonic (and dark) matter (Pickering et al. 1997, 1999; Walsh et al. walsh97 (1997); Pickering et al. pickering97 (1997)), determining both the number density and distribution of these objects could provide considerable insight into the overall distribution of matter in the Universe. While the survey described herein cannot determine the number density of massive LSB galaxies, it does show that there are more of these objects in the Universe than previously known, and determining the density and distribution of these massive objects will allow for a better understanding of the cosmological distribution of mass throughout the universe.
In this respect, it is vital here to point out the effect surveys such as this one have on determining the LSB galaxy contribution to baryon density. Because of their perceived morphology on photographic plates lacking the sensitivity to show their outer disks, and their previous lack of detection in H I, all of the massive LSB galaxies detected in our catalog were previously believed to be dwarf systems with little to no H I mass. As a result, our detections are not merely adding a few massive LSB galaxies to the number counts, but moving galaxies from being listed as extremely low mass to extremely high mass systems, and thus shifting the distribution of masses in the luminosity function.
Second, and equally important, massive LSB galaxies provide a unique insight into galaxy evolution studies as a whole. Because massive LSB galaxies reside at an extreme end of the mass and density distribution of galaxies, any model that wishes to describe galaxy evolution must be able to account for them. And, as massive LSB galaxies appear to be undeveloped in at least some aspects, when compared to HSB galaxies (e.g., their higher than average MHI/LB ratios and often sparse H- emission – Pickering et al. pickering97 (1997)), studies of massive LSB galaxies, and of LSB galaxies in general, offer a look into a different aspect of galaxy formation than those of HSB galaxies.
Third, it has been shown that if LSB galaxies are as common as HSB galaxies, then they may be one of the primary causes for Lyman- absorbers in the local Universe (Linder 1998, 2000). As a result, knowing the density of massive LSB galaxies could lead to a allow for considerably better understanding of the nature of Lyman- absorption lines. This would allow us to construct a more complete picture of the large-scale gas distribution in the Universe, as well as providing insight into galaxy formation processes.
At this point it is clear that we do not yet have an answer regarding the number density of massive LSB galaxies, as the blind surveys done to date (both optical, near-infrared and H i) have not yet probed to sufficient sensitivity to allow this question to be answered. Clearly there is a dearth of such objects in the z0.01 Universe, just as there is a shortage of all massive galaxies in that region. What is significant, though, is that as increasingly sensitive instruments become available, the number of LSB and massive LSB galaxies known continues to increase. (Notably, in a survey similar to ours, Schwortz et al. (schwortz04 (2004)) found another 9 massive LSB galaxies.) However, as the nature of pointed surveys such as the one described herein prevents them from providing an unbiased view into the number density of various galaxy types, we can only use these surveys to get a glimpse into what may be out there. The true number density of massive LSB galaxies will likely not be known until an extremely sensitive, large scale survey is undertaken, such as may be possible with the Arecibo L-band Feed Array (ALFA) or, ultimately, the Square Kilometre Array (SKA).
Acknowledgements.
The Arecibo Observatory is part of the National Astronomy and Ionosphere Center, which is operated by Cornell University under a cooperative agreement with the National Science Foundation. The Nançay radio astronomy station, which is the Unité Scientifique de Nançay of the Observatoire de Paris, is associated with the French Centre National de Recherche Scientifique (CNRS) as USR B704, and acknowledges the financial support of the Région Centre as well as of the European Union. This research has made use of the Lyon-Meudon Extragalactic Database (LEDA), recently incorporated in HyperLeda, and of the NASA/IPAC Extragalactic Database (NED) which is operated by the Jet Propulsion Laboratory, California Institute of Technology, under contract with the National Aeronautics and Space Administration.References
- (1) Bell, E., McIntosh, D., Katz, N., & Weinberg, M. 2003, ApJS, 149, 289
- (2) Bell, E., Barnaby, D., Bower, R. G., et al. 2000, MNRAS, 312, 470
- (3) Bell, E., Bower, R., de Jong, R., Hereld, M., & Rauscher, B. 1999, MNRAS, 30, L55
- (4) Bergmann, M.,; Jørgensen, I., &; Hill, G. 2003, AJ, 12, 116
- (5) Blanton, M., Hogg, D. W., Bahcall, N. A., et al. 2003, ApJ, 592, 819
- (6) Boissier, S., Monnier Ragaigne, D., Prantzos, N., et al. MNRAS, 343, 643
- (7) de Blok, W. J. G., & McGaugh, S. 1998, ApJ, 508, 132
- (8) de Blok, W. J. G., McGaugh, S., & van der Hulst, J. M. 1996, MNRAS, 283, 18
- (9) de Blok, W. J. G., van der Hulst, J. M., & Bothun, G. D. 1995, MNRAS, 274, 235
- (10) Bothun, G.D. 2003 in ASSL Conf. Proc. 281, The IGM/Galaxy Connection: The Distribution of Baryons at z=0, ed. J. Rosenburg & M. Putman , 11
- (11) Bothun, G. D., Impey, C., & McGaugh, S. 1997, PASP, 109, 745
- (12) Bothun, G. D., Beers, T. C., Mould, J. R., & Huchra, J. P. 1985, AJ, 90, 2487
- (13) Bottinelli, L., Gouguenheim, L., Fouqué, P., & Paturel, G. 1990, A&AS, 82, 391
- (14) Briggs, F. 1997, ApJ, 484, 618
- (15) Burkholder, V., Impey, C., & Sprayberry, D. 2001, AJ, 122, 2318
- (16) Cabanela, J. E., & Dickey, J. M. 2002, AJ, 124, 78
- (17) Colless, M., lis, R., Bland-Hawthorn, J., et al. 1999, in Looking Deep in the Southern Sky, ed. F. Morganti, & W. Couch, W. (Berlin: Springer-Verlag), 9
- (18) Cornell, M. E., Aaronson, M., Bothun, G., & Mould, J. 1987, ApJS 64, 507
- (19) Cross, N., Driver, S., Liske, J., et al. 2004, MNRAS, preprint
- (20) Cross, N., Driver, S. P., Couch, W., et al. 2001, MNRAS, 324, 825
- (21) Davies, J. I., Phillipps, S., & Disney, M. J. 1988, MNRAS, 231, 69
- (22) Dekel, A., & Woo, J. 2003, MNRAS, 344, 1311
- (23) Falco, E. E., Kurtz, M. J., Geller, M. J.et al. 1999, PASP, 111, 438
- (24) Fouqué, P., Durand, N., Bottinelli, L., Gouguenheim, L., & Paturel, G. 1990, A&AS 86, 473
- (25) Fukugita, M., Hogan, C. J., & Peebles, P. J. E. 1998, ApJ, 503, 518
- (26) Gerritsen, J., & de Blok, W. J. G. 1999, A&A, 342, 655
- (27) Giovanelli, R., Avera, E., & Karachentsev, I. 1997, AJ, 114, 122
- (28) Giovanelli, R., Haynes, M. P., da Costa, L. N., et al. 1997 ApJ 477, L1
- (29) Giovanelli, Riccardo & Haynes, Martha P. 1993 AJ 105, 1271
- (30) Heiles, C. 2001 Arecibo Technical and Operations Memo Series 2001-01 http://www.naic.edu/astro/aotms/performance.shtml
- (31) Huchra, J., Vogeley, M., & Geller, M. 1999, ApJS, 121, 287
- (32) Impey, C., & Bothun, G. 1997, ARA&A, 35, 267
- (33) Jimenez, R., Padoan, P., Matteucci, F., & Heavens, A. 1998, MNRAS, 299, 123
- (34) de Jong, R., & Lacey, C. 2000, ApJ, 545, 781
- (35) Kilborn, V.K., Webster, R. L., Staveley-Smith, L., et al. 2002, AJ, 124, 690
- (36) Knezek, P. 1999, PASA, 16, 60
- (37) Koribalski, B. S. 2002, in Seeing Through the Dust: The Detection of HI and the Exploration of the ISM in Galaxies ed. A. R. Taylor, T. L. Landecker, & A. G. Willis
- (38) Kraan-Korteweg, R.,, van Driel, W., Briggs, F., Binggeli, B., & Mostefaoi, T. 1999, A&AS, 135, 255
- (39) Linder, S. 2000, ApJ, 529, L644L
- (40) Linder, S. 1998, ApJ, 495, L637L
- (41) Markze, R., Huchra, J., & Geller, M. 1996, AJ, 112, 1803
- (42) Matthews, L. D., van Driel, W., & Monnier-Ragaigne, D. 2001, A&A, 365, 1
- (43) Matthews, L. D., & van Driel, W. 2000, A&AS, 143, 421
- (44) Mathewson, D., & Ford, V. 1996, ApJS, 107, 97
- (45) McGaugh, S. & de Blok, E. 1998, in ASP Conf. Ser. 136, Galactic Halos: A UC Santa Cruz Workshop, ed. D. Zaritsky,210
- (46) McGaugh, S. 1996 MNRAS 280, 337
- (47) Mobasher, B., Colless, M., Carter, D., et al. 2003, ApJ, 587, 605
- (48) Monnier Ragaigne, D., van Driel, W., Schneider, S. E., Balkowski, C., & Jarrett, T. H. 2003, A&A, 408, 465
- (49) Nilson, P. 1973, Uppsala General Catalogue of Galaxies, Uppsala Astron. Obs. Ann. 6 (UGC)
- (50) O’Neil, K. 2004, preprint
- (51) O’Neil, K., Andreon, S., & Cuillandre, J.-C. 2003, A&A, 399L, L35
- (52) O’Neil, K., Bothun, G., & Schombert, J. 2000, AJ, 119, 136
- (53) O’Neil, K., & Bothun, G. 2000, ApJ, 529, 811
- (54) O’Neil, K., Bothun, G., Schombert, J., Cornell, Mark E., & Impey, C.D. 1997, AJ, 114, 2448
- (55) Pickering, T. E., van Gorkom, J.H., Impey, C. & Quillen, A. 1999, AJ, 118, 765
- (56) Pickering, T. E., Impey, C., van Gorkom, J.H. & Bothun, G.D. 1997, AJ, 114, 1858
- (57) Romanishin, W., Krumm, N., Salpeter, E., et al. 1982, ApJ, 263, 94
- (58) Rosenberg, J. L., & Schneider, S. E. 2000, ApJS, 130, 177
- (59) Sabatini, S., Davies, J., Scaramella, R., et al. 2003, MNRAS, 341 981
- (60) Schwortz, A. C., Schneider, S. E., & van Driel, W. 2004, in preparation
- (61) Schombert, J., McGaugh, S., & Eder, J. 2001, AJ, 121, 2420
- (62) Shull, J.M. 2003, in ASSL Conf. Proc. 281, The IGM/Galaxy Connection: The Distribution of Baryons at z=0, ed. J. Rosenburg & M. Putman, 1
- (63) Sorar, E. 1994 Ph.D. Dissertation, Pittsburgh University
- (64) Spergel, D.N, Verde, L., Peiris, H. V., et al. 2003, ApJS, 148, 175
- (65) Sprayberry, D., Impey, C. D., Bothun, G. D., & Irwin, M. J. 1995, AJ, 10, 558
- (66) Schwartzenberg, J. M., Phillipps, S., Smith, R. M., Couch, W. J., & Boyle, B. J. 1995, MNRAS, 275, 121
- (67) Strauss, M., Weinberg, D. H., Lupton, R. H., et al. 2002, AJ, 124, 1810
- (68) van Driel, W., Gérard, E., & Pezzani, J. 1997, The FORT project: renovating the Nanccay radio telescope. In High Sensitivity Radio Astronomy, ed. N. Jackson & R.J. Davies (Cambridge:Cambridge Univ. Press), 229
- (69) Walsh, W., Staveley-Smith, L., & Osterloo, T. 1997, AJ, 113, 1851
- (70) Zwaan, M., Staveley-Smith, L., Koribalski, B. S., et al. 2003, AJ, 125, 2842
- (71) Zwaan, M., Briggs, F., Sprayberry, D., & Sorar, E. 1997, ApJ, 490, 173
- (72) Zwicky, F., Herzog, E., Wild, P., et al. 1961-1966, Catalogue of Galaxies and of Clusters of Galaxies, Publ. California Inst. of Technology, vols. 1-6
| Galaxy | RA | Dec | Search Range | resolution | Tel. | RFI † | |
|---|---|---|---|---|---|---|---|
| UGC 00126 | 00:13:44.7 | 14:36:25 | 31,745 – -970 | 0.42 | 26 | A | o,p,q,s |
| UGC 00134 | 00:14:04 | 12:53:46 | 3,297 – -1769 | 3.2 | 17 | N | … |
| UGC 00189 | 00:19:58 | 15:05:31 | 10,151 – 5,085 | 1.7 | 17 | N | … |
| UGC 00266 | 00:27:22.8 | 10:50:54 | 31,745 – -970 | 0.48 | 26 | A | o,q |
| UGC 00293 | 00:29:19.8 | 26:24:35 | 31,745 – -970 | 0.77 | 26 | A | o,p,q,s |
| UGC 00424 | 00:39:50.1 | 20:31:04 | 31,745 – -970 | 0.62 | 26 | A | h,o,p,q |
| UGC 00667 | 01:04:58 | 05:39:10 | 8,619 – 3,553 | 1.9 | 17 | N | … |
| UGC 00795 | 01:14:56.3 | 12:22:51 | 31,745 – -970 | 0.41 | 26 | A | o,p,q,s,t |
| UGC 01122 | 01:34:19.6 | 29:15:52 | 31,745 – -970 | 0.42 | 26 | A | h,o,q |
| UGC 01362 | 01:53:51 | 14:45:51 | 10,451 – 5,385 | 0.46 | 17 | N | … |
| UGC 02299 | 02:49:08 | 11:07:11 | 12,786 – 7,720 | 2.8 | 17 | N | … |
| UGC 02580 | 03:11:33.4 | 06:42:16 | 31,745 – -970 | 0.36 | 26 | A | h,o,p,q,s,t |
| UGC 02588 | 03:12:26.7 | 14:24:30 | 31,745 – -970 | 1.2 | 26 | A | h,j,k,l,m,o,q,t |
| UGC 02641 | 03:17:12.8 | 03:35:58 | 31,745 – -970 | 0.35 | 26 | A | h,o,p,q,r,s |
| UGC 02671 | 03:19:24 | 08:07:24 | 9,660 – 4,594 | 0.26 | 17 | N | … |
| UGC 02741 | 03:26:49 | 07:07:29 | 13,535 – 8,469 | 2.6 | 17 | N | … |
| UGC 02796 | 03:36:53 | 13:24:24 | 11,609 – 6,543 | 2.2 | 17 | N | … |
| UGC 02797 | 03:37:33.6 | 23:17:35 | 31,745 – -970 | 0.51 | 26 | A | h,o,p,q,r,s |
| UGC 02856 | 03:46:30 | 15:24:39 | 11,266 – 6,200 | 9.2 | 17 | N | … |
| UGC 03119 | 04:39:08 | 11:31:49 | 10,384 – 5,318 | 2.7 | 17 | N | … |
| UGC 03225 | 04:59:24.5 | 12:46:00 | 31,745 – -970 | 0.36 | 26 | A | o,p,q,s |
| UGC 03308 | 05:26:01.8 | 08:57:25 | 9,836 – 7,198 | 1.2 | 6.5 | A | … |
| UGC 03585 | 06:53:33.9 | 27:18:32 | 11,854 – 9,216 | 1.4 | 6.5 | A | … |
| UGC 03710 | 07:09:32.0 | 28:39:39 | 8,988 – 6,350 | 0.44 | 6.5 | A | … |
| UGC 03790 | 07:18:30.3 | 31:22:30 | 4,757 – 2,119 | 0.69 | 6.5 | A | … |
| UGC 04109 | 07:56:16.7 | 11:39:44 | 15,071 – 12,433 | 0.40 | 6.5 | A | … |
| UGC 04131 | 07:59:11.8 | 31:48:29 | 38,500 – -548 | 0.48 | 26 | A | a,b,d,f,g,i,k–o,q |
| UGC 04144 | 07:59:27.4 | 07:26:37 | 38,500 – -548 | 0.32 | 26 | A | a,b,d–h,k–o,q |
| UGC 04288 | 08:14:35.8 | 19:21:07 | 31,745 – -970 | 0.49 | 26 | A | o,p,q,s,t |
| UGC 04496 | 08:36:36.3 | 25:08:12 | 31,745 – -970 | 0.58 | 26 | A | … |
| UGC 04831 | 09:11:35.5 | 32:50:55 | 5,360 – 2,992 | 0.42 | 6.5 | A | … |
| UGC 05009 | 09:24:44.6 | 20:01:45 | 5,596 – 2,958 | 0.41 | 6.5 | A | … |
| UGC 05211 | 09:44:39.0 | -00:13:17 | 7,836 – 5,198 | 0.51 | 6.5 | A | … |
| UGC 05361 | 09:59:00.8 | 25:12:08 | 31,745 – -970 | 0.58 | 26 | A | h,o,p,q,s,t |
| UGC 05440 | 10:05:36.2 | 04:16:23 | 31,745 – -970 | 0.42 | 26 | A | h,o,p,q,s,t |
| UGC 05583 | 10:20:35.1 | 25:23:01 | 31,745 – -970 | 0.83 | 6.5 | A | … |
| UGC 05592 | 10:21:32.7 | 22:32:47 | 31,745 – -970 | 0.88 | 26 | A | … |
| UGC 05679 | 10:28:52.8 | 26:20:11 | 7,807 – 5,169 | 0.52 | 26 | A | … |
| UFC 05770 | 10:28:52.8 | 26:20:11 | 7,807 – 5,169 | 0.52 | 26 | A | … |
| UGC 05710 | 10:31:27.2 | 24:08:34 | 31,745 – -970 | 0.73 | 26 | A | i,m,o,p,q,s,t |
| UGC 05743 | 10:34:48.8 | 25:32:40 | 31,745 – -970 | 1.2 | 26 | A | … |
| UGC 05769 | 10:37:02.7 | 20:25:54 | 31,745 – -970 | 0.45 | 26 | A | … |
| UGC 05785 | 10:38:26.0 | 30:08:41 | 7,684 – 5,046 | 0.56 | 6.5 | A | … |
| UGC 05790 | 10:39:04.7 | 04:38:51 | 31,745 – -970 | 0.48 | 26 | A | j,m,o,p,q,s,t |
| UGC 05801 | 10:39:52.7 | 21:50:42 | 31,745 – -970 | 0.49 | 26 | A | j,m,o,p,q,s |
| UGC 05828 | 10:42:30.5 | 15:45:52 | 31,745 – -970 | 0.78 | 26 | A | j,l |
| [OBC97]N02-2 | 10:42:33.2 | 24:41:35 | 31,745 – -970 | 0.47 | 26 | A | j,m,o,p,q,t |
| [OBC97]N02-3 | 10:44:07.0 | 24:42:32 | 31,745 – -970 | 0.82 | 26 | A | j,m,o,p,q,t |
| UGC 05930 | 10:49:34.9 | 21:59:36 | 31,745 – -970 | 0.86 | 26 | A | … |
| UGC 06031 | 10:55:00.6 | 29:32:36 | 31,745 – -970 | 0.97 | 26 | A | … |
| UGC 06124 | 11:03:39.5 | 31:51:30 | 31,745 – -970 | 0.64 | 26 | A | j,o,p,q,s |
| UGC 06243 | 11:12:24.4 | 31:24:41 | 31,745 – -970 | 0.47 | 26 | A | j,m,o,p,q,s |
| UGC 06300 | 11:17:16.9 | 16:19:37 | 31,745 – -970 | 0.49 | 26 | A | j,o,p,q,s |
| UGC 06401 | 11:23:19.1 | 13:37:47 | 2,061 – -577 | 0.62 | 6.5 | A | … |
| UGC 06524 | 11:13:30.0 | 23:10:37 | 31,745 – -970 | 0.97 | 26 | A | t |
| UGC 06425 | 11:24:44.8 | 23:36:54 | 8,064 – 5,426 | 0.74 | 6.5 | A | … |
| UGC 06425 | 11:24:45 | 23:36:54 | 9,278 – 4,212 | 2.0 | 17 | N | … |
| Galaxy | RA | Dec | Search Range | resolution | Tel. | RFI † | |
|---|---|---|---|---|---|---|---|
| UGC 06557 | 11:35:07.5 | 29:53:27 | 31,745 – -970 | 0.54 | 26 | A | j,o,p,q,s,t |
| UGC 06659 | 11:42:07.3 | 32:32:21 | 31,745 – -970 | 0.47 | 26 | A | j,l,m,o,p,q,s |
| UGC 06748 | 11:46:24.3 | 35:43:42 | 31,745 – -970 | 1.3 | 26 | A | j,o,p,q,s |
| UGC 06842 | 11:52:12.4 | 34:47:39 | 31,745 – -970 | 1.6 | 26 | A | l,q |
| UGC 06897 | 11:55:36.4 | 09:46:54 | 7,843 – 5,205 | 1.1 | 6.5 | A | … |
| UGC 06913 | 11:56:15.1 | 17:01:44 | 8,119 – 5,481 | 1.2 | 6.5 | A | u |
| UGC 06947 | 11:57:56.8 | 22:11:26 | 31,745 – -970 | 0.74 | 26 | A | s |
| [OBC97]N10-2 | 11:58:42.0 | 20:34:43 | 31,745 – -970 | 0.41 | 26 | A | … |
| UGC 07084 | 21:22:01.5 | 07:08:43 | 31,745 – -970 | 1.3 | 26 | A | u |
| UGC 07342 | 12:18:30.8 | 05:55:35 | 31,745 – -970 | 1.3 | 26 | A | i,j,m,o,p,q,s |
| UGC 07369 | 12:19:38.7 | 29:53:00 | 1,544 – -1,094 | 0.62 | 6.5 | A | … |
| UGC 07388 | 12:20:13.8 | 33:39:55 | 31,745 – -970 | 1.4 | 26 | A | j,m,o,p,q,s,t |
| UGC 07425 | 12:21:53.6 | 15:38:46 | 31,745 – -970 | 1.0 | 26 | A | m,o,p,q,t,u |
| UGC 07437 | 12:22:19.5 | 28:49:54 | 31,745 – -970 | 0.89 | 26 | A | q |
| UGC 07438 | 12:22:19.8 | 30:03:48 | 31,745 – -970 | 0.51 | 26 | A | j,m,o,p,q,s |
| UGC 07457 | 12:23:09.8 | 29:20:58 | 31,745 – -970 | 0.85 | 26 | A | m,o,p,q,t,u |
| UGC 07598 | 12:28:30.9 | 32:32:51 | 10,360 – 7,722 | 1.0 | 6.5 | A | … |
| UGC 07630 | 12:29:43.8 | 11:24:09 | 31,745 – -970 | 1.3 | 26 | A | … |
| UGC 07770 | 12:36:17.0 | 20:59:55 | 31,745 – -970 | 1.0 | 26 | A | q |
| UGC 07928 | 12:45:09.2 | 23:02:21 | 31,745 – -970 | 0.87 | 26 | A | s,u |
| UGC 07929 | 12:45:20.8 | 21:25:37 | 31,745 – -970 | 1.2 | 26 | A | … |
| UGC 07934 | 12:45:38.7 | 35:05:01 | 31,745 – -970 | 0.76 | 26 | A | j,o,p,q,t |
| UGC 08081 | 12:58:09.0 | 14:51:32 | 31,745 – -970 | 0.70 | 26 | A | … |
| UGC 08171 | 13:04:39.8 | 18:25:29 | 20,716 – 18,078 | 1.2 | 6.5 | A | … |
| UGC 08311 | 13:13:50.7 | 23:15:17 | 4,771 – 2,133 | 0.69 | 6.5 | A | v |
| UGC 08637 | 13:39:36.6 | 06:10:09 | 31,745 – -970 | 0.83 | 26 | A | … |
| UGC 08644 | 13:40:01.5 | 07:21:55 | 38,500 – -548 | 2.3 | 26 | A | f,g,m,o,p,q,r,v |
| UGC 08762 | 13:51:00.8 | 24:05:27 | 4,714 – 2,076 | 0.64 | 6.5 | A | … |
| UGC 08799 | 13:53:19.9 | 05:46:17 | 31,745 – -970 | 0.90 | 26 | A | q |
| UGC 08802 | 13:53:08.1 | 35:42:41 | 31,745 – -970 | 0.77 | 26 | A | i,m,o,q |
| UGC 08904 | 13:58:51.1 | 26:06:24 | 31,745 – -970 | 0.51 | 26 | A | i,m,o,p,q,t |
| UGC 09008 | 14:05:01.8 | 11:00:42 | 5,665 – 3,027 | 0.44 | 6.5 | A | … |
| UGC 09010 | 14:05:20.4 | 30:48:42 | 8,650 – 6,012 | 0.63 | 6.5 | A | … |
| UGC 09238 | 14:24:47.9 | 35:16:29 | 31,745 – -970 | 0.78 | 26 | A | i,m,o,p,q |
| UGC 09243 | 14:25:33.2 | 33:50:52 | 4,636 – 1,998 | 1.3 | 6.5 | A | … |
| [OBC97]A01-1 | 14:27:07.4 | 25:47:04 | 31,745 – -970 | 0.80 | 26 | A | j,m,o,q,s |
| UGC 09513 | 14:46:09.3 | 13:01:45 | 15,102 – 12,464 | 0.83 | 26 | A | … |
| UGC 09676 | 15:03:30.6 | 27:49:30 | 4,203 – 1,565 | 0.83 | 6.5 | A | … |
| UGC 09680 | 15:04:02.1 | 18:38:56 | 31,745 – -970 | 0.51 | 26 | A | i,m,o,p,q,t |
| UGC 09767 | 15:12:48 | 07:26:02 | 16,216 – 11,150 | 3.1 | 17 | N | … |
| UGC 09770 | 15:13:22.3 | 25:11:50 | 31,745 – -970 | 0.72 | 26 | A | i,o,p,q,s,t |
| UGC 10217 | 16:07:40 | 22:20:31 | 15,964 – 10,898 | 0.44 | 17 | N | … |
| UGC 10365 | 16:24:05.9 | 04:41:58 | 31,745 – -970 | 0.64 | 26 | A | j,l,m,o,p,q,t |
| UGC 10377 | 16:25:01.7 | 23:04:12 | 31,745 – -970 | 0.55 | 26 | A | j,l,m,o,p,q,t |
| UGC 10673 | 17:03:08.6 | 29:51:50 | 31,745 – -970 | 0.56 | 26 | A | j,l,m,o,p,q,s |
| UGC 10674 | 17:03:40 | 09:17:50 | 13,030 – 7,964 | 1.2 | 17 | N | … |
| UGC 11396 | 19:03:49.5 | 24:21:28 | 38,500 – -548 | 0.50 | 26 | A | b,o,q |
| UGC 11569 | 20:28:47.8 | 10:38:02 | 38,500 – -548 | 0.81 | 5.2 | A | b,m,o,q |
| UGC 11625 | 20:45:57 | 28:31:56 | 17,103 – 12,037 | 2.4 | 17 | N | … |
| UGC 11654 | 20:58:12.1 | 04:28:39 | 38,500 – -548 | 1.4 | 26 | A | b,m,o,q,r |
| UGC 11694 | 21:11:52 | 11:16:42 | 7,598 – 2,532 | 1.1 | 17 | N | … |
| UGC 11742 | 21:26:26.3 | 02:03:02 | 38,500 – -548 | 1.9 | 26 | A | a–c,e–h,k–r,v |
| UGC 11840 | 21:53:18 | 04:14:53 | 10,519 – 5,453 | 5.2 | 17 | N | … |
| UGC 12021 | 22:24:12 | 06:00:13 | 7,005 – 1,939 | 1.4 | 17 | N | … |
| UGC 12189 | 22:48:06 | 03:55:41 | 15,274 – 10,208 | 8.2 | 17 | N | … |
| UGC 12359 | 23:06:05 | 14:52:02 | 13,236 – 8,170 | 3.0 | 17 | N | … |
| Galaxy | RA | Dec | Search Range | resolution | Tel. | RFI † | |
| UGC 12424 | 23:13:11 | 10:46:20 | 13,155 – 8,098 | 4.8 | 17 | N | … |
| [OBC97] P06-6 | 23:44:07.9 | 09:13:40 | 31,745 – -970 | 0.4 | 6.5 | A | h,o,p,q,s |
| †RFI (2.5 MHz, 260 km s-1): a. 1240 MHz (38,077 km s-1); b. 1246 MHz (36,810 km s-1); | |||||||
| c. 1257 MHz (34,489 km s-1); d. 1258 MHz (34,278 km s-1); e. 1265 MHz (32,800 km s-1); | |||||||
| f. 1267 MHz (32,378 km s-1); g. 1276 MHz (30,478 km s-1); h. 1278 MHz (30,056 km s-1); | |||||||
| i. 1283 MHz (29,001 km s-1); j. 1290 MHz (27,524 km s-1); k. 1294 MHz (26,679 km s-1); | |||||||
| l. 1303 MHz (24,780 km s-1); m. 1312 MHz (22,880 km s-1); n. 1320 MHz (21,119 km s-1); | |||||||
| o. 1330 MHz (19,081 km s-1); p. 1340 MHz (16,971 km s-1); q. 1350 MHz (14,860 km s-1); | |||||||
| r. 1358 MHz (13,171 km s-1); s. 1370 MHz (10,639 km s-1); t. 1381 MHz (8,317 km s-1) | |||||||
| Galaxy | † | Notes | ||||||
|---|---|---|---|---|---|---|---|---|
| ‡ | ||||||||
| UGC 0134 | 1684 | 157 | 141 | 2.44 | 8.5 | 7641 | a | |
| UGC 0189 | 7614 | 197 | 186 | 2.37 | 9.8 | 76181 | … | |
| UGC 0667 | 6080 | 232 | 216 | 1.86 | 9.5 | 60861 | … | |
| UGC 1122 | 21667 | 258 | 241 | 1.68 | 10.6 | 60861 | … | |
| UGC 2299 | 10235 | 151 | 134 | 2.81 | 10.1 | 102531 | … | |
| UGC 2580 | 9233 | 270 | 236 | 1.15 | 9.7 | … | … | |
| UGC 2588 | 10093 | 216 | 200 | 1.69 | 9.9 | … | … | |
| UGC 2641 | 7044 | 356 | 338 | 0.97 | 9.4 | … | b | |
| UGC 2671 | 7123 | 218 | 170 | 0.30 | 8.8 | 71271 | … | |
| UGC 2741 | 10985 | 64 | 48 | 1.59 | 9.9 | 110021 | … | |
| UGC 2796 | 9061 | 512 | 481 | 6.91 | 10.4 | 90761 | … | |
| UGC 03119 | 7840 | 469 | 430 | 3.81 | 10.0 | 78511 | … | |
| UGC 3225 | 11577 | 551 | 514 | 1.47 | 10.0 | … | c | |
| UGC 3308 | 8517 | 136 | 119 | 5.56 | 10.3 | … | … | |
| UGC 3585 | 10313 | 317 | 282 | 3.56 | 10.3 | 76852,105353 | … | |
| UGC 3790 | 3459 | 251 | 217 | 2.91 | 9.2 | 34381 | c | |
| UGC 4109 | 13696 | 347 | 326 | 2.44 | 10.3 | 137362,137523 | … | |
| UGC 4131 | 17719 | 470 | 429 | 2.12 | 10.5 | … | … | |
| UGC 4144 | 9795 | 494 | 458 | 1.72 | 9.9 | … | … | |
| UGC 4288 | 30223 | 558 | 520 | 2.54 | 11.0 | … | … | |
| UGC 4496 | 8681 | 523 | 494 | 1.09 | 9.6 | 86664 | d | |
| UGC 4831 | 4318 | 163 | 146 | 3.41 | 9.5 | 43112 | … | |
| UGC 5009 | 4273 | 213 | 180 | 3.01 | 9.4 | 42772 | … | |
| UGC 5211 | 6490 | 314 | 297 | 4.20 | 9.9 | 65172 | … | |
| UGC 5440 | 18932 | 531 | 504 | 3.38 | 10.8 | … | … | |
| UGC 5592 | 7254 | 296 | 280 | 3.05 | 9.9 | … | … | |
| UGC 5679 | 6496 | 228 | 209 | 2.43 | 9.7 | 64882 | … | |
| UGC 5743 | 5159 | 278 | 256 | 2.90 | 9.6 | … | … | |
| UGC 5769 | 12973 | 317 | 160 | 2.05 | 10.2 | … | e | |
| UGC 5770 | 12628 | 285 | 255 | 0.95 | 9.9 | 126382 | e | |
| UGC 5785 | 6366 | 281 | 267 | 3.75 | 9.9 | 63652 | … | |
| UGC 5801 | 16632 | 456 | 438 | 1.48 | 10.3 | … | … | |
| UGC 5828-01 | 15107 | 552 | 539 | 1.65 | 10.3 | 149892 | … | |
| UGC 5828-02 | 14617 | 258 | 217 | 1.60 | 10.2 | 146082 | … | |
| UGC 5930 | 13222 | 265 | 228 | 2.03 | 10.2 | … | … | |
| UGC 6031 | 14504 | 560 | 525 | 4.69 | 10.7 | 144701 | … | |
| UGC 6124 | 13970 | 613 | 583 | 2.19 | 10.3 | … | … | |
| UGC 6243 | 12380 | 254 | 218 | 0.76 | 9.7 | … | … | |
| UGC 6300 | 1070 | 96 | 77 | 0.72 | 7.6 | … | … | |
| UGC 6401 | 888 | 69 | 53 | 0.35 | 7.1 | 7422 | … | |
| UGC 6425 | 6753 | 287 | 274 | 3.28 | 9.9 | 67452 | … | |
| UGC 6524 | 6214 | 270 | 238 | 3.07 | 9.8 | … | … | |
| UGC 6525-01 | 6061 | 126 | 103 | 1.21 | 9.3 | 60555,60792 | … | |
| UGC 6525-02 | 6816 | 201 | 154 | 1.26 | 9.4 | … | … | |
| UGC 6557 | 13880 | 350 | 330 | 0.83 | 9.9 | … | … | |
| UGC 6748 | 10775 | 282 | 250 | 2.56 | 10.2 | … | … | |
| UGC 6842 | 18807 | 433 | 414 | 1.65 | 10.4 | … | … | |
| UGC 6897 | 6525 | 255 | 235 | 4.57 | 10.0 | 65241 | … | |
| UGC 6913 | 6795 | 468 | 446 | 4.33 | 10.0 | 68002 | … | |
| UGC 6947 | 9253 | 400 | 375 | 3.01 | 10.1 | … | f | |
| UGC 7388 | 6461 | 471 | 439 | 3.05 | 9.8 | … | … | |
| UGC 7437 | 19597 | 539 | 499 | 2.13 | 10.6 | 196691 | g | |
| UGC 7438 | 691 | 109 | 95 | 0.30 | 6.8 | … | h | |
| UGC 7598 | 9054 | 192 | 166 | 5.75 | 10.4 | 90411 | … | |
| UGC 7770 | 8308 | 444 | 424 | 6.42 | 10.3 | … | … | |
| UGC 7934 | 9682 | 449 | 430 | 3.65 | 10.2 | … | … | |
| UGC 8171 | 19513 | 152 | 119 | 2.85 | 10.7 | 193971 | … |
| Galaxy | † | Notes | ||||||
| ‡ | ||||||||
| UGC 8311 | 3493 | 266 | 202 | 2.85 | 9.2 | 34521 | … | |
| UGC 8637 | 6958 | 147 | 129 | 4.39 | 10.0 | 69702 | i | |
| UGC 8644 | 6983 | 152 | 142 | 1.05 | 9.4 | … | … | |
| UGC 8762 | 3407 | 181 | 166 | 5.71 | 9.5 | 33951 | … | |
| UGC 8802 | 12342 | 417 | 396 | 3.80 | 10.4 | … | … | |
| UGC 8904 | 9773 | 300 | 278 | 4.63 | 10.3 | … | … | |
| UGC 9008 | 5348 | 162 | 147 | 2.67 | 9.6 | 43462 | … | |
| UGC 9010 | 7350 | 206 | 188 | 2.15 | 9.7 | 73311 | j | |
| UGC 9238 | 3348 | 220 | 201 | 0.95 | 8.7 | 33732 | k | |
| UGC 9243 | 3339 | 215 | 201 | 4.25 | 9.4 | 33171 | … | |
| UGC 9513 | 13926 | 242 | 213 | 1.34 | 10.1 | 137832 | l | |
| UGC 9676 | 2887 | 176 | 175 | 3.78 | 9.2 | 28841 | … | |
| UGC 9680 | 14572 | 549 | 504 | 1.75 | 10.3 | … | … | |
| UGC 10674-1 | 10384 | 156 | 136 | 0.78 | 9.6 | 104972 | m | |
| UGC 10674-2 | 10745 | 111 | 61 | 1.03 | 9.8 | 104972 | m | |
| UGC 11396 | 4441 | 297 | 281 | 2.48 | 9.4 | … | … | |
| UGC 11569 | 4444 | 222 | 204 | 1.54 | 9.2 | … | … | |
| UGC 11694 | 4995 | -10 | 502 | 1.90 | 9.4 | 50652,51273 | n | |
| UGC 11742 | 14559 | 188 | 163 | 0.90 | 10.0 | … | … | |
| UGC 12021 | 4472 | 275 | 259 | 6.74 | 9.8 | 44726,45022 | … | |
| [OBC97] A1-1 | 13891 | 262 | 242 | 1.16 | 10.0 | … | … | |
| [OBC97] N2-2 | 13118 | 358 | 341 | 1.21 | 10.0 | … | … | |
| [OBC97] N2-3 | 13105 | 360 | 345 | 1.19 | 10.0 | … | … | |
| [OBC97] N10-2 | 20680 | 440 | 416 | 1.12 | 10.4 | … | … | |
| †Velocity Measurements: | ||||||||
| 1Velocity is taken from NED or from Bottinelli et al. (bottinelli90 (1990)). | ||||||||
| For these galaxies, no information other than the velocity is available from this catalog. | ||||||||
| 2Optical velocity is from the Updated Zwicky Catalog (Falco et al. falco99 (1999)). | ||||||||
| 3Optical velocity is from the CfA redshift survey (Markze, Huchra, & Geller markze96 (1996); Huchra, Vogeley, | ||||||||
| & Geller huchra99 (1999) | ||||||||
| 421-cm velocity is from Giovanelli, Avera, & Karachentsev (giov97a (1997)) | ||||||||
| 521-cm velocity is from Giovanelli et al. (giov97b (1997)) | ||||||||
| 6H- velocity from Mathewson, & Ford (mathewson96 (1996)) | ||||||||
| ‡Galaxy notes are given in Appendix A. | ||||||||
Appendix A Notes on Individual Galaxies
- a. UGC 00134:
-
This detection is likely UGC 00132, which at vHEL = 1666 km s-1 and away is within the Nançay beam.
- b. UGC 02641:
-
ARK 099, at vHEL = 7080 km s-1 and away, is within the Arecibo beam. Both UGC 02641 and ARK 099 are of late (S?) morphological type and neither have published H i spectra. It is likely that both galaxies contribute to the observed H i spectra.
- c. UGC 03225, UGC 3790:
-
These objects are listed in NED as galaxy pairs.
- d. UGC 04496:
-
NRGb 004.06, at vHEL = 8730 km s-1 and away, is within the Arecibo beam. It is likely that both galaxies lie within the observed H i spectra.
- e. UGC 05769, UGC 05770
-
Both of these galaxies lie within the observed H i spectra.
- f. UGC 06947:
-
CGCG 127-113, at vHEL = 9106 km s-1 and away, is still within the first Arecibo side lobe. However, CGCG 127-113 is classified as an E0 galaxy and so is unlikely to contribute much (if any) gas to the H i spectra measured for UGC 06947.
- g. UGC 07437:
-
This object is a galaxy pair with one galaxy at vHEL = 19669 km s-1 and the other at 19319 km s-1. It is doubtful that the smaller member of the pair (UGC 07437-01) is contributing significantly to the observed spectra, though, as it is classified as an E galaxy while UGC 07437 is an Sbc galaxy.
- h. UGC 07438:
-
NGC 4308, at vHEL = 624 km s-1 and away, could lie within the first side lobe of the Arecibo beam. NGC 4308 is classified as an E galaxy, though, and so is likely not contributing significantly to the total H i gas found.
- i. UGC 08637:
-
UGC 08637 is listed as a galaxy pair within NED. However, no velocity is given for its companion and no evidence is visible within UGC 08637’s spectra for contamination from another galaxy.
- j. UGC 09010:
-
UGC 09010 has two companions which could be contaminating the observed spectra – UGC 09012 at vHEL=7483 km s-1 and away and MCG +05-33-050 at vHEL = 7628 km s-1 and away. Both companion galaxies fall within the Arecibo beam and first side lobe. MCG +05-33-050 is classified as a S0 galaxy and is not likely contributing significantly to the observed H i flux. UGC 09012, though, is a large, bright, spiral galaxy which probably has considerably contaminated the observed flux.
- k. UGC 09238:
-
This galaxy has a companion galaxy, UGC 09235 at vHEL = 2973 km s-1 and only away, well within the Arecibo beam. It is likely that UGC 09235 is the reason for the apparently lopsided spectra seen for UGC 09238.
- l. UGC 09513:
-
UGC 09515 lies at 14011 km s-1 and from UGC 09513. UGC 09515 is listed as an S? galaxy, and could contain enough H i mass to considerably contaminate the H i flux found for UGC 09513.
- m. UGC 10674:
-
is not listed as either being a galaxy pair or having a companion within 50′. However, the spectra clearly shows two separate profiles.
- n. UGC 11696:
-
UGC 11694 is part of a galaxy group which also contains UGC 11696 (vHEL = 5018 km s-1, distance = , UGC 11700 (vHEL = 5036 km s-1, distance = ), CGCG 426-015 (vHEL = 5031 km s-1, distance=), and UGC 11697 (vHEL = 5086, distance = ). As this galaxy was observed with the Nançay telescope, it is likely to be contaminated by one or more of UGC 11694’s companions.