Revealing the Young Starburst in Haro 3 with Radio and Infrared Imaging
The Wolf-Rayet galaxy Haro 3 (Mrk 35, NGC 3353) was observed at the near-IR and radio wavelengths as part of ongoing program to study the earliest stages of starbursts. These observations confirm that the current episode of star formation is dominated by a single region (region A). While there are knots of recent ( Myr) star formation outside of region A, the sources of ionizing radiation as observed in both radio and Br observations are almost exclusively associated with region A. The derived ionizing flux implies a star formation rate of yr-1 localized within a radius of kpc. A comparison with observations from HST indicates that one or more of the star clusters in region A are optically obscured. The star clusters in region A have ages at least as young as Myr, and possibly as young as Myr. The star cluster that appears to be the youngest also exhibits a near-IR excess in its colors, possibly indicating natal dust in very close proximity to the ionizing stars. The difference between optical- and radio-determined ionizing fluxes as well as the near-IR colors indicate an average extinction value of in region A. The total stellar mass associated with the current starburst in region A is inferred from both the near-IR and radio observations to be . The other main stellar concentrations observed in the near-IR (Regions B1 and B2) are somewhat older than region A, with ages Myr, and the near-IR observations indicate they have stellar masses of and , respectively.
1 INTRODUCTION
The study of nearby starburst galaxies is important for advancing our understanding of the evolution of stars and galaxies. Understanding the nature of starburst systems becomes increasingly important at higher redshifts where merger events and the resulting starburst episodes are common. According to hierarchical models of structure formation, galaxy mergers are responsible for the various galaxy morphologies we observe in the local universe, and these mergers may also contribute to the reionization of the universe at (e.g. Madau, Haardt, & Rees, 1999).
The early stages of a starburst episode are typically obscured by the molecular clouds associated with the star formation phenomenon. Although newly born massive stars emit optical and ultraviolet (UV) light prodigiously, observations at these wavelengths short-ward of the infrared (IR) are of limited use in studying star formation. In order to mitigate the effects of extinction and obtain accurate measurements of the current star formation in a galaxy, observations in the infrared to radio regimes are critical.
The infrared emission from starburst regions is primarily due to two sources: (1) blackbody emission from the stars themselves, and (2) thermal re-radiation by dust of the optical and UV emission from the stars. Which of these sources dominates depends largely on the wavelength being observed; the mid- to far-IR spectral energy distribution is dominated by dust emission, while the near-IR emission is typically due to stellar light. Dust emission can also contribute to the near-IR spectral energy distribution if it resides in very close proximity to the stars and reaches temperatures near those required for sublimation. In this case, the near-IR emission is observed to have an “infrared excess”. The near-IR colors of clusters can be used in combination with population synthesis models to determine properties of the embedded stellar content.
While broad-band near-IR observations can directly measure the stellar photospheric emission, radio observations probe the embedded H II regions surrounding massive young stars. Young massive stars are responsible for producing thermal free-free emission via their surrounding H II regions. If an H II region is young and dense enough, this thermal emission will actually be optically thick in the cm regime and exhibit a turnover in the spectral energy distribution. The radio flux densities from H II regions can be used to infer the total stellar content, age, electron densities, and pressures of extremely young starburst regions.
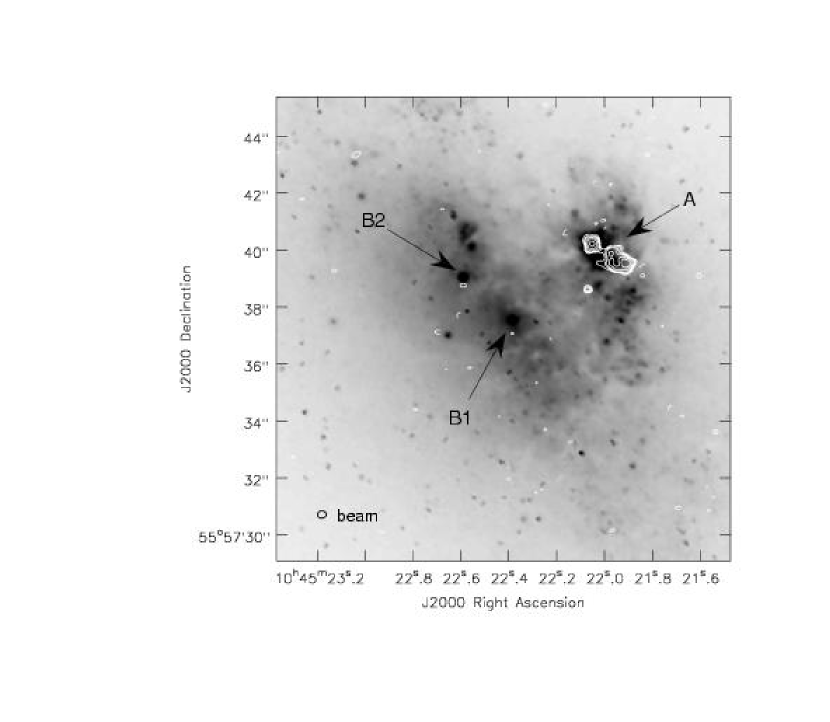
Haro 3 is a dwarf irregular starburst galaxy that was selected for infrared and radio study based on its relatively close proximity of 13.1 Mpc and known Wolf-Rayet (WR) stellar content (Steel et al., 1996). Haro 3 has an optical diameter of 3.8 kpc and consists of two main sites of star formation, A and B (Steel et al., 1996), as indicated in Figure 1a. Its classification as a WR-galaxy indicates that the system has undergone a starburst episode within the last Myr, making it an excellent candidate for hosting sites of ongoing star formation less than a few Myr old. Steel et al. (1996) find a WR/O-star ratio of 0.31, suggesting the recent starburst episode was relatively “instantaneous” and estimate a burst age of Myr for region A and Myr for region B. Infrared Space Observatory (ISO) observations by Metcalfe et al. (1996) indicate that polycyclic aromatic hydrocarbon (PAH) emission peaks on the main regions of star formation, but is present throughout the galaxy. This global PAH emission indicates copious near-ultraviolet emission throughout the galaxy, and provides additional evidence for recent wide-scale star formation in Haro 3.
The cause of the current vigorous burst of star formation in Haro 3 is unclear. There is circumstantial evidence of a minor merger event, including both extended emission that is suggestive of tidal tails and two distinct regions of star formation that could be remnants of the original galaxies. However, Steel et al. (1996) note that the galaxy has relatively regular outer isophotes in optical light and that all of the star forming regions have the same redshift. Steel et al. (1996) also find approximately the same metallicity for both regions A and B of (roughly 1/3 the solar value); using a different slit location, Huang et al. (1999) find a metallicity of . This evidence leads Steel et al. to conclude that the star formation in Haro 3 is most likely self-induced. We discuss various star formation scenarios for Haro 3 in § 4.3.
2 OBSERVATIONS
2.1 Radio Imaging
Haro 3 was observed with the Very Large Array (VLA) 111The National Radio Astronomy Observatory is a facility of the National Science Foundation operated under cooperative agreement by Associated Universities, Inc. at 3.6 cm using the A-array in February 2002 and at 1.3 cm using C-array in November 2002. Both observations utilized the flux density calibrator 3C286; based on the scatter in the VLA flux calibrator database, we estimate the resulting flux density scale at each wavelength is uncertain by %. Calibration was carried out using the AIPS software package, and the data sets were inverted and cleaned using the task imagr. While the total uv-coverage observed at each wavelength is different, an attempt was made to achieve relatively well-matched synthesized beams by restricting the uv-range used in the imaging process to 50-250 k at each wavelength. Although the uv-sampling within this range varied between the wavelengths, the resulting images are sensitive to roughly the same spatial scales. The weighting schemes used in the imaging process were also varied in order to mitigate the effect of different uv-sampling within the restricted uv-range. An additional 3.6 cm image was made using the full uv-range of k in order to achieve the maximum resolution and sensitivity possible. The resulting parameters for these images are listed in Table 1. Flux densities were measured using identical apertures within the viewer program in AIPS++; several combinations of apertures and annuli were used in order to estimate the uncertainty in this method. The resulting flux densities and their uncertainties are listed in Table 2.
2.2 Near-Infrared Imaging
Near-infrared (near-IR) imaging of Haro 3 was obtained in January 2003 using the NIRIM camera (Meixner, Young Owl, & Leach, 1999) on the WIYN 3.5m telescope at Kitt Peak National Observatory. Images were taken using the broad-band J (1.257m), H (1.649m), and K’ (m) filters as well as narrow-band Br (2.166m) with a plate scale of /pixel and a field-of-view of . A chopping technique was used to remove atmospheric background; short exposures (s) were taken in a off-off-on-on-off-off pattern. While the natural seeing as measured from standard stars was excellent throughout the observations (), the combination of the short exposures obtained in the chopping process resulted in a degradation of the imaging quality due to the telescope pointing error and lack of point sources to use for registration in the Haro 3 field. The resulting image quality is . The total on source integration times for J, H, K’, and Br were 480, 240, 240, and 720 s, respectively. A set of infrared standard stars were observed at different airmasses throughout the night roughly every hour. The data were reduced and calibrated using the IDL and IRAF software packages. The median of the four off-source images surrounding each on-source image was subtracted from the on-source image, and the resulting on-source images were cross-correlated and combined. Based on the uncertainties in the photometric solutions, we estimate the flux calibration to be accurate within %. This accuracy was verified by a different project carried out on the same night that contained stars present in the 2MASS catalog (Indebetouw et al., 2003). Aperture photometry was performed using the IRAF package DAOPHOT with identical apertures and annuli in each of the three broad-band filters.
3 RESULTS
3.1 The Starburst Morphology in the Optical, Near-IR, and Radio
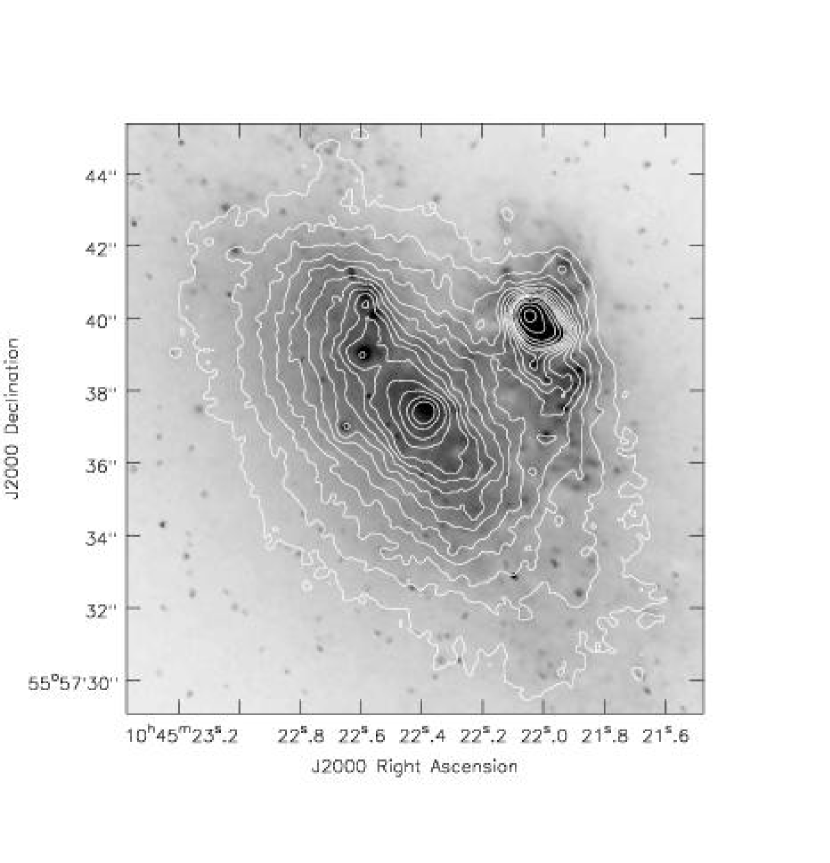
A V-band (F606W) optical image was retrieved from the Hubble Space Telescope (HST) archive for comparison with the radio and near-IR observations presented in this paper. Unfortunately, only a single “snapshot” image was available, and therefore the PSF is under-sampled and the image suffers from cosmic ray contamination. This image is shown along with radio and near-IR contours in Figures 1-2. The Regions A and B clearly contain a number of optically bright starburst knots, many of which are likely to be super star clusters (SSCs). The optical image also suggests a number of dust lanes between regions A and B and to the west of region A.
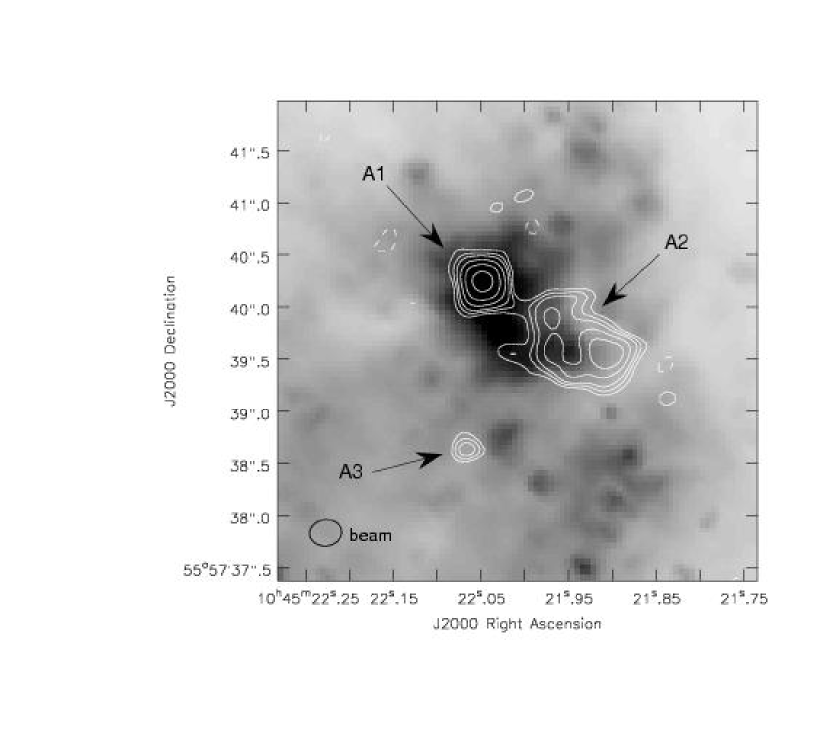
The radio emission at 1.3 cm and 3.6 cm is thermal in nature (, where ) and only associated with region A, which supports the idea that region A is dominating the current burst of star formation in the galaxy system. This thermal radio emission is resolved into at least three components at both 1.3 cm and 3.6 cm, which we call A1, A2, and A3. The highest resolution 3.6 cm image also suggests that A2 is complex in nature, consisting of a single dominant source and two or more less luminous sources (Fig. 1b). The relative registration of the optical and radio images are limited by the astrometric uncertainty of HST, which we estimate to be . The radio source A1 corresponds to the brightest optical starburst knot, however source A2 extends beyond the optical starburst region into a possible dust lane and does not appear to be associated with an optical source. Likewise, source A3 is located in the proximity of possible dust lanes, but could possibly be associated with an optical source if the images were shifted relative to each other by . However, within the registration uncertainty, only one of the three radio sources (A1, A2, or A3) could have an optical counterpart.
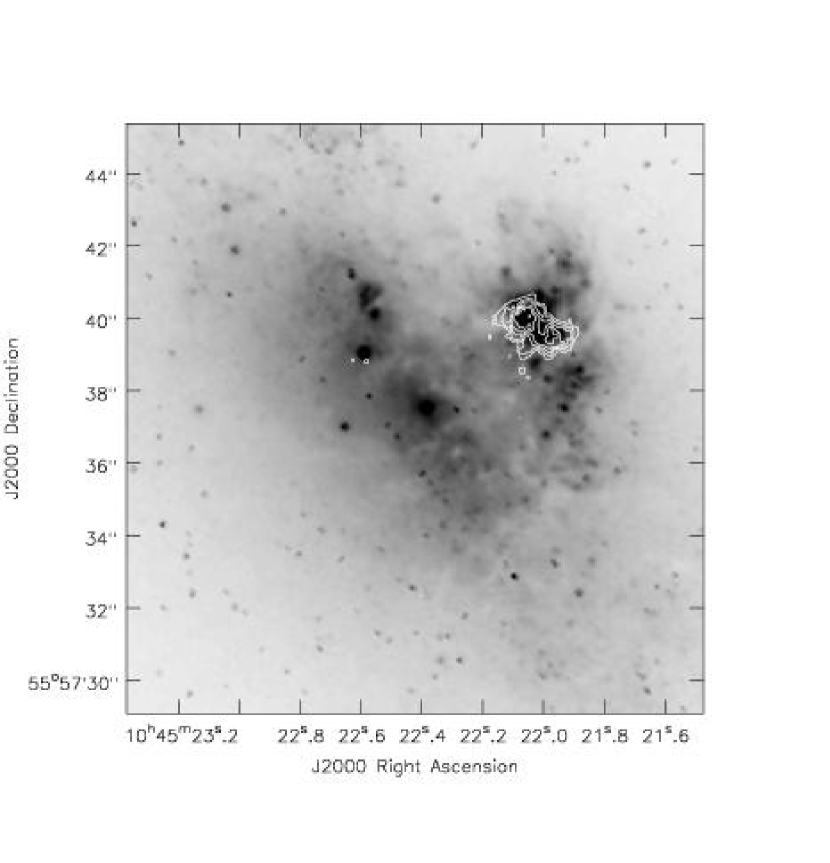
The near-IR images were registered to the optical image using two stars common to both images which are outside the field-of-view shown in Figure 2. We estimate this registration between the optical and the near-IR to have an accuracy better than . As shown in Figure 2, most of the optically bright starburst knots are associated with peaks in the near-IR emission. In all of the near-IR bands, the peak emission is associated with source A1. Although there is an extension of this near-IR emission in the direction of the radio source A2, there is not a peak in near-IR emission associated with it. There appears to be near-IR emission associated with the radio source A3, however the peak in the emission appears to shift slightly () depending on the near-IR band: while a peak in the K-band emission is in excellent spatial agreement with the radio peak, the J-band peak is more closely associated to the optical source offset by to the west of the radio source. This relative morphology may indicate that source A3 is complex and has not undergone coeval star formation throughout throughout the object or suffers from variable forground extinction. The optical regions B1 and B2 are also clearly associated with peaks in the near-IR emission in all of the broad bands. The continuum-subtracted nebular Br emission is almost exclusively associated with region A, although there is a hint of Br emission from region B2. The Br observations confirm the youth and strength of the starburst in region A as inferred from the radio observations.
3.2 Ionizing Luminosities and Star Formation Rate
The ionizing luminosity of starburst regions is an important quantity in their physical interpretation; from the ionizing flux, both the star formation rate and the mass of the stellar content can be estimated. In the case of these observations, both the thermal radio luminosity and the Br emission can be used to independently determine the ionizing flux of the starburst regions in Haro 3.
The production rate of Lyman continuum photons can be determined from the radio luminosities by following Condon (1992),
| (1) |
We adopt a “typical” H II electron temperature of K, and use the 1.3 cm luminosities (which are less likely to suffer from either self-absorption or non-thermal contamination than the 3.6 cm luminosities). The values for sources A1, A2, and A2 determined using this method are listed in Table 2, and they range from s-1. The entire region A has an ionizing luminosity inferred from the radio observations of s-1
The continuum-subtracted Br fluxes can be used to determine by following Ho, Beck, & Turner (1990),
| (2) |
Unfortunately, it is not possible to disentangle sources A1 and A2 in the Br observations. We present the values for regions A1+A2, A3, and B2 using this method in Table 3. The inferred ionizing flux for region A using its Br flux is s-1, roughly lower than the value determined above using the radio observations. This difference in ionizing flux as measured from radio and near-IR observations suggests that even the Br emission is suffering from some extinction by the natal material surrounding the young clusters; the factor of two suggests or for the entire region A. This value is higher than the extinction value inferred from near-IR colors for the individual regions A1-A3 in § 3.3, possibly indicating that region A contains areas with thermal radio emission that are completely obscured in the near-IR.
The ionizing luminosity can also be converted to a star formation rate (SFR). Following Kennicutt (1998),
| (3) |
Using the ionizing flux measured from the radio observations, region A has a star formation rate of yr-1 within a radius of less than 0.1 kpc. This is roughly twice the value of yr-1 estimated by Hunter, Gallagher, & Rautenkranz (1982) from the H emission for the entire galaxy. This difference in derived star formation rates underscores the need for long wavelength observations in order to detect the emission from the current regions of star formation. This is particularly true for dwarf galaxy systems in which a single region of embedded star formation can have a dramatic impact on the inferred star formation rate. With a total atomic and molecular gas mass of (Meier et al., 2001; Gordon & Gottesman, 1981), the gas depletion time scale for Haro 3 at the current star formation rate is roughly 1 Gyr, which is atypically short for a dwarf irregular galaxy. This high star formation rate suggests that Haro 3 is undergoing an atypical star formation event for a dwarf galaxy, and might lend support to the idea that this galaxy is undergoing a small-scale merger event.
3.3 Star Cluster Extinctions, Ages, and Masses
In order to estimate the physical properties (such as extinction, age, and mass) of the near-IR sources in Haro 3, we have adopted the Starburst99 population synthesis models of Leitherer et al. (1999). In this case, we use models with and a Salpeter initial mass function between . It is well known that the stochastic presence of asymptotic giant branch (AGB) stars can affect the integrated light of a stellar population due to both their luminosity and red colors (e.g. Charlot, Worthey, & Bressan, 1996); however, because objects A1, A2, and A3 are young enough to have associated thermal radio emission, it is likely that they are far too young to also host AGB stars. A color-color plot of the near-IR sources is shown along with the model track for cluster ages of 0.1-10 Myr in Figure 3. Sources A1 and A2 were not resolved from each other in the near-IR images and are referred to collectively as A1+A2. In order to be consistent with the model for any age, sources A1+A2 and A3 must have extinction values of . These values are lower than those implied for the entire region A from a comparison between the ionizing flux as measured with radio and Br emission in § 3.2 (and discussed in § 4).
When these sources are de-reddened and projected onto the model track (shown with the dotted lines in Figure 3), source A1+A2 must be younger than Myr, and source A3 has an H-K color that is redder than even the youngest age available in these models of 0.1 Myr. The offset of A3 from the model is consistent with an infrared excess (Lada & Adams, 1992), possibly indicating very hot dust in the vicinity of the stellar cluster. Sources B1 and B2 are in excellent agreement with the model track for ages of Myr and no extinction. However, while these sources are consistent with being unreddened, we cannot rule out extinction values as high as . In any case, sources B1 and B2 must be older than Myr to be in agreement with the model.
The mass of the stellar clusters can be estimated using either their near-IR luminosities or their ionizing fluxes (derived in § 3.2) along with the Starburst99 models (assuming an instantaneous burst with a Salpeter IMF, 100 upper cutoff, 1 lower cutoff, and metallicity of ). In the first method, the K-band magnitudes can be used in combination with the estimated age of a cluster to determine its mass. Adopting an age of Myr for sources A1+A2 and A3, these objects have stellar masses of and , respectively. Adopting an age of Myr for sources B1 and B2 yields stellar mass of and , respectively. The second method can be utilized for the radio sources given their inferred ionizing fluxes in combination with the Starburst99 models. Assuming that scales directly with the cluster mass and that the clusters are Myr old, we infer that the radio sources A1, A2, and A3 have stellar masses of , , and respectively. These masses are in excellent agreement with the values derived using the K-band luminosity. The entire starburst region A has an inferred stellar mass from the radio observations of ; this estimate does not include recent star formation ( a few Myr) that is no longer detected at radio wavelengths.
4 DISCUSSION
4.1 Comparison of Optical, Near-IR, and Radio Results
The results from observations of Haro 3 across several decades in wavelength are forming a consistent picture of the star formation in the dwarf system over the last several million years. Previous work by Steel et al. (1996) indicated a number of star forming knots, with region A being the youngest with an estimated age of Myr. This age is consistent with the upper limit we derive from near-IR observations of Myr for regions A1 and A2 and Myr for region A3. The near-IR and radio observations presented in this paper also yield similar stellar masses of for region A.
A comparison between the extinction values measured by observations at different wavelengths may provide some insight into the geometry of the star forming regions. The extinction value we infer for region B is consistent with the extinction value calculated by Steel et al. (1996) using Balmer line ratios; however, the extinction values for region A are discrepant. Steel et al. calculate an , while the near-IR colors presented here indicated . Moreover, using the H flux, Steel et al. calculate that region A has an ionizing flux of s-1. This value is roughly 10 times lower than the value inferred from our radio observations, indicating an extinction value of . To complicate the extinction estimate further, a comparison between the ionizing flux from region A measured from radio and Br observations in this work suggests an .
The different extinction values inferred from diagnostics at different wavelengths might be expected if the dust geometry is not that of a simple screen between us and the obscurred cluster. Three possible scenarios are the following: (1) If the gas and dust are mixed, observations at a given wavelength only probe the material to an optical depth of , and consequently yield different extinction estimates. While Balmer line emission can only be detected from regions with little reddening, Br observations probe to even greater depths, and radio emission does not suffer from extinction at all. (2) If the the dust is clumpy (as might be expected in a medium of the type advocated by Faison et al., 1998), a fraction of optical flux can leak out of regions that otherwise suffer from large amounts of obscuration. (3) The region used to measure the extinction with Balmer lines by Steel et al. contained all of region A, including a great deal of recent star formation that is optically visible (see Fig. 1b). This “size of aperture” effect will also tend to produce an apparently lower extinction value. The radio and near-IR observations preferentially detect the youngest sources that are still likely to be obscured by larger amounts of dust.
Steel et al. note that the low extinction value they measure for Haro 3 is “interesting” considering that this galaxy is a bright IRAS source, suggesting a large warm dust content. Haro 3 also merits comparison with the dwarf starburst galaxy Henize 2-10 in this regard; Haro 3 has (Soifer et al., 1987), and Henize 2-10 has (Vacca, Johnson, & Conti, 2002), both of which are extremely high values for dwarf galaxies. In the case of Henize 2-10, only four embedded SSCs are responsible for most of the mid-IR flux of this galaxy, despite the fact that it also contains roughly 80 optically visible SSCs (Vacca, Johnson, & Conti, 2002; Johnson et al., 2000). Likewise, the warm dust surrounding the current regions of star formation is likely to be localized to small regions within Haro 3 and not uniforming distributed throughout the galaxy.
4.2 Importance of the IR Excess
Young stellar objects in the Milky Way are often observed to have an IR-excess in their JHK colors (K flux brighter than the locus of reddened main sequence stars in a color-color diagram, Lada & Adams, 1992). This IR-excess is commonly interpreted as being due to extremely hot dust (2000-3000K) present at the inner edges of circumstellar disks. In the case of young massive star clusters, an IR-excess may also suggest the presence of hot circumstellar material. Similarly red H-K colors have also been observed by Devost (1999) for clusters in Arp 299 and by Buckalew, Dufour, & Kobulnicky (in prep) in a sample of WR galaxies.
In principle, Br flux can also contribute to a red H-K color; however, in the case of cluster A3 in Haro 3, the Br flux is not high enough to appreciably contribute to the K-band magnitude. A uniform underlying older stellar population is also not likely to contribute to the IR-excess because the background subtraction removes any bias toward an underlying color. Another possibility to consider is that a single evolved star (e.g. AGB or carbon star) is contaminating the observations. While these types of stars can have both K-band magnitudes and H-K colors consistent with those of source A3, they would have J-H colors that are much redder (J-H) than any of the objects presented in this paper (Wainscoat et al., 1992). Furthermore, we would not expect such a star to also have radio continuum and Br emission. While we are not claiming with certainty that the IR-excess observed in these clusters is due to circumstellar material, it appears to be the most plausible explanation. Moreover, we know that young star clusters must contain hot circumstellar dust early in their evolution, so we should not be surprised to find it. We predict that nearly all radio selected ultra-young clusters will have an IR-excess in follow-up near-IR observations.
4.3 Speculation on the Cause of the Starburst in Haro 3
The origin of starburst episodes in dwarf galaxies has been a subject of much discussion in the literature. These galaxies tend to be dynamically “simple”; they often lack spiral structure and show evidence of solid body rotation (e.g. Gallagher & Hunter, 1984). These dynamic features suggest that star formation cannot be due to triggering processes such as gas compression by density waves or shear. Gerola, Seiden, & Schulman (1980) put forward a model of stochastic self-propagating star formation (SSPSF) that naturally explains starburst episodes in isolated dwarf galaxies as a statistical fluctuation in the star formation rate.
While SSPSF is almost certainly contributing to the star formation in in Haro 3 on some level, it seems unlikely that it could be solely responsible for the current burst for two main reasons: (1) The starbursts in regions A and B cannot be causally related. Regions A and B are approximately 250pc apart, and a shock traveling at a speed of km s-1 would take approximately 25 Myr to traverse this distance. However, the bursts in regions A and B are too similar in age to allow for this scenario; region A is roughly 1-4 Myr old, and the burst in region B is roughly 8-10 Myr old (and stellar feedback would not have been an important factor for at least a few Myr until the first supernovae began to explode in region B). (2) In order to form a single SSC, energetics require the convergence of at least ergs (Elmegreen, 2004). Only previous star formation in the form of SSCs could generate this amount of energy, and SSPSF would result in the energy diverging. A single supernova shell or expanding bubble from an OB association (as proposed by Steel et al., 1996) would be far from adequate.
In order to trigger the formation of SSCs, Elmegreen (2004) argues that star formation must be triggered by one of three physical environments: (1) instabilities and turbulence on a kpc-scale; (2) galaxy interactions or mergers; (3) galactic nuclear regions. In the case of Haro 3, we can almost certainly rule out (3) as the origin for all of the SSCs as there is no obvious “nuclear” region. It is possible that morphology of the recent star formation in Haro 3 represents an underlying spiral structure, in which case (1) becomes a possibility. The evidence against (2) as presented by Steel et al. (1996) is that regions A and B have similar redshifts and the outer optical isophotes of the galaxy are relaxed. However, the fact that regions A and B have similar redshifts does not rule out the possibility that they are (or once were) separate systems. Moreover, the relaxed outer optical isophotes of the system do not rule out a small scale interaction such as that found in the dwarf starburst galaxy Henize 2-10 (Corbin, Korista, & Vacca, 1993; Kobulnicky et al., 1995; Johnson et al., 2000).
A number of comparisons can be drawn between Haro 3 and Henize 2-10 in regard to their possible interaction history. Like Haro 3, Henize 2-10 appears to be isolated and has relaxed outer optical isophotes; however, Henize 2-10 appears to be “interacting” with a massive cloud of gas that is falling into the main body of the galaxy (Kobulnicky et al., 1995). The HI spectral profile of He 2-10 provided by Kobulnicky et al. is smooth and single peaked, with a possible slight asymmetry. However, in the HI map of He 2-10 with a resolution of , there is a clear protrusion of the HI that is consistent with a tidal tail. In the HI observations of Haro 3 (Gordon & Gottesman, 1981), the HI spectral profile is similar in nature to that of He 2-10; it has a smooth, single-peaked structure and possibly a slight asymmetry. However, these observations had a resolution of only ; in the absence of a high resolution map, this spectral profile might support the status of Haro 3 as non-interacting. However, even at this low resolution, Gordon & Gottesman note that the HI in Haro 3 has “faint irregular nebulosity”. Higher spatial resolution maps of the HI in Haro 3 might enable us to conclusively determine whether a small-scale interaction is the origin of the current starburst in galaxy. Moreover, high resolution HI observations similar to those used to study the dwarf galaxy Holmberg II by Puche et al. (1992) would allow for a detailed study of shells and bubbles associated with the recent starburst episodes in Haro 3.
References
- Charlot, Worthey, & Bressan (1996) Charlot, S., Worthey, G., & Bressan, A. 1996, ApJ, 457, 625
- Condon (1992) Condon, J.J. 1992, ARA&A, 1992, 30, 575
- Corbin, Korista, & Vacca (1993) Corbin, M.R.., Korista, K.T., & Vacca, W.D. 1993, AJ, 105, 1313
- Devost (1999) Devost, D. 1999, AJ, 118, 549
- Elmegreen (2004) Elmegreen, B. 2004, in preparation for the proceedings of “The Formation and Evolution of Massive Young Star Clusters”, ASP, eds. L. Smith and H. Lamers
- Faison et al. (1998) Faison, M., Churchwell, E., Hofner, P., Hackwell, J., Lynch, D.K., & Russell, R.W. 1998, ApJ, 500, 280
- Gallagher & Hunter (1984) Gallagher, J.S. & Hunter, D.A. 1984, ARA&A, 22, 37
- Gerola, Seiden, & Schulman (1980) Gerola, H., Seiden, P.E., & Schulman, L.S. 1980, ApJ, 242, 517
- Gordon & Gottesman (1981) Gordon, D. & Gottesman, S. 1981, AJ, 86, 161
- Ho, Beck, & Turner (1990) Ho, P.T.P., Beck, S.C., & Turner, J.L. 1990, ApJ, 349, 57
- Huang et al. (1999) Huang, J.H., Gu, Q.S., Ji, L., Li, W.D., Wei, J.Y., & Zheng, W. 1999, ApJ, 513, 215
- Hunter, Gallagher, & Rautenkranz (1982) Hunter, D.A., Gallagher, J.S., & Rautenkranz, D. 1982, ApJS, 49, 53
- Indebetouw et al. (2003) Indebetouw, R., Watson, C., Johnson, K.E., Whitney, B., & Churchwell, E. 2003, ApJ, 596, 83
- Johnson et al. (2000) Johnson, K.E., Leitherer, C., Vacca, W.D., & Conti, P.S. 2000, AJ, 120, 1273
- Kennicutt (1998) Kennicutt, R.C. 1998, ARA&A, 36, 189
- Kobulnicky et al. (1995) Kobulnicky, H.A., Dickey, J.M., Sargent, A.I., Hogg, D.E., & Conti, P.S. 1995, AJ, 110, 116
- Lada & Adams (1992) Lada, C.J. & Adams, F.C. 1992, ApJ, 393, 278
- Leitherer et al. (1999) Leitherer, C., Schaerer, D., Goldader, J.D., Delgado, R.M.G., Robert, C., Kune, D.F., de Mello, D.F., Devost, D., Heckman, T.M. 1999, ApJS, 123, 3
- Madau, Haardt, & Rees (1999) Madau, P., Haardt, F., & Rees, M.J. 1999, ApJ, 514, 648
- Meier et al. (2001) Meier, D.S., Turner, J.L., Crosthwaite, L.P., Beck, S.C. 2001, AJ, 121, 740
- Meixner, Young Owl, & Leach (1999) Meixner, M., Young Owl, R., & Leach, R.W. 1999, PASP, 111, 997
- Metcalfe et al. (1996) Metcalfe, L., Steel, S.J., Barr, P., Clavel, J., Delaney, M., Gallais, P., Laureijs, R.J., Leech, K., McBreen, B., Ott, S., Smith, N., & Hanlon, L. 1996, A&A, 315, 105
- Puche et al. (1992) Puche, D., Westfall, D., Brinks, E., & Roy, J. 1992, AJ, 103, 1841
- Soifer et al. (1987) Soifer, B.T., Sanders, D.B., Madore, B.F., Neugebauer, G., Danielson, G.E., Elias, J.H., Lonsdale, C.J., & Rice, W.L. 1987, ApJ, 320, 238
- Steel et al. (1996) Steel, S.J., Smith, N., Metcalfe, L., Rabbette, M., McBreen, B. 1996, A&A, 311, 721
- Vacca, Johnson, & Conti (2002) Vacca, W.D., Johnson, K.E., & Conti, P.S. 2002, AJ, 123, 772
- Wainscoat et al. (1992) Wainscoat, R.J., Cohen, M., Volk, K., Walker, H.J., & Schwartz, D.E. 1992, ApJS, 83, 111

| Weighting | UV-Range | Synth. Beam | P.A. | RMS noise | |
|---|---|---|---|---|---|
| (cm) | (robust value) | (k) | () | () | (mJy/beam) |
| 1.3 | 0 | 50-250 | -86 | 0.05 | |
| 3.6 | 5 | 50-250 | -88 | 0.05 | |
| 3.6 | 5 | 20-1000 | -83 | 0.02 |
| Mstars | |||||
|---|---|---|---|---|---|
| Source | (mJy) | (mJy) | (s-1) | () | |
| A1 | 2.1 | 3.5 | |||
| A2 | 3.2 | 5.3 | |||
| A3 | 0.3 | 0.5 |
| Mstars | |||||
|---|---|---|---|---|---|
| Region | () | (mJy) | (s-1) | ||
| A1+A2 | 11 | 2.8 | |||
| A3 | 0.2 | 0.2 | |||
| B1 | 0.8 | — | — | ||
| B2 | 0.2 | 0.2 |