11email: (jka,olech,pych,alex)@camk.edu.pl 22institutetext: Carnegie Institution of Washington, 813 Santa Barbara Street, Pasadena, CA 91101, USA
22email: ian@ociw.edu 33institutetext: Las Campanas Observatory, Casilla 601, La Serena, Chile
33email: wojtek@lco.cl
Cluster AgeS Experiment. Catalog of Variable Stars in the Globular Cluster Centauri
We present results of a photometric survey for variable
stars in the field of the globular cluster Centauri. The
observed region was centered roughly on the cluster core and covered
644 arcmin2. The cluster was monitored on 59 nights in 1999 and
2000. A total of 117 new variables were identified. Among them there
are 16 RR Lyr-type stars, 35 SX Phe variables and 26 eclipsing
binaries.
A comprehensive catalog including all variable stars so far reported
from the cluster field is presented. We list basic photometric
properties and provide finding charts for a total of 392 objects. For
313 of them new light curves were obtained.
The presented sample includes several interesting variables, such as
SX Phe stars with extremely short periods of pulsation and several
candidates for pulsating K giants. Optical counterparts to 9 X-ray sources
detected by XMM and Chandra telescopes were identified: all of them
are likely to be foreground variables not related to the cluster.
Key Words.:
stars: variables: general – binaries: eclipsing – globular clusters: individual: NGC 5139 – RR Lyrae variables, SX Phe variables1 Introduction
The Cluster AgeS Experiment (CASE) is a long term project aiming at determination of accurate ages and distances of nearby globular clusters (GC) by using observations of detached eclipsing binaries (Paczyński 1997). The project consists of two parts. The first part is an extensive photometric survey of about 10 Galactic GCs with the aim of identifying eclipsing binaries (EB) located near or below the main-sequence turnoff (MSTO). The survey is conducted on the 1.0-m Swope telescope at Las Campanas Observatory. The second part of the project is devoted to determination of absolute parameters (masses, radii, ages and luminosities) of selected EBs. It includes derivation of precise radial velocity curves as well as photometric follow up observations in the optical and near IR domain. The spectroscopic data are currently being collected, mainly using the 6.5-m Clay and Baade telescopes at Las Campanas Observatory. The only system for which we have published a complete analysis so far is OGLEGC17=V212 in Cen (Thompson et al. 2001; Kaluzny et al 2002).
Cen = NGC 5139 = [, , ; Harris 1996] is the most luminous and most massive of all known Galactic GC. An early survey of that cluster conducted by Niss et al. (1978) led to identification of the eclipsing binary NJL-5, which was in fact the first variable of this type discovered in any globular cluster. Several EBs were subsequently located in Cen as results of a side project conducted by the OGLE-I team (Kaluzny et al. 1996; Kaluzny et al. 1997a; Kaluzny et al. 1997b). In this contribution we present the results of an extensive photometric search aimed at detection of additional variables in the cluster field.
2 Observations
In the interval from 1999 February 6/7 to 2000 August 9/10 we carried out CCD photometry on the 1.0-m Swope telescope at Las Campanas Observatory. The data were collected on 59 nights. The telescope was equipped with the SITe3 2k4k CCD camera with an effective field of view arcmin2 (20483150 pixels were used), at a scale of 0.435 arcsec/pixel. Two partly overlapping fields, East and West, covering the central part of the cluster were monitored. The full size of the surveyed area was equal to 644 arcmin2.
For the East field we obtained 761 and 199 exposures in the and filters, respectively. For the West field we obtained 594 and 204 exposures in the and filters, respectively. Exposure times were 90 s to 300 s for the filter and from 150 s to 350 s for the filter, depending on the atmospheric transparency and seeing conditions. Median values of the exposure time were 140 s and 200 s for and filters, respectively. The median value of the seeing in the analyzed frames was 1.2 arcsec.
In addition to the observations listed above we have also obtained for each of two monitored fields a number of short exposure frames. These data, aimed at search for relatively bright variables, will be discussed in a separate contribution.
3 Data reduction
3.1 Initial reductions
Preliminary processing of the raw CCD frames was performed using tasks from the IRAF package.111iraf is distributed by the National Optical Astronomy Observatories, which is operated by the Association of Universities for Research in Astronomy, Inc., under a cooperative agreement with the National Science Foundation. At that stage we also used the IRAF task to correct for a slight non-linearity of the CCD camera.
To search for variables and to obtain their light curves we employed the image subtraction package ISIS V2.1 (Alard and Lupton 1998, Alard 2000). As demonstrated by Olech et al. (1999a) ISIS is capable of detecting more variables in the central regions of GCs than surveys based on profile photometry software such as DAOPHOT or DOPHOT. In our analysis we have followed a procedure described in some detail in Mochejska et al. (2002). Frames with seeing of about 0.9 arcsec taken during ,,dark time” were selected as reference images. Template images were constructed for every field and filter combination by stacking 20 good quality frames which were first geometrically transformed to the common grid defined by an appropriate reference image. Before performing image subtraction each template image was divided into four slightly overlapping sub-images. All analyzed frames were divided the same way. This procedure helped minimize effects introduced by variability of the point spread function across a given image. The sub-images were remapped to the template sub-frame coordinate system using a second-order polynomial transformation (degree = 2). During this step, initial rejection of cosmic rays was also performed (cosmic_thresh = 1.0). Differential brightness variations of the background were fitted with a second order polynomial transform (deg_bg = 1). A convolution kernel varying quadratically with position was used (deg_spatial=2).
3.2 Search for variables
To search for variables we used find and detect procedures included in the ISIS package. In particular, detect constructs two diagnostic images for a list of residual images resulting from the subtraction procedure. The VAR image is the median of the residual images and ABS is the median of the absolute values of the residual images. find uses these two diagnostic images and returns a list of potential variables and their positions on the template image. To increase the chance of finding low ,,duty cycle” variables we divided our set of frames into 20 subsets which were then analyzed separately. 222By ,,duty cycle” we mean the fraction of time in which a given star shows luminosity other than its median luminosity. Examples of stars with high and low ,,duty cycles” are RR Lyr stars and detached eclipsing binaries with narrow eclipses, respectively. Each subset contained images from 2-4 consecutive nights. A separate search was performed for the full list of available images. The list of candidate variables was increased by adding all stars lying within the blue straggler region of the cluster color-magnitude diagram. This was done in order to identify low amplitude SX Phe stars and contact binaries which are quite common among blue stragglers.
For each potential variable, its light curve expressed in ADU units was extracted using the phot task of the ISIS package. The search for periodic signals in these light curves was performed using a program based on the anova statistic introduced by Schwarzenberg-Czerny (1996). Each light curve, phased with the most probable period, was then examined by eye.
3.3 Conversion of light curves to instrumental magnitudes
The ISIS package allows extraction of light curves expressed in differential counts. Conversion of a light curve for a given object to magnitude units is possible provided that one is able to derive the total flux of that star on the template image. This can be accomplished by deriving profile photometry and an appropriate aperture correction for a given field. We used the DAOPHOT/ALLSTAR package (Stetson 1987) along with the DAOGROW program (Stetson 1990) to perform this job. Some of the variables identified with the ISIS software were located in the highly crowded region near the cluster core or in the vicinity of some saturated stars. For such objects ALLSTAR was unable to provide reliable magnitudes and their light curves were left in differential ADU units.
3.4 Transformation to the standard system
Transformation from the instrumental magnitudes to the standard system was established based on observations of several Landolt (1992) fields obtained in 1999 and 2000 seasons. It was found that the instrumental system was very stable over two observing seasons. Therefore the color terms of the transformation were derived by averaging results obtained on several photometric nights. The following relations were adopted:
| (1) | |||
| (2) |
where is the airmass and lower case letters correspond to the instrumental magnitudes. The extinction coefficients were derived based on the data collected on the night of 1999 Jun 19/20. Twenty nine observations of 26 stars from 5 Landolt fields were obtained on that night333One of the fields was observed twice. Landolt list of standards was extended by adding 4 objects from Stetson (2000).. The standard fields were observed at air-masses spanning the range 1.07-1.71. In Fig. 1 we show the residuals of the standard stars resulting from the above transformations.
3.5 Astrometry
Transformation from rectangular frame coordinates to equatorial coordinates was derived based on positions of a set of bright stars selected from the proper motion study published by van Leeuwen et al. (2000). We used 1976 and 1320 transformation stars for fields W and E, respectively. The adopted frame solutions reproduce the equatorial coordinates of Leeuwen et al. (2000) with residuals rarely exceeding 0.6 arcsec.
4 The catalog
4.1 Basic properties of the variables
Clement et al. (2001) list 293 variable stars in the field of Centauri. Stars V28, V31, V37 and V93, after work of Bailey (1902), are marked as ”not variable” – our photometry confirms that finding. We found that also the objects V176, V187, V188, V189, V190, V191, V193, V278, V279 and V290 show no signs of variability. Additionally, some of variables listed by Clement et al. (2001) are included twice in their catalog (V256 is the same as V231, V262=V216, V286=V94 and V287=V169). There are a total of 275 genuine variables in the field of Centauri which are listed in the paper of Clement et al. (2001). Sixty of them were located outside the field covered by our survey. Additionally, images of 19 bright variables were severely saturated in our images and as result no photometry could be obtained for these objects. We present light curves for a total of 196 out of 275 objects included in the catalog of Clement et al. (2001). We also report identification and provide light curves for 117 newly identified variables. Among them are 17 RR Lyr-type stars, 35 SX Phe variables and 26 eclipsing binaries.
Table 1 presents some basic data for a total of 392 variables identified so far in the field of Centauri444The full version of Table 1 is only available at the CDS. The columns of this table are as follows:
-
•
Star: Star number. Numbering scheme of variables V1–V293 is taken from Clement et al. (2001). Objects designated as ”NV” are new discoveries.
-
•
RA: Right ascension of the star for epoch J2000.0
-
•
Decl.: Declination of the star for epoch J2000.0.
-
•
Period: Period of variability in days. For the majority of previously known variables, this quantity is taken from Martin (1938), Sawyer Hogg (1973) or Kaluzny et al. (1996, 1997a,b). In cases where their period does not fit the data, we provide a new determination. For variables NV294–NV410 the period was derived using the anova statistics of Schwarzenberg-Czerny (1996).
-
•
: Maximal brightness in the -band.555 For stars which are located outside of the OGLE and CASE fields, the and (photographic) magnitudes are taken from Dickens and Carey (1967) or Geyer and Szeidl (1970). For the remaining variables we present the maximum and minimum photographic () magnitudes from Martin (1938) or Sawyer (1955). Since these are blue sensitive, they are designated as ‘B’ in Table 1.
-
•
: Minimal brightness in the -band.4
-
•
: Intensity averaged mean magnitude of the star. This field is left empty for eclipsing binaries.4
-
•
: Intensity averaged mean magnitude of the star or maximal brightness in the -band for eclipsing binaries.
-
•
Type: Type of variability. Below we list the meanings of the symbols used:
-
–
RR0: fundamental mode RR Lyr star (RRab)
-
–
RR1: 1st overtone RR Lyr star (RRc). In fact, all RR Lyr stars which were not classified as fundamental mode pulsators were designated as RR1. Clement and Rowe (2000) identified as many as 21 possible second overtone pulsators (RR2) in Cen but detailed analysis of the light curves of these stars indicates that they are mostly RR1 stars with strong non-radial peaks (Olech et al., in preparation)
-
–
SX: SX Phe type variable
-
–
EA: detached eclipsing binary, out of eclipses light curve is flat
-
–
EB: eclipsing binary, out of eclipses light curve is not flat
-
–
EW: contact binary (W UMa type variable)
-
–
C: population II Cepheid
-
–
ell: candidate ellipsoidal variable
-
–
irr: irregular light curve
-
–
SR: semi-regular variable
-
–
sp: candidate spotted variable
-
–
BL: BL Her type star
-
–
LT: long-term irregular or long-period variable
-
–
CV: candidate cataclysmic variable
-
–
RV: RV Tauri type star
-
–
-
•
Other design.: Designations used in some previous studies of variable stars in Centauri (e.g. Kaluzny et al. 1996, 1997a, 1997b; Niss et al. 1978).
-
•
Remarks: General remarks, where the following symbols mean:
-
–
pc: period change
-
–
mp: multi-periodic star
-
–
Bl: Blazhko effect
-
–
out: star located out of our field
-
–
non var: no traces of variability in our data
-
–
saturated: stellar image saturated in one or two bands
-
–
| Star | RA [2000] | Decl. [2000] | Period | Type | Other | Remarks | ||||
| [days] | design. | |||||||||
| V1 | 13 26 05.26 | 47 23 42.8 | 29.3479 | 10.40 | 11.55 | 10.89 | 11.66 | RV | saturated | |
| V2 | 13 26 12.65 | 47 24 41.9 | 235.74 | 12.5: | 16.61 | 13.825 | 14.631 | LT | GC23 | |
| V3 | 13 25 56.15 | 47 25 53.8 | 0.841258 | 14.01 | 14.76 | 14.389 | 14.907 | RR0 | GC184 | |
| V4 | 13 26 12.93 | 47 24 18.8 | 0.627320 | 13.83 | 14.87 | 14.453 | 14.905 | RR0 | GC99 | |
| V5 | 13 26 18.33 | 47 23 12.4 | 0.515274 | 14.0: | 15.15 | 14.745 | 15.235 | RR0 | GC101 | Bl |
| V6 | 13 26 30.24 | 47 24 28.4 | 110: | 13.84 | 15.24 | - | 14.363 | LT | saturated in | |
| V7 | 13 27 00.90 | 47 14 00.5 | 0.7130 | 14.08 | 15.01 | 14.59 | - | RR0 | GC87 | out |
| V8 | 13 27 48.45 | 47 28 20.3 | 0.521329 | 13.90 | 15.16 | 14.683 | 15.061 | RR0 | GC199 | |
| V9 | 13 25 59.58 | 47 26 24.0 | 0.523480 | 14.1: | 15.19 | 14.756 | 15.274 | RR0 | GC183 | Bl |
| V10 | 13 26 06.99 | 47 24 36.6 | 0.374976 | 14.31 | 14.68 | 14.484 | 14.902 | RR1 | GC98 | |
| B - magnitudes available only | ||||||||||
4.2 The finding charts
The finding charts for all known or suspected variables located in the field of Centauri are shown in Fig. 2666Figure 2 is only available in electronic form at http://www.edpsciences.org. For variables placed out of our fields charts were created using template frames of Kaluzny et al. (1996, 1997a,b) or DSS777 The Digitized Sky Survey was produced at the Space Telescope Science Institute under U.S. Government grant NAG W-2166. The images of these surveys are based on photographic data obtained using the Oschin Schmidt Telescope on Palomar Mountain and the UK Schmidt Telescope. The plates were processed into the present compressed digital form with the permission of these institutions. images. The finding charts based on images from our survey or from Kaluzny et al. (1996, 1997a, 1997b) have size . Charts based on the DSS images have size . On all charts north is up and east is to the left.
4.3 Comparison with OGLE data
For a total of 173 variables observed in our survey photometry was also published by the OGLE-I group (Kaluzny et al. 1996, 1997a, 1997b). Differences in mean magnitudes for these variables are plotted in Fig. 3. The mean difference in the sense of is mag. Moreover, one can see that vs. relation shown in Fig. 3 is not flat. Fitting straight line to the data from Fig. 3 gives the following relation:
| (3) |
The mean magnitudes of bright stars ( mag) are close to each other in both compared data sets. A substantial difference of mag is observed for fainter variables with . The likely source of such a discrepancy is nonlinearity of the CCD camera used by the OGLE-I group (Paczyński et al. 1999).
4.4 Some interesting objects and location of variables on the CMD
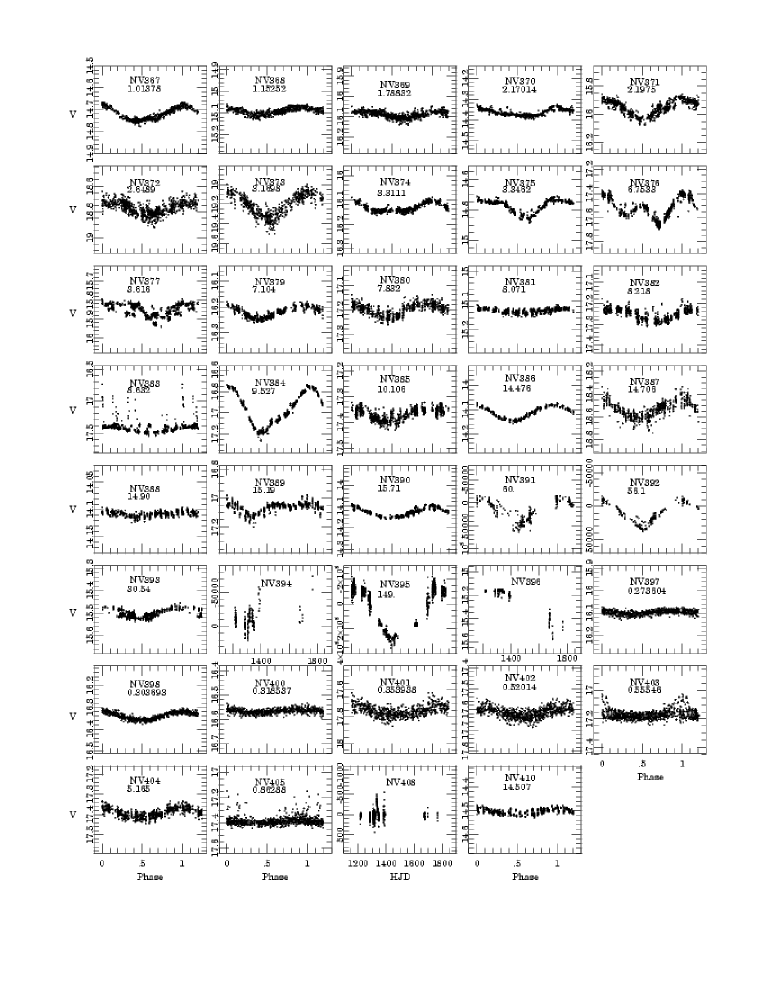
Phased light curves of 117 newly identified variables are presented in Figures 4, 5, 6 and 7 which show RR Lyr, SX Phe, eclipsing binaries and remaining types of variables, respectively. Note that in some cases light curves are displayed in differential counts units.
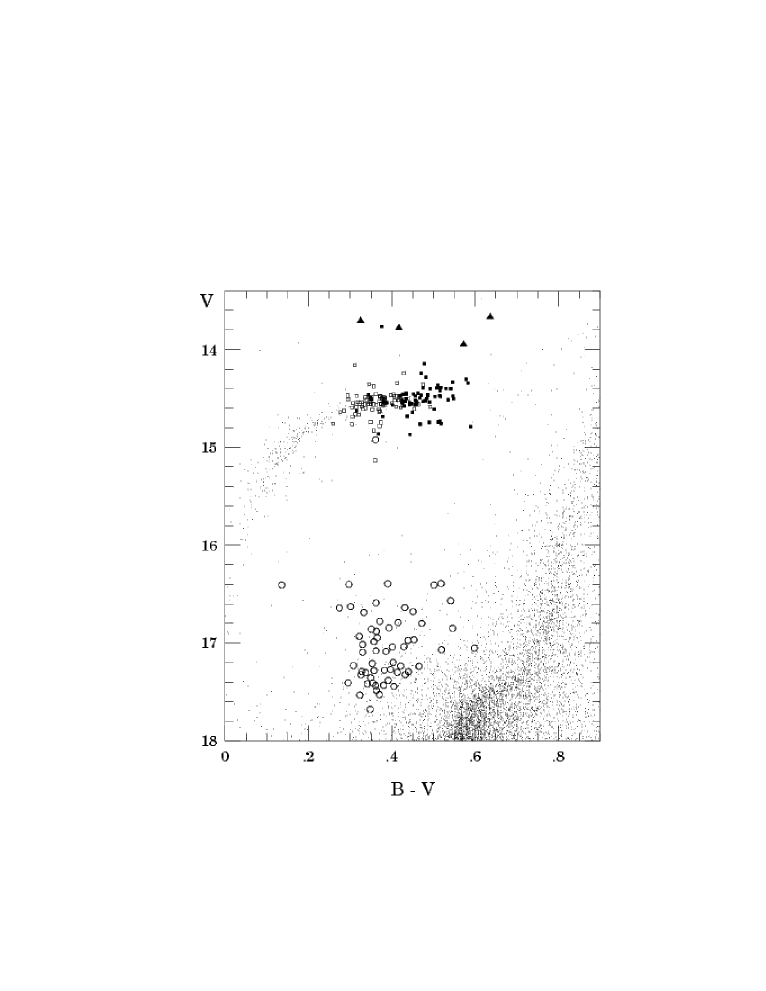
Figure 8 shows positions of RR Lyr and SX Phe variables from Table 1 in the color-magnitude diagram of the cluster. The brightest of SX Phe star, V65, is a foreground object (see Sec. 5). We also note that the color of the formally bluest of the SX Phe stars, variable NV321 , is very uncertain.
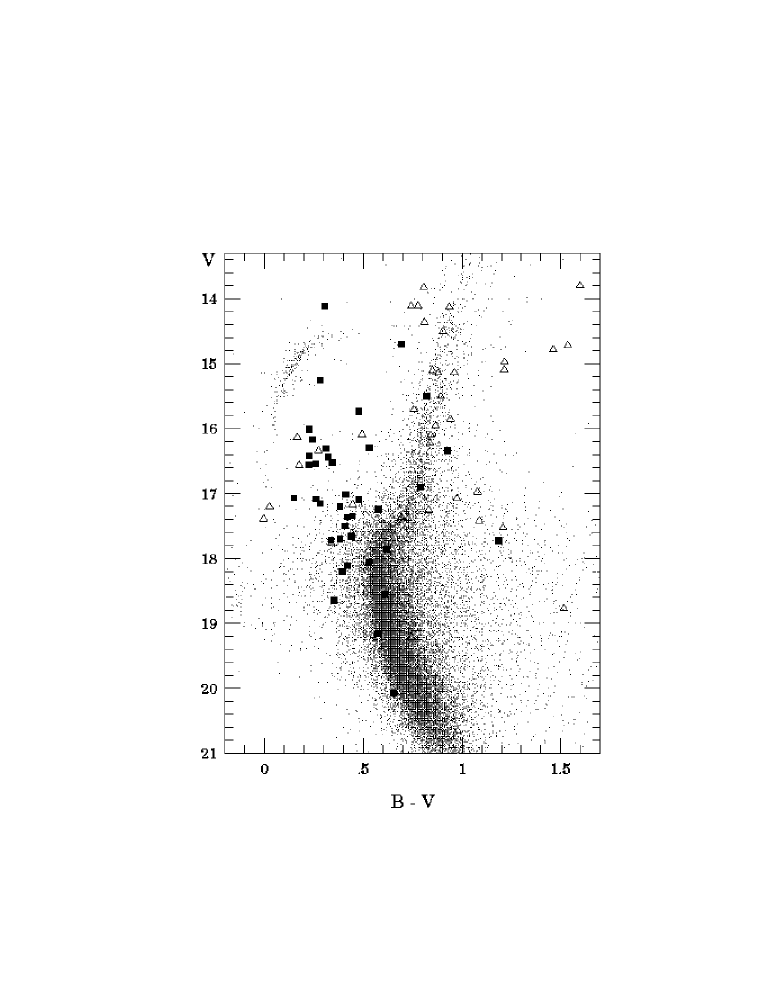
Figure 9 presents the color-magnitude diagram of Cen with positions of all objects from Table 1 marked apart from RR Lyr and SX Phe variables. Eclipsing binaries are denoted with squares while triangles denote other classes of variables. About 50% of variables are located in the region occupied by cluster blue stragglers (BS). In particular one can notice presence of a group of relatively bright BS candidates with . Membership status of these stars, as well as other variables, can be determined relatively easily by measuring their radial velocities. We note that the cluster itself has large radial velocity km/s (Harris 1996) and therefore field interlopers are relatively easy to distinguish from the cluster members.
There are several interesting objects among newly identified variables. For example, NV294 and NV295 are the shortest period SX Phe type stars known. Up to now the shortest period variable of this type was V10 from NGC6397 (Kaluzny and Thompson 2003). Objects NV361, NV362 and NV363 are probably main-sequence detached eclipsing binaries. They may turn out to be excellent targets for follow up spectroscopic study aimed at determination of the age and/or distance to the cluster (Thompson et al. 2001, Kaluzny et al. 2002). RRc type variables NV339, NV340, NV342, NV351 and NV399 are likely members of the recently identified group of non-radial pulsators (Olech et al. 1999a, 1999b, 2001, Clement and Rowe 2000). Variable NV383 shows regular modulations with a period of 8.6 days superimposed with mag outbursts or flares occurring on a time scale of tens of days.
Among RR Lyr variables with known period we list 86 RR0 and 100 RR1. Evidence of period change was found in 14 RR1 and one RR0. For these variables it was not possible to fit one period to all of the data. Often this change amounts to as little as . However, its correlation with the RR1 type is impressive: the probability of getting at least 14 RR1 stars by random drawing 15 stars from our sample is as little as . A detailed analysis of RR Lyr type variables in the fields of Cen will be given in a forthcoming paper (Olech et al., in preparation).
Two variables, NV380 and NV404, are located among stars forming an extreme horizontal branch (equivalent to population of field sdB star) in the color-magnitude diagram. They show low amplitude sine-like light curves with periods of 7.8 d and 5.2 d for NV380 and NV404, respectively. It is well established that sdB stars are formed in binary systems (eg. Morales-Rueda et al. 2003) and therefore it is likely that observed variability of NV380 and NV404 is related to their binarity.
In Fig. 9 one may note the presence of several variables distributed along the red giant branch of the cluster. About a dozen of these variables show low amplitude, periodic light curves with and d. At least some of these stars are likely analogues of variable K giants identified in 47 Tuc by Edmonds & Gilliland (1996). It has been speculated that the underlying source of variability of 47 Tuc K giants are low-overtone pulsations. Particularly interesting is NV397 whose light curve is modulated with an extremely short, as for a giant star, period of d.
5 X-ray counterparts
Omega Centauri is known to posses a rich population of X-ray sources. Recently, the Chandra telescope observed arcmin2 field centered approximately on the cluster core. Cool et al. (2002) reported detection of over 140 sources in that field. Unfortunately they have so far not published coordinates of these objects, which makes the search for optical counterparts difficult. Rutledge et al. (2002) independently analyzed Chandra observations and published accurate coordinates of 37 X-ray sources from the cluster field. Gendre at al. (2003) reported identification and coordinates of 146 X-ray sources inside a arcmin2 field observed by the XMM-Newton telescope. Position errors for these sources, as derived from XMM images, range from a fraction of arcsec up to over 40 arcsec with a median value of 5.4 arcsec. As noted by the authors an additional source of uncertainty is the systematic error of the pointing direction of satellite which is estimated at 4 arcsec. For 64 XMM sources Gendre at al. (2003) were able to identify their Chandra counterparts and consequently provide accurate coordinates with uncertainty of the order of 1 arcsec.
In Table 2 we list candidates for optical counterparts of X-ray sources which were selected by cross-correlation of our catalog of variables with objects from Gendre at al. (2003; their Table 3) and Rutledge et al. (2002; their Table 1). All optical variables with counterparts identified among sources from Gendre at al. (2003) have also counterparts among objects listed in Rutledge et al. (2002).
The objects corresponding variables NV367=XMM-3 and NV375=XMM-7 were earlier reported by Cool et al. (1995) as optical counterparts of Einstein-HRI sources D and A, respectively888 Einstein sources D and A correspond to ROSAT sources 4 and 3, respectively (Verbunt & Johnston 2000).. Cool et al. (1995) obtained optical spectra of both stars and concluded that they were foreground dM2e-dM3e dwarfs. We note that NV367 and NV375 show rather stable sine-like light curves with a peak-to-peak range of about 0.1 mag in the -band. Stability of the light curves on a time scale of one year points toward binarity as a cause of the observed variability.
Variable N378=XMM-31 is a detached eclipsing binary whose location on the cluster color-magnitude diagram indicates that it is a foreground object.
The optical light curve of star NV383=XMM-95 shows modulation with P=8.63 d with superimposed occasional ,,flares” lasting a few hours and having amplitudes of a few tenths of magnitude. This variable, as well as the remaining stars included in Table 2, are most likely field objects not related to the cluster. This conclusion is based on the observed location of these stars on the cluster color-magnitude diagram. It is also in agreement with the proper motion study of van Leeuwen et. al (2000). Variables V167, V223, NV367, NV375 and NV378, which are bright enough to be included in that study, have probability of membership in range of 0–2% and most probably are not cluster members.
| XMM | CASE | |
|---|---|---|
| [arcsec] | ||
| 3 | 367 | 1.7 |
| 7 | 375 | 1.3 |
| 25 | 167 | 1.0 |
| 29 | 223 | 2.1 |
| 31 | 378 | 1.2 |
| 33 | 376 | 3.1 |
| 68 | 377 | 0.4 |
| 74 | 369 | 1.5 |
| 95 | 383 | 2.5 |
6 Summary
An extended survey of the central part of Cen led to identification of 117 new variables. We present light curves for 110 of them along with light curves for 196 previously known variables.
Photometry presented in this paper will be discussed in some detail in separate contributions devoted to specific classes of variables. A paper aimed at calibration of absolute magnitude for RRab and RRc stars has already been published (Olech et al. 2003) and the paper about SX Phe-type variables in Cen is in preparation.
We are in a process of obtaining spectroscopic data suitable for checking the membership status of detached EBs identified to date in the cluster field.
The electronic version of this catalog is available via Internet at the following home page of the CASE project: http://case.camk.edu.pl
Acknowledgements.
ASC, JK, WK and WP were supported by KBN grant 5 P03D004.21. AO was supported by KBN grant 2 P03D024.22. We are grateful to the referee Dr. Christine Clement for her helpful comments and suggestions.Appendix A: Notes on individual variable stars
-
V1 Photographic and data listed are from Dickens and Carey (1967).
-
V6: Saturated in the -band. Light curve transformed into magnitudes only for the -band. Photographic photometry listed after Martin (1938).
-
V7: Out of surveyed field. Finding chart and photometric data based on Kaluzny et al. (1997b)
-
V17: Light curve transformed into instrumental magnitudes only for the band. The star is saturated in our images for the V band. The photometric data listed are data from Martin (1938). Sawyer Hogg (1973) classified this star as an irregular and listed a period of 64.725 days, but the 64 day period does not fit our data for the band.
-
V22: Clear change of period from 0.39606(3) to 0.39624(6) days between 1999 and 2000 seasons.
-
V23: Variable present in both surveyed sub-fields.
-
V29 Photographic and data listed are from Dickens and Carey (1967).
-
V30: Clear change of period from 0.40441(6) to 0.40410(10) days between 1999 and 2000 seasons.
-
V36: Out of surveyed field. Finding chart and photometry based on Kaluzny et al. (1996).
-
V48: Saturated in . Light curve transformed into magnitudes only for the -band. Photographic and data listed are from Dickens and Carey (1967).
-
V52: Jurcsik et al. (2001) classified this star as ”above horizontal branch” because it is significantly brighter than the RR Lyrae variables. Our data indicate that it is RRab star. According to van Leeuwen et al. (2000) the probability of membership for this variable is only 45% and most probably it is a foreground star. Its low amplitude, compared with other stars of the same period, may suggest high metallicity.
-
V55: Out of surveyed field. Finding chart based on DSS. Photometric data listed after Geyer and Szeidl (1970).
-
V58: Change of period from 0.36988(2) to 0.36975(6) days between 1999 and 2000 seasons.
-
V63: Out of surveyed field. Finding chart based on DSS. Photometric data listed after Geyer and Szeidl (1970).
-
V65: This variable corresponds to the star number 60026 from the proper motion study of van Leeuwen et al. (2000). The probability of membership for this variable is 0%, thus is must be a foreground star.
-
V66: Change of period from 0.40727(3) to 0.40761(9) days between 1999 and 2000 seasons.
-
V68: Change of period or phase shift between 1999 and 2000 seasons. The period changed from 0.53461(2) to 0.53509(9) days
-
V69: Out of surveyed field. Finding chart based on DSS. Photometric data listed after Geyer and Szeidl (1970).
-
V72-V73: Out of surveyed field. Finding chart based on DSS. Photometric data listed after Geyer and Szeidl (1970).
-
V79: Out of surveyed field. Finding chart and photometric data based on Kaluzny et al. (1996).
-
V80: Out of surveyed field. Finding chart based on DSS. Photometric data listed after Sawyer (1955).
-
V84-V85: Out of surveyed field. Finding chart and photometric data based on Kaluzny et al. (1996).
-
V89: Change of period from 0.37511(7) to 0.37475(13) days between 1999 and 2000 seasons. Variable present on both surveyed sub-fields.
-
V90: Variable present on both surveyed sub-fields.
-
V91: Variable present on both surveyed sub-fields.
-
92: Based on observations made in the early 1930s, Martin (1938) derived a period of 1.3450659 days. Our data for the 1999-2000 seasons indicate that the period is significantly longer, 1.34604(34) days, in agreement with the period change rate, days per Myr derived by Jurcsik et al. (2001)
-
V94: Our coordinate for this star () differs from the value () published by Martin (1938). This star is the same as V286. Multi-periodic.
-
V110: Multi-periodic. The period of 0.3221021 days listed by Martin (1938) does not fit our data.
-
V111: Variable present in both surveyed sub-fields.
-
V114: Variable present in both surveyed sub-fields.
-
V129: Light curve transformed into instrumental magnitudes only for the band. The star is saturated in our images for the band.
-
V131: Clear change of period from 0.39225(5) to 0.39198(8) days between 1999 and 2000 seasons.
-
V133: Out of surveyed field. Finding chart based on DSS. Photographic magnitudes given after Martin (1938).
-
V134: Out of surveyed field. Finding chart based on DSS. Photometric data given after Geyer and Szeidl (1970).
-
V135: The light curve is noisy. Possibly multi-periodic star.
-
V140: Sawyer (1955) indicated that this variable has a short period, but did not determine a value. Our data indicate that it is RRab star showing very strong Blazhko effect.
-
V142: Sawyer (1955) indicated that this variable has a short period, but did not determine a value. Our data indicate that it is RRc star showing also pulsations in non-radial modes.
-
V144: Variable present in both surveyed sub-fields.
-
V149: Out of surveyed field. Finding chart based on DSS. Photometric data listed after Geyer and Szeidl (1970).
-
V150: Based on observations made in the early 1930s, Martin (1938) derived a period of 0.8991585 days. Our data for the 1999-2000 seasons indicate a longer period, 0.89930(3) days, in agreement with the period change rate, days per Myr derived by Jurcsik et al. (2001).
-
V151: Out of surveyed field. Finding chart based on DSS. Photometric data listed after Martin (1938).
-
V153: Martin (1938) listed period of 0.3864509 days. Our data indicate for 1999-2000 seasons the period of 0.38624(2) days.
-
V154: Martin (1938) listed period of 0.3223311 days. Our data indicate the period of 0.32234(2) days for 1999-2000 seasons. Variable present in both surveyed sub-fields.
-
V156: Change of period from 0.35913(2) to 0.35901(2) days between 1999 and 2000 seasons. Variable present in both surveyed sub-fields.
-
V157: Phase shift between 1999 and 2000 seasons. Variable present in both surveyed sub-fields.
-
V158: Martin (1938) listed period of 0.367335 days. Our data indicate for 1999-2000 seasons the period of 0.367276(3) days. Variable present in both surveyed sub-fields.
-
V159-V160: Out of surveyed field. Finding charts based on DSS. Photometric data listed after Geyer and Szeidl (1970).
-
V166: Multi-periodic. Variable present in both surveyed sub-fields.
-
V170: Out of surveyed field. Finding chart based on DSS.
-
V171-V175: Out of surveyed field. Finding charts based on DSS.
-
V176: There is a bright star at the position of V176 but in our data it shows no variability. In the catalog of Sawyer Hogg (1973) this star is classified as RRc variable.
-
V177-V183: Out of surveyed field. Finding charts based on DSS.
-
V187-V191: Variables classified as possible eclipsing binaries by Niss, Jorgensen & Laustsen (1978). No signs of variability in our data.
-
V193: Variable classified as possible eclipsing binary by Niss, Jorgensen & Laustsen (1978). No signs of variability in our data.
-
V198: Large error of the zero point for curve (expected error of about 0.1 mag).
-
V210: Variable present in both surveyed sub-fields.
-
V211: Variable present in both surveyed sub-fields.
-
V216: This variable is the same as V262 (GC22=GC95). The highest peak in the power spectrum of the light curve is found at the frequency corresponding to the period of 23.737 days. There is only marginal peak around period of 0.4881 days reported by Kaluzny et al. (1997b), thus we conclude that the true period is 23.737 days.
-
V220: Variable present in both surveyed sub-fields.
-
V229: magnitude almost the same as in the OGLE data. Our observations show the star significantly bluer than in OGLE data. Something wrong with OGLE magnitude or our magnitude determination.
-
V231: This variable is the same as V256 (GC66=GC38)
-
V233: Variable present in both surveyed sub-fields.
-
V239: Strong blending. Magnitudes and colors uncertain.
-
V242: Variable classified as eclipsing binary by Kaluzny et al. (1997a). There are no eclipses in our data.
-
V251: Period of 0.92247(15) days fits our data better than the period of 0.63093 days given by Kaluzny et al. (1997a)
-
V256: This variable is the same as V231 (GC66=GC38)
-
V262: This variable is the same as V216 (GC22=GC95)
-
V263: Variable classified as RRc star with period 0.5028 days by Kaluzny et al. (1997b). Our data indicate that it is RRab or C star with a period of 1.012158 days.
-
V265: Change of period from 0.42255(5) to 0.42309(7) days between 1999 and 2000 seasons.
-
V269: Variable classified as C or BL Her star with period close to one day by Kaluzny et al. (1997b). Our data indicate that it is a long term variable with a period of about 145 days.
-
V270: The period given by Kaluzny et al. (1997b) is 0.2381 days. Our data indicate period of 0.312714(3) days. That period fits also data of Kaluzny et al. (1997b). We conclude that the longer period is real one and thus V270 is an ordinary RRc star and not second overtone RR Lyr star as was proposed by Clement and Rowe (2000).
-
V271: Change of period from 0.44298(5) to 0.44339(9) days between 1999 and 2000 seasons. Variable present in both surveyed sub-fields.
-
V274: Variable present in both surveyed sub-fields.
-
V275: Multi-periodic. Variable present in both surveyed sub-fields.
-
V278-V279: Variables classified as possible C by Kaluzny et al. (1997b). Both stars had periods very close to one day and had noisy light curves. No signs of variability in our data.
-
V286: This variable is the same as V94.
-
V287: This variable is the same as V169
-
V290: Variable classified as possible RRab star by Kaluzny et al. (1997b). No signs of variability in our data.
-
V292: Variable number 50259 in van Leeuwen et al. (2000).
-
V293: Variable number 55071 in van Leeuwen et al. (2000).
-
NV294: Very low amplitude SX Phe variable. It is placed in the blue straggler region of the CMD.
-
NV295: Very low amplitude SX Phe variable. It is placed in the blue straggler region of the CMD. Other possible period is 0.0185707 days.
-
NV296: Very low amplitude SX Phe variable. It is placed in the blue straggler region of the CMD.
-
NV297: Very low amplitude SX Phe variable. It is placed in the blue straggler region of the CMD. Power spectrum indicates presence of at least two distinct frequencies in the light curve.
-
NV302: Other possible value of the main period is 0.035516 days. Probably multi-periodic star.
-
NV303: Other possible value of the main period is 0.035950 days. Probably multi-periodic star.
-
NV311: Variable placed in the crowded region. Light curve left in differential ADU counts.
-
NV312: Other possible value of the main period is 0.041527 days.
-
NV313: Fundamental mode pulsator.
-
NV314: Three bright stars near variable found. Zero point in -band determined with uncertainty of 0.05 mag.
-
NV315: Multi-periodic. Variable present in both surveyed sub-fields.
-
NV317: Multi-periodic. Other possible period is 0.0427515 days.
-
NV320: Variable present in both surveyed sub-fields.
-
NV321: Variable present in both surveyed sub-fields Magnitudes and color uncertain due to strong blending.
-
NV324: Fundamental mode pulsator.
-
NV326: A classic double mode star.
-
NV327: Variable present in both surveyed sub-fields.
-
NV329: Low amplitude contact binary or ellipsoidal variable. Variable placed in the crowded region. Light curve left in differential ADU counts.
-
NV330: Variable placed in the crowded region. Light curve left in differential ADU counts.
-
NV333: Faint variable placed in the crowded region. Light curve left in differential ADU counts.
-
NV337: Very strong blending in . Difficulties in deriving the -band light curve. It may also be a sdB star.
-
NV343: Variable present in both surveyed sub-fields.
-
NV346: Variable present in both surveyed sub-fields.
-
NV347: Variable present in both surveyed sub-fields.
-
NV348: The light curve in -band is noisy. -band light curve is more stable. Variable present in both surveyed sub-fields.
-
NV349: Due to the vicinity of bright companion star we were only able to obtain a light curve in the -band and only in differential ADU counts.
-
NV351: Multi-periodic. Variable placed in the crowded region. Light curve left in differential ADU counts.
-
NV352: The star located in the vicinity of bright and saturated star. The magnitude and color determinations may be uncertain.
-
NV353: Multi-periodic. Variable identified in both surveyed sub-fields. Poor photometry for East sub-field due to the position near edge of the frames.
-
NV356: Variable placed in the crowded region. Light curve left in differential ADU counts.
-
NV366: Variable with period very close to 1 day. Our observations cover the light curve only near maximum. The formally derived mean magnitude of the star is therefore overestimated.
-
NV370: Other possible period is 1.78786 days.
-
NV372: Other possible period is 2.6302 days.
-
NV373: Other possible period is 1.4571 days.
-
NV378: Eclipsing binary with light curve likely affected by chromospheric activity.
-
NV379: Other possible period is 7.225 days.
-
NV383: Periodic variable with quasi-periodic outbursts.
-
NV387: Two bright stars in the vicinity of the variable. Difficulties in deriving -band light curve.
-
NV389: The light curve can be phased with an alternative period of 30.39 d. In such a case the variable would be classified as an eclipsing binary.
-
NV391-392: Variable saturated in the -band. Only -band light curve available.
-
NV394: Variable saturated in the -band. Only -band light curve available.
-
NV395: Variable located in a crowded region. -band light curve left in differential ADU counts.
-
NV403: Suspected variable with quasi-periodic or non-periodic outbursts. d in 1999.
-
NV404: The light curve can be phased with an alternative period of 0.8359 d.
-
NV405: Suspected variable. Irregular ,,flares”?
-
NV406: Variable star showing rapid and deep dips in the light curve.
-
NV407: Possible eclipsing binary star with only one eclipse present in our data.
-
NV408: Variable star showing one distinct outburst in our data.
-
NV409: Possible eclipsing binary star.
-
NV410: The light curve can be phased with an alternative period of 20.165 d.
References
- (1) Alard, C., & Lupton, R.H. 1998, ApJ, 503, 325
- (2) Alard, C. 2000, A&AS, 144, 363
- (3) Bailey, S.I. 1902, Harvard Ann., 38
- (4) Clement, C.M., & Rowe, J. 2000, AJ, 120, 2579
- (5) Clement, C.M. et al. 2001, AJ, 122, 2587
- (6) Cool, A.M., Grindlay, J.E., Bailyn, C.D., Callanan, P.J., & Hertz, P. 1995, ApJ, 438, 719
- (7) Cool, A.M., Haggard, D., & Carlin, J.L. 2002, in Centauri: a unique window into astrophysics, ed. F. van Leeuwen, J. Hughes, & G. Piotto, (San Francisco: Astronomical Society of the Pacific), ASP Conf. Ser., 265, 277
- (8) Dickens, R. J. & Carey, J. V. 1967, Royal Obs. Bull., No. 129
- (9) Edmonds, P.D., & Gilliland, R.L. 1996, ApJ, 464, L157
- (10) Gendre, B., Barret, D., & Webb, N.A. 2003, A&A, 400, 521
- (11) Geyer, E.H. & Szeidl, B., 1970, A&A, 4, 40
- (12) Harris, W.E. 1996, AJ, 112, 1487
- (13) Jurcsik, J., Clement, C., Geyer, E. H. & Domsa, I. 2001, AJ, 121, 951
- (14) Kaluzny, J., Kubiak, M., Szymański, M., Udalski, A., Krzemiński, W., & Mateo M. 1996, A&AS, 120, 139
- (15) Kaluzny, J., Kubiak, M., Szymański, M., Udalski, A., Krzemiński, W., & Mateo, M., 1997a, A&AS, 122, 471
- (16) Kaluzny, J., Kubiak, M., Szymański, M., Udalski, A., Krzemiński, W., & Mateo, M., 1997b, A&AS, 125, 343
- (17) Kaluzny, J., Thompson, I.B., Krzemiński, W., Olech, A., Pych, W., & Mochejska B. 2002, ASP Conf. Ser. 265, 155
- (18) Kaluzny, J., Thompson, I.B. 2003, AJ, 125, 2534
- (19) Landolt, A.U., 1992, AJ, 104, 340
- (20) Martin, W.C., 1938, Ann. Sternw. Leiden, 17, 2
- (21) Mochejska, B., Stanek, K.Z., Sasselov, D.D., & Szentgyorgyi, A.H. 2002, AJ, 123, 3460
- (22) Morales-Rueda, L., Maxted, P.F.L., Marsh, T.R., North, R.C., & Heber, U. 2003, MNRAS, 338, 752
- (23) Niss, B., Jorgensen, H.E., & Laustsen, S. 1978, A&AS, 32, 387
- (24) Olech, A., Woźniak, P., Alard, C., Kaluzny, J., & Thompson, I.B. 1999a, MNRAS, 310, 759
- (25) Olech, A., Kaluzny, J, Thompson, I.B., Pych, W., Krzemiński, W., & Schwarzenberg-Czerny, A. 1999b, AJ, 118, 442
- (26) Olech, A., Kaluzny, J, Thompson, I.B., Pych, W., Krzemiński, W., & Schwarzenberg-Czerny, A. 2001, MNRAS, 321, 421
- (27) Olech, A., Kaluzny, J., Thompson , I.B., & Schwarzenberg-Czerny A. 2003, MNRAS, 345, 86
- (28) Paczynski, B., 1997, Space Telescope Science Series, ”The Extragalactic Distance Scale”, ed. M. Livio, Cambridge University Press, p. 273
- (29) Paczynski, B., Udalski, A., Szymański, M., Kubiak, M., Pietrzyński, G., Soszyński, I., Woźniak, P., & Żebruń K. 1999, Acta Astron., 49, 319
- (30) Rutledge, R.E., Bildsten, L., Brown, E.F., Pavlov, G.G., & Zavlin, V.E. 2002, ApJ 578, 405
- (31) Sawyer, H. B. 1955, Publ. David Dunlap Obs., 2, No. 2
- (32) Sawyer Hogg, H. 1973, Publ. David Dunlap Obs., 3, No. 6
- (33) Schwarzenberg-Czerny, A. 1996, ApJ, 460, L107
- (34) Stetson, P.B. 1987, PASP, 99, 191
- (35) Stetson, P.B. 1990, PASP, 102, 932
- (36) Stetson, P.B. 2000, PASP, 112, 925
- (37) Thompson, I.B., et al. 2001, AJ, 121, 3089
- (38) van Leeuwen, F., Le Poole, R.S., Reijns, R.A., Freeman, K.C., & de Zeeuw, P.T. 2000, A&A, 360, 472
- (39) Verbunt, F., & Johnston, H.M. 2000, A&A, 358, 910