The build–up of the red–sequence in galaxy clusters since 111Based on observations obtained at the ESO Very Large Telescope (VLT) as part of the Large Programme 166.A–0162 (the ESO Distant Cluster Survey).
Abstract
We study the rest–frame (UV) color–magnitude relation in clusters at redshifts –, drawn from the ESO Distant Cluster Survey. We confirm that red–sequence galaxies in these clusters can be described as an old, passively–evolving population and we demonstrate, by comparison with the Coma cluster, that there has been significant evolution in the stellar mass distribution of red–sequence galaxies since . The EDisCS clusters exhibit a deficiency of low luminosity passive red galaxies. Defining as ‘faint’ all galaxies in the passive evolution corrected range LL, the luminous–to–faint ratio of red–sequence galaxies varies from for the Coma cluster to for the high redshift clusters. These results exclude a synchronous formation of all red–sequence galaxies and suggest that a large fraction of the faint red galaxies in current clusters moved on to the red sequence relatively recently. Their star formation activity presumably came to an end at .
Subject headings:
galaxies: clusters: individual — galaxies: evolution — galaxies: formation — galaxies: elliptical1. Introduction
It has long been known (Visvanathan & Sandage,, 1977) that red cluster galaxies form a tight sequence in the color–magnitude diagram that, in nearby clusters, extends at least – mag fainter than the Brightest Cluster Galaxy (BCG) (De Propris et al.,, 1998). The existence of a tight color–magnitude relation (CMR) for cluster early type galaxies up to redshift , and the evolution of its slope and its zero–point as a function of redshift, are commonly interpreted as the result of a formation scenario in which cluster elliptical galaxies constitute a passively evolving population formed at high redshift (–) (Ellis et al.,, 1997; Stanford, Eisenhardt, & Dickinson, 1998; Gladders et al.,, 1998). In this model, the slope of the relation reflects metallicity differences and naturally arises through the effects of supernova winds (Kodama et al.,, 1998). An alternative explanation has been proposed by Kauffmann & Charlot, (1998, see also ()). In this model, elliptical galaxies form through mergers of disk systems and a CMR arises as a result of the fact that more massive ellipticals are formed by mergers of more massive, and hence more metal rich, disk systems.
The homogeneity of cluster elliptical galaxies should, however, be contrasted with the increasing observational evidence that red passive galaxies in distant clusters constitute only a subset of the passive galaxy population in clusters today (van Dokkum and Franx,, 1996). Distant clusters contain significant populations of galaxies with active star formation, that must later have evolved on to the CM sequence after their star formation activity was terminated, possibly as a consequence of their environment (Smail et al.,, 1998; Dressler et al.,, 1999; Poggianti et al.,, 1999).
In this Letter we present the CMR for clusters in the redshift interval – from the ESO Distant Cluster Survey (hereafter EDisCS). In the following, we use: , and .
2. The data
EDisCS is an ESO Large Programme aimed at the study of cluster structure and cluster galaxy evolution over a significant fraction of cosmic time. The complete EDisCS dataset provides homogeneous photometry and spectroscopy for clusters at redshift and clusters at redshift . In this Letter we present results for clusters at redshift (cl– and cl–), (cl–), and (cl–).
The clusters used in this analysis have been imaged in V, R, and I with FORS2 () on the ESO Very Large Telescope (VLT). The average integration times used were m in the I–band, and m in the V–band. Multi–object spectroscopy was carried out using FORS2 on VLT. The clusters in the high redshift sample (that includes those used in this study) have also been imaged in J and K (SOFI-NTT, ). A brief description of the cluster sample selection is given in Rudnick et al., (2003). All data and details about their analysis will be presented in forthcoming papers (White et al, Halliday et al., Aragón-Salamanca et al., in preparation). The number of spectroscopically confirmed members for the clusters presented in this analysis ranges from (cl–) to (cl–).
Object catalogs have been created using the SExtractor software (Bertin & Arnouts,, 1996) in ‘two–image’ mode using the I–band images as detection reference images. In the following, we will use magnitude and colors measured on the seeing–matched (to – our ‘worst’ seeing) registered frames using a fixed circular aperture with radius. At the clusters redshifts, this corresponds to a physical radius of – kpc. This choice has been adopted in order to simplify the comparison with the Coma cluster (see Sec. 4).
3. Cluster membership
Photometric redshifts were computed using two independent codes (Rudnick et al.,, 2001; Bolzonella, Miralles, & Pelló, 2000) to better keep under control systematics in the identification of likely non–members. A detailed analysis of the performance of both codes on EDisCS data will be presented in a separate paper (Pelló et al., in preparation). Results based on the current spectroscopic sample show that our photometric redshifts are quite accurate, with –. Unless otherwise stated, non–members are rejected in the following using a two-step procedure: (i) the full redshift probability distributions from both codes are used to reject objects with low probability to be at the cluster redshift (e.g. Brunner & Lubin,, 2000); (ii) a statistical subtraction is performed on the remaining objects using the distribution on the CM diagram of all the objects at a physical distance from the BCG larger than Mpc (Kodama & Bower,, 2001). Our photometric redshift selection rejects of the objects in the original photometric catalogs (containing objects, down to a magnitude limit of in the I–band). of the remaining objects are subtracted statistically.
4. The color–magnitude relation
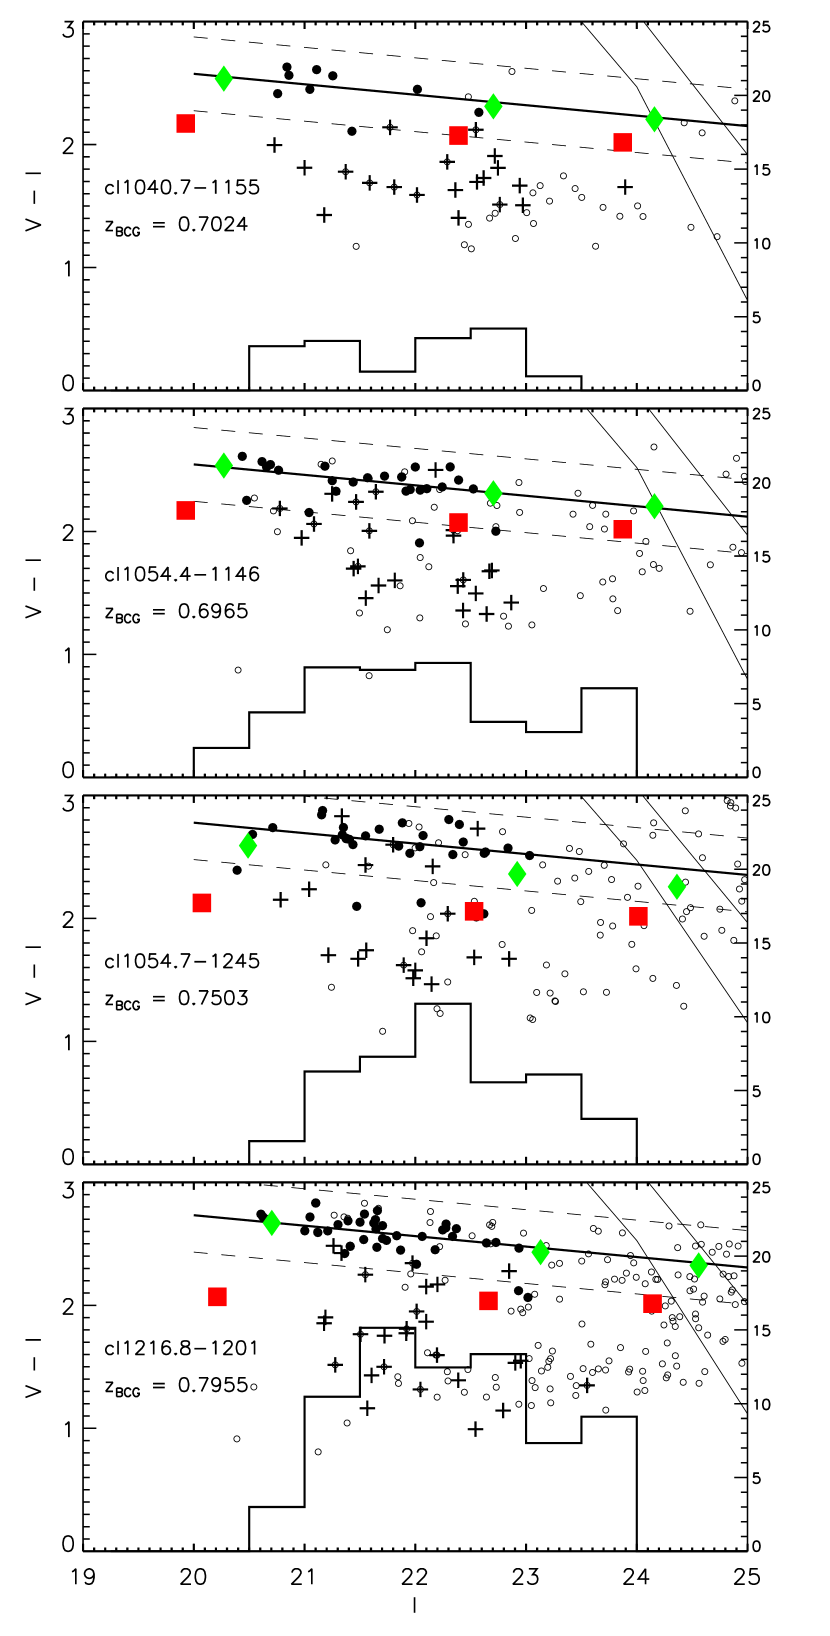
Fig. 1 shows the VI diagram for the clusters used in this analysis. At the clusters redshifts, VI approximately samples the rest–frame UV color, which straddles the Å Balmer break, therefore being very sensitive to any recent or ongoing star formation (SF). A red sequence is clearly visible in the CM diagram of each cluster, together with a significant population of the blue galaxies known to populate high redshifts clusters.
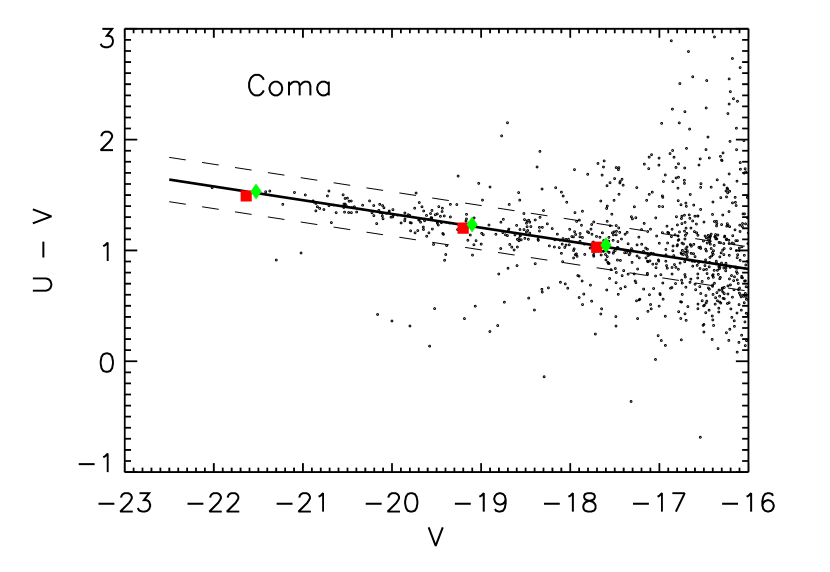
Filled squares and diamonds in Fig. 1 show the location of galaxy models with two different SF histories: a single burst at (diamonds) and an exponentially declining SF starting at (squares) with Gyr. Both were calculated with the population synthesis code by Bruzual & Charlot, (2003). For each SF history, three different metallicities are shown: , and , going from brighter to fainter objects. The relation between metallicity and luminosity in these models has been calibrated by requiring that they reproduce the observed CMR in Coma222This calibration has been found a posteriori to be in good agreement with the metallicity–luminosity relation derived from spectral indices of Coma galaxies (Poggianti et al. 2001)., as shown in Fig. 2. Here we use the data from Terlevich, Caldwell, & Bower (2001) and use their magnitude and colors in a diameter aperture. At the redshift of Coma, this corresponds to a physical size of kpc, quite closely approximating our kpc aperture at . Fig. 1 shows that the single burst model provides a remarkably good fit to the red sequence observed in the high redshift clusters, confirming that the location of the CM sequence observed in distant clusters requires high redshifts of formation, and that the slope is consistent with a correlation between galaxy metal content and luminosity.
5. The truncation of the red sequence
Perhaps the most interesting result of our analysis is that the red sequence in our clusters is well populated at magnitudes brighter than , but unusually ‘empty’ at fainter magnitudes. The histograms in Fig. 1 show the number of cluster members within from the best fit relation, after averaging over Monte Carlo realizations of the statistical subtraction. The paucity of low–luminosity red galaxies at high–z occurs at magnitudes well above our completeness limit and in all the clusters under investigation. There is no clear evidence for such a deficiency in cl– () but, given its very low fraction of objects with absorption–line spectra, it cannot be ruled out statistically either.

In order to quantify this effect, we combine the histograms shown in Fig. 1 correcting colors and magnitudes to a common redshift . The result is shown in panel (a) of Fig. 3. Panel (b) shows the corresponding result for the Coma cluster. For the high–z clusters, non–members have been excluded as described in §3. The dashed histograms shows the corresponding result when membership is based solely on photometric redshifts. In Coma, membership information is available from spectroscopy for a large number of galaxies and we have corrected the number of red galaxies in each magnitude bin for background and foreground contamination using a redshift catalog kindly provided by Matthew Colless and the same procedure as in Mobasher et al., (2003).
The histogram of the EDisCS clusters shows a decrease in the number of L∗ red–sequence galaxies. This effect is present in all our clusters individually, with the possible exception of cl–, as discussed above. Indeed, the ‘luminosity function’ of the red galaxies in these clusters shows the same decrease despite the variety in cluster properties such as velocity dispersion, richness, concentration and substructure (White et al.; Halliday et al., in preparation). Unfortunately, such a deficiency coincides with the well–known ‘dip’ in the luminosity function of the Coma cluster (Godwin & Peach,, 1977). However, the behaviour of the Coma cluster seems quite ‘untypical’. De Propris, Colless, & Driver (2003), for example, have shown that the luminosity function of early (passive) spectral types increases going to fainter magnitudes in clusters in the 2dF survey.
After correcting for passive evolution with the single burst model shown in Figs. 1 and 2, the histograms shown in Fig. 3 are significantly different. A Kolmogorov–Smirnov test rejects the hypothesis that the two histograms are drawn from the same parent distribution at the level. Our correction for passive evolution is mag at V from to , and is consistent with studies of the Fundamental Plane (Wuyts et al.,, 2004). An increase in this correction by mag or more lowers the significance of the effect to .
If we arbitrarily classify as ‘luminous’ galaxies those brighter than (this corresponds to an observed I–band magnitude of at redshift ), and as ‘faint’ those galaxies that are fainter than this magnitude and brighter than (this corresponds to the limiting magnitude in the I–band for which all the selected objects are above the detection limit in the V–band), we obtain a luminous–to–faint ratio for the Coma cluster (the error has been estimated assuming Poisson statistics and, for the EDisCS clusters, includes the error associated to the statistical field subtraction). The corresponding value of the luminous–to–faint ratio for the composite EDisCS cluster is equal to . This ratio is therefore different between the composite high redshift cluster and the Coma cluster at about the level.
The results are robust against both the technique adopted for removing non–cluster members and the photometric errors. The red galaxy deficit is detected also when rejecting non–members using a purely statistical subtraction or a more stringent criterion for membership based solely on photometric redshifts. In fact, a deficit is evident also in the full photometric catalog, when no field correction is attempted. Photometric errors in the EDisCS catalog are comparable to the errors in Terlevich data, therefore the differences observed in the distributions of Fig. 3 cannot be a spurious result arising from photometric errors. As a further test, we performed a series of Monte Carlo realizations () where each point in the Coma histogram was scattered around the CMR taking into account the typical error on color and magnitude. The shape of the histogram is not found to vary significantly.
6. Discussion
A decline in the number of red sequence members at faint magnitudes was first observed in clusters at by Smail et al., (1998). Evidence for a ‘truncation’ of the red–sequence has been noticed in a cluster at by Kajisawa et al., (2000) and Nakata et al., (2001). There have, however, been speculations from the same authors that such a result was spurious because of limited area coverage ( Mpc) and strong luminosity segregation. (See the discussion by Kodama et al., (2004) who obtain a similar result for early–type galaxies in a single deep field).
The CMRs of the EDisCS clusters at show a deficiency of red, relatively faint galaxies, and suggest that such a deficit may be a universal phenomenon in clusters at these redshifts. Our investigation shows that a large fraction of present–day passive L∗ galaxies must have moved on to the CMR at redshifts lower than . Their SF activity therefore must have ended after . The physical mechanisms and the characteristic time–scales of this transformation are not yet understood. The populations of blue galaxies observed in distant clusters are the logical progenitors for a significant fraction of the faint red galaxies at (Smail et al.,, 1998; Kodama & Bower,, 2001; De Propris et al.,, 2003).
It is clear that a formation scenario in which all red galaxies in clusters evolved passively after a synchronous monolithic collapse at –, is inconsistent with observations. Our results indicate that present day passive galaxies follow different evolutionary paths, depending on their luminosity. Future studies, including the intermediate redshift clusters in the EDisCS sample, will help to understand the relative importance of star formation and metallicity in establishing the observed red–sequence.
References
- Beers et al. (1990) Beers, T. C., Flynn, K., Gebhardt, K. 1990, AJ, 100, 32
- Bertin & Arnouts, (1996) Bertin, E., Arnouts S. 1996, A&AS, 117, 393
- Bolzonella et al. (2000) Bolzonella, M., Miralles, J.-M., Pelló, R. 2000, A&A, 363, 476
- Brunner & Lubin, (2000) Brunner, R. J., Lubin, L. M. 2000, ApJ, 120, 2851
- Bruzual & Charlot, (2003) Bruzual, G., Charlot, S. 2003, MNRAS, 344, 1000
- De Lucia et al. (2004) De Lucia, G., Kauffmann, G., White, S. D. M. 2004, MNRAS, 349, 1101
- De Propris et al., (1998) De Propris, R., Eisenhardt, P. R., Stanford, S. A., Dickinson, M. 1998, ApJ, 503, L45
- De Propris et al. (2003) De Propris, R., Colless, M., Driver, S.P. 2003, MNRAS, 342, 725
- De Propris et al., (2003) De Propris, R., Stanford, S. A., Eisenhardt, P. R., Dickinson, M. 2003, ApJ, 598, 20
- van Dokkum and Franx, (1996) van Dokkum, P. G., Franx, M. 1996, MNRAS, 281, 985
- Dressler et al., (1999) Dressler, A., Smail, I., Poggianti, B. M., Butcher, H., Couch, W. J., Ellis, R. S, Oemler, A. Jr 1999, ApJS, 122, 51
- Ellis et al., (1997) Ellis, R. S., Smail, I., Dressler, A., Couch, W. J., Oemler, A. Jr, Butcher, H., Sharples, R. M. 1997, ApJ, 483, 582
- Gladders et al., (1998) Gladders, M. D., López-Cruz, O., Yee, H. K. C., Kodama, T. 1998, ApJ, 501, 571
- Godwin & Peach, (1977) Godwin, J. G., Peach, J. V., 1977, MNRAS, 181, 323
- Kajisawa et al., (2000) Kajisawa, M., Yamada, T., Tanaka, I., Maihara, T., Iwamuro, F., Terada, H., Goto, M., Motohara, K., et al. 2000, PASJ, 52, 61
- Kauffmann & Charlot, (1998) Kauffmann, G., Charlot, S. 1998, MNRAS, 294, 705
- Kodama et al., (1998) Kodama, T., Arimoto, N., Barger, A. J., Aragón-Salamanca, A. 1998, A&A, 334, 99
- Kodama & Bower, (2001) Kodama, T., Bower, R. G. 2001, MNRAS, 321, 18
- Kodama et al., (2004) Kodama, T., Yamada, T., Akiyama, M., Aoki, K., Doi, M., Furusawa, H., Fuse, T., Imanishi, M., et al. 2004, MNRAR, in press, preprint astro-ph/0402276
- Mobasher et al., (2003) Mobasher, B., Colless, M., Carter, D., Poggianti, B. M., Bridges, T. J., Kranz, K., Komiyama, Y., Kashikawa, N., et al. 2003, ApJ, 587, 605
- Nakata et al., (2001) Nakata, F., Kajisawa, M., Yamada, T., Kodama, T., Shimasaku, K., Tanaka, I., Doi, M., Furusawa, H., et al. 2001, PASJ, 53, 1139
- Poggianti, (1997) Poggianti, B. M. 1997, A&AS, 122, 399
- Poggianti et al., (1999) Poggianti, B. M., Smail, I., Dressler, A., Couch, W. J., Barger, A. J., Butcher, H., Ellis, R. S., Oemler, A. Jr. 1999, ApJ, 518, 576
- Rudnick et al., (2001) Rudnick, G., Franx, M., Rix, H., Moorwood, A., Kuijken, K., van Starkenburg, L., van der Werf, P., Röttgering, H., et al. 2001, ApJ, 122, 2205
- Rudnick et al., (2003) Rudnick, G., White, S., Aragón-Salamanca, A., Bender, R., Best, P., Bremer, M., Charlot, S., Clowe, D., et al. 2003, The Messenger, 112, 19
- Smail et al., (1998) Smail, I., Edge, A. C., Ellis, R. S., Blandford, R. D. 1998, MNRAS, 293, 124
- Stanford et al. (1998) Stanford, S. A., Eisenhardt, P. R., Dickinson, M. 1998, ApJ, 492, 461
- Terlevich et al. (2001) Terlevich, A. I., Caldwell, N., Bower, R. G. 2001, MNRAS, 326, 1547
- Visvanathan & Sandage, (1977) Visvanathan, N., Sandage, A. 1977, ApJ, 216, 214
- Wuyts et al., (2004) Wuyts, S., van Dokkum, P. G., Kelson, D. D., Franx, M., Illingworth, G. D. 2004, ApJ, 605, 677