A search for cyclotron resonance features with INTEGRAL
Abstract
We present an INTEGRAL observation of the Cen-Crux region in order to search the electron cyclotron resonance scattering features from the X-ray binary pulsars. During the AO1 200 ks observation, we clearly detected 4 bright X-ray binaries, 1 Seyfert Galaxy, and 4 new sources in the field of view. Especially from GX301-2, the cyclotron resonance feature is detected at about 37 keV, and width of 3–4 keV. In addition, the depth of the resonance feature strongly depends on the X-ray luminosity. This is the first detection of luminosity dependence of the resonance depth. The well-known twin pulsars are spatially separated by JEM-X and IBIS/ISGRI, and pulse periods are measured individually; 296.90 sec for 1E1145-6141 and 292.5 sec for 4U1145-619. The cyclotron resonance feature is marginally detected from 1E1145.1-6141. Cen X-3 was very dim during the observation and poor statistics disable us to detect the resonance features.
keywords:
X-rays; High mass X-ray binary pulsar; cyclotron resonance feature1 Introduction
Neutron stars (NS) are regarded as having extremely strong magnetic fields (MFs) reaching 1012-13 G. Nevertheless, the origin and evolution of such strong MFs have been standing as a long mystery. The electron cyclotron resonance scattering features (CRSFs) in the X-ray spectrum are the only direct method to measure the MFs on the NS. The center Ec of CRSF in their spectra reflects the magnetic field B, given as . In early 1990’s, Ginga (Japanese 3rd X-ray satellite) provided a powerful mean to search for CRSFs in the 2–30 keV range in the X-ray binary pulsars (XBPs) spectra. In addition to two already known XBPs, new CRSFs were discovered from more than 6 XBPs. The MF strength of XBPs seems to be concentrated in a narrow range of B= (1–5) 1012 G (Makishima et al. 1999). However, the high-field side of the distribution, although augmented by SAX and RXTE, is still subject to considerable selection effects. INTEGRAL, with its wide dynamic range and good sensitivity, is expected to be very powerful to search for the CRSF at higher energy range. Here we report the INTEGRAL observation of 4 Galactic XBPs, in an attempt to detect CRSFs at higher energy range of 10–150 keV.
2 Observation and data reduction
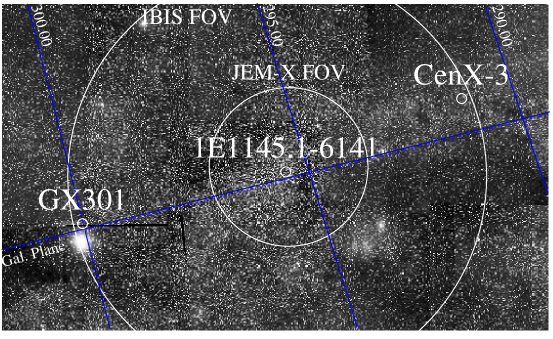
We have observed the Cen-Crux region during the AO1 phase, from the end of June 2003 to the beginning of July 2003, with an exposure time of 200 ksec, which is composed of 52 science window. Cen-Crux region is located on the Galactic plane and 60∘ apart from the Galactic center, and it is known as a region where the bright X-ray pulsars are concentrated. The observations field of view are centered near 1E1145.1-6141, one of the bright X-ray pulsar, shown in figure 1. Imaging analysis is performed using the current version (3.0) of the Offline Science Analysis (OSA) software. Spectral extraction is performed independently for every science window. The data of IBIS/ISGRI are mainly studied and we also use JEM-X and SPI spectra.
3 Hard X-ray source population in Cen-Crux region
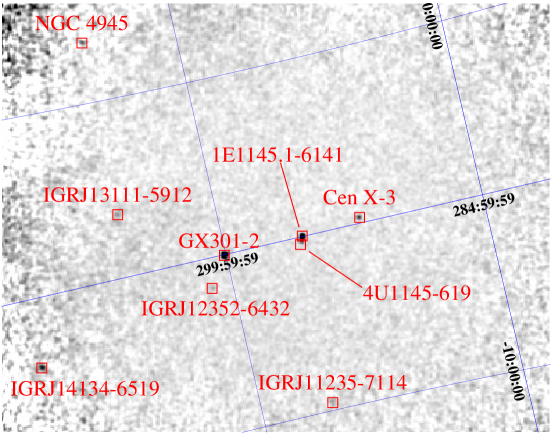
We generated the significance image of 15–40 keV and 40–100 keV range and search for sources which exceeds 7 significance in 15–40 keV, this detection limit corresponds to 5mCrab. As a result, we detected 9 hard X-ray sources in the FOV (fig. 2). As expected, 4 sources are well known XBP; Cen X-3, GX301-2, 1E1145.1-6141, and 4U1145-619. NGC4945, which is one of the brightest Seyfert 2 galaxy in hard X-ray band, is detected in the north-east region. 4 new sources are also discovered in the FOV. The source list is summarized in table 1.
| Object | RA | Dec | Significance(soft/hard)∗ | Flux [mCrab]∗∗ | Class |
|---|---|---|---|---|---|
| GX301–2 | 186.6587 | -62.7752 | 233.3/16.1 | 78 | XBP |
| Cen X-3 | 170.3223 | -60.6268 | 26.2/3 | 15 | XBP |
| 1E1145.1-6141 | 176.8983 | –61.9977 | 74.9/26.1 | 50 | XBP |
| 4U1145-619 | 176.9178 | -62.3190 | 28.5/10.0 | 37 | XBP |
| NGC4945 | 196.3826 | -49.5000 | 6.13/ 7.7 | 30 | Seyfert 2 |
| IGRJ14134-6519 | 213.4368 | -65.3282 | 10.2/3.2 | 8 | ? |
| IGRJ12352-6432 | 188.8395 | -64.5357 | 8.5/3 | 12 | ? |
| IGRJ13111-5912 | 197.8113 | -59.2058 | 7.9/4.5 | 8 | ? |
| IGRJ11235-7114 | 170.9609 | -71.2420 | 7.0/3 | 8 | ? |
∗ : 15–40 keV for soft , 40–100 keV for hard band respectively.
∗∗ : 15–100 keV
4 GX301-2
The high mass X-ray binary pulsar GX301-2 is a wind-fed neutron star around the supergiant companion Wray 977 (Sato et al. 1986). The pulse period is 675.7 sec (Pravdo et al. 1995) and orbital phase is 41.508 0.007 days (Sato et al. 1986). The CRSF is firstly reported at 35.6 1.6 keV by Ginga (Mihara 1995, Makishima et al. 1999), although the detection is not firmed. A 42.4 keV CRSF is reported by RXTE (Coburn et al. 2002). GX301-2 was very bright ( 100mCrab) during the observations, and was clearly detected by JEM-X, IBIS/ISGRI, and SPI.
4.1 Crab-ratio spectrum
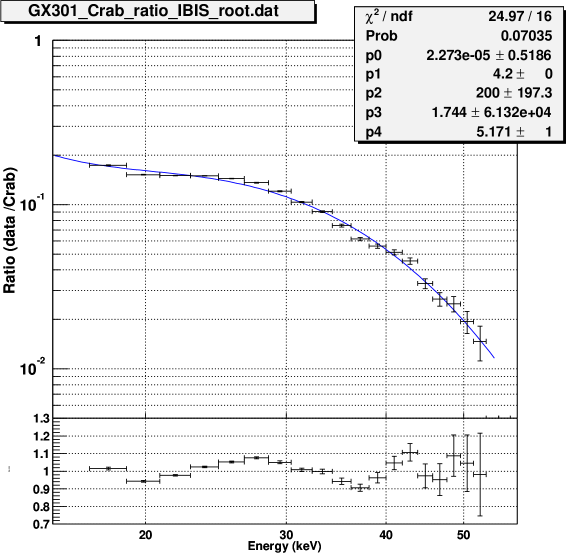
Because the CRSF detection strongly depends on the continuum spectrum, the accuracy of the detector response matrix is very important in the study. However, as reported in Goldwurm et al. 2003, the response matrix of the ISGRI detector is under development. To make the spectrum fitting using the response matrix distributed by Integral Science Data Center (ISDC), a large systematic error, about 10%, is required. That makes our CRSF search difficult. In order to avoid large uncertainty caused by the current response matrix, we firstly try the Crab-ratio spectrum analysis. By dividing our data by the well-known power law spectrum, it becomes free from the complexity of the detector response matrix, and we can directly investigate the CRSFs.
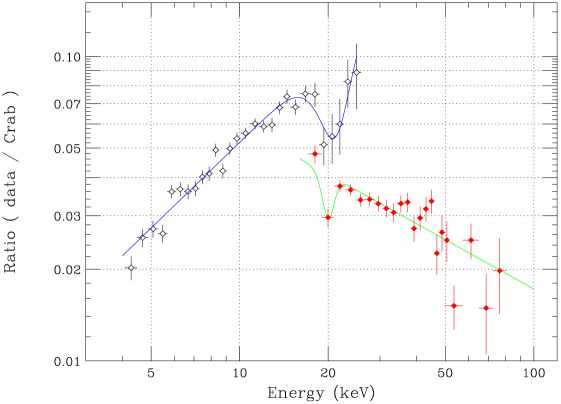
Figure 3 shows the crab-ratio spectrum of ISGRI. We fit the data for the simple continuum and obtained the chi-squared. As shown in the bottom panel, the residual is clearly seen at about 30-40 keV. Therefore we add the CRSF absorption model as an additional component. As a result, CRSF at 36 1.5 keV is detected, and the detection significance of the CRSF is about 2.1. The absolute intensity of the CRSF is not determined, because we used the spectrum ratio.
4.2 Spectrum fitting
Although the response matrix of ISGRI is still under development, we can fit the data by assuming a systematic error of 10%. At first, we evaluate the continuum spectrum using Negative and Positive Exponent (NPEX) model, as
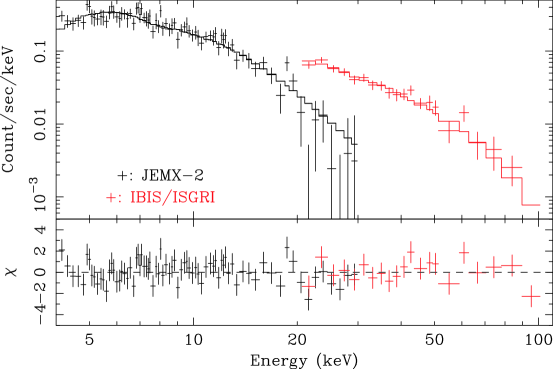
where An, Ap are normalization and , are photon index, T is a cut-off energy and E the photon energy. This model successfully reproduces the subtle curvature change in the binary X-ray pulsar continuum (Makishima et al. 1999, Mihara 1995). We can evaluate the parameters from the fitting and the reduced is 2.69 (179 degrees of freedom(d.o.f.)) for JEM-X and IBIS simultaneous fitting. The obtained reduced suggests that the single NPEX continuum cannot explain the JEM-X and IBIS spectrum, and we can clearly find an excess of the residual at about 35 keV. Then we add the CRSF model, as
where F(E) is photon number at energy E, A is normalization, is photon index, while Ec, D, and W are the energy, depth, and width of the cyclotron resonance line. The exponential factor represents the classical electron cyclotron resonance scattering. After adding the CRSF model into NPEX continuum, the fit is improved and the reduced is 1.60 (176 d.o.f.). The energy Ec is 35.6 0.3 keV and depth D is 1.1.
4.3 Luminosity dependence of the cyclotron line
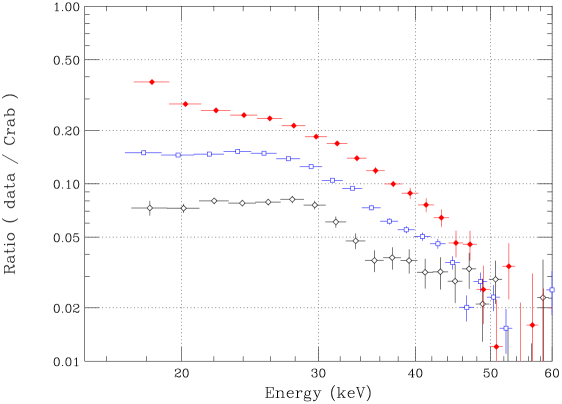
Finally, in order to study the luminosity dependence of the CRSF in GX301, we extract the spectra from three different surface brightness separately, which is defined as cps 20 count/s, 20 cps 10 counts/s, cps 10 counts/s, in the energy range of 15–40 keV respectively. Figure 5 shows the spectrum of three different surface brightness. We can clearly see that the depth of the CRSF increases as the luminosity decreases. Because of the low statistics and unreliable response matrix, we do not show more detailed result in figure 5.
5 Twin pulsars
1E1145.1-6141 and 4U1145-691 locates very close each other, 20′, and are known as ”twin pulsar”. With INTEGRAL, we can spatially separate the sources with JEM-X and possibly IBIS. From 1E1145.1-6141, we marginally find the CRSF at about 20 keV by the Crab-ratio analysis, but the detection is still marginal. From H1145-619, CRSF is not detected in the range of 5–80 keV.
6 Cen X-3
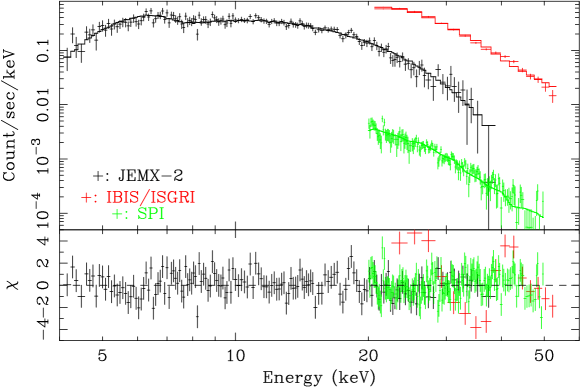
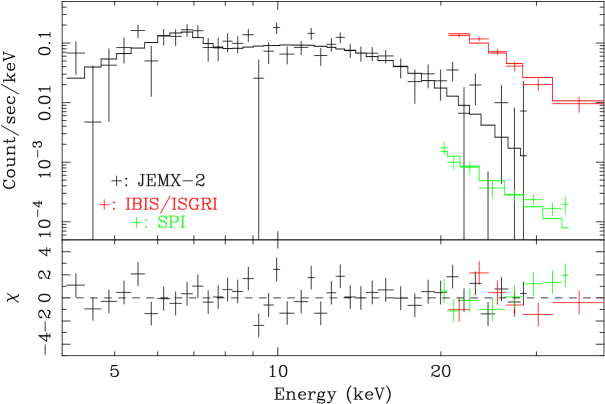
One of our primary purpose of Cen X-3 observation is to search for the higher harmonic. However the Cen X-3 was very dim with a flux of 15 mCrab in 15-100 keV energy band. Figure 8 shows the JEM-X, IBIS, and SPI simultaneous fitting of the Cen X-3 observation. The data are successfully reproduced by the NPEX model, but we fail to detect the CRSF at about 20 keV, which is reported by Santangelo et al. 1998. Further deep observation is important.
7 Summary
We observed the Cen-crux region in order to search for the cyclotron resonance scattering features with INTEGRAL. During 200 ksec observation, we have detected 4 X-ray binary pulsars. For GX301-2, the CRSF is clearly detected at about 37 keV in the phase averaged spectrum and we found that the depth of the CRSF depends on the X-ray luminosity. The center energy of the CRSF is consistent with the Ginga result (Mihara 1995). The twin pulsar is spatially separated by JEM-X and IBIS/ISGRI. For 1E1145.1-6141, one of the pulsar twins, we marginally detected the CRSF at about 20 keV. This is a first detection if the data are statistically significant. Cen X-3 was very dim and resultantly the CRSF is not detected significantly. Further detailed analysis is being expected after a new release of OSA.
References
- Coburn et al. (2002) Coburn W., Heindl W.A., Rothschild R.E., et al., 2002, ApJ, 580, 394,
- Goldwurm et al. (2003) Goldwurm A., David P., Foschini L., et al., 2003, A&A, 411, L223
- Pravdo et al. (1995) Pravdo S.H., Day C.S.R., Angelini L., et al., 1995, ApJ, 454, 872
- Santangelo et al. (1998) Santangelo A., del Sordo S., Segreto A., et al., 1998, A&A, 340, L55
- Sato et al. (1986) Sato N., Nagase F., Kawai N., et al., 1986, ApJ, 304, 241
- Mihara (1995) Mihara T., 1995, Ph.D. thesis, Univ. Tokyo
- Mikishima et al. (1999) Makishima K., Mihara T., Nagase T., et al., 1999, ApJ, 525, 978