Hydrocarbon Dust Absorption in Seyfert Galaxies and ULIRGs111Based on observations with the UK Infrared Telescope, Mauna Kea Observatory, Hawaii.
Abstract
We present new spectroscopic observations of the 3.4m absorption feature in the Seyfert galaxies, NGC1068 and NGC7674, and the ultraluminous infrared galaxy, IRAS08572+3915. A signature of C−H bonds in aliphatic hydrocarbons, the 3.4m feature indicates the presence of organic material in Galactic and extragalactic dust. Here we compare the 3.4m feature in all the galaxies in which it has been detected. In several cases, the signal-to-noise ratio and spectral resolution permit a detailed examination of the feature profile, something which has rarely been attempted in extragalactic lines of sight. The 3.4m band in these galaxies closely resembles that seen in the Galactic diffuse ISM and in newly-formed dust in a protoplanetary nebula. The similarity implies a common carrier for the carbonaceous component of dust, and one which is resistant to processing in the interstellar and/or circumnuclear medium. We also examine the mid-IR spectrum of NGC1068, because absorption bands in the 5-8m region further constrain the chemistry of the 3.4m band carrier. While weak features like those present in the mid-IR spectrum of diffuse dust towards the Galactic center would be undetectable in NGC1068, the strong bands found in the spectra of many proposed dust analog materials are clearly absent, eliminating certain candidates and production mechanisms for the carrier. The absence of strong absorption features at 5-8m is also consistent with the interpretation that the similarity in the 3.4m feature in NGC1068 to that in Galactic lines of sight reflects real chemical similarity in the carbonaceous dust.
1 Introduction
Interstellar dust regulates star formation, catalyzes molecule production and reprocesses UV and optical radiation, thus playing a critical role both in the physical processes of a galaxy and in our interpretation of observations of dusty regions. Despite this importance, however, dust in galaxies other than our own is not yet well understood.
A useful tracer of the carbonaceous component of dust is the C−H bond stretch of aliphatic hydrocarbons, observed in absorption at 3.4m (2941cm-1) throughout the Galactic diffuse ISM. This broad feature exhibits substructure corresponding to symmetric and asymmetric stretches of C−H bonds in CH2 and CH3 groups in aliphatic hydrocarbon chains (Sandford et al., 1991), the relative strengths of which are related to the lengths of the chains (e.g. Alpert, Keiser & Szymanski, 1970). In addition, chemical groups such as CO, CN, OH, and aromatic rings attached to the chains can change the force constants of the C−H bonds, thereby causing shifts in the positions and intensities of the subpeaks within the band. The overall shape of the 3.4m feature reflects this and can therefore be used to probe the chemical makeup of the dust.
Hydrocarbon-containing materials with quite different formation and processing histories may have similar 3.4m band profiles which reflect the molecular environment of the C−H bonds (Pendleton et al., 1994), and, as shown by Pendleton & Allamandola (2002), spectroscopy in the 5-9m region is required to differentiate decisively between dust analog materials. At these wavelengths, features arising from C−H bends, C−C vibrations and vibrations of many other chemical bonds can also be present, allowing more complete identification of functional groups and comparisons between astronomical and laboratory spectra. However, while hydrocarbon materials with different histories can have similar 3.4m profiles, this is not necessarily the case; laboratory spectra from a multitude of research groups reveal clear differences in many of the 3.4m feature profiles (Pendleton & Allamandola, 2002). Moreover, unlike the 5-9m region, the 3.4m feature is accessible from ground-based observatories. To investigate the extent of these possible variations in the shape of the 3.4m feature, to provide data to complement future mid-IR spectral observations, and to deepen our understanding of the carbonaceous dust in the Universe, it will be instructive to compare spectra of the 3.4m feature in different Galactic and extragalactic environments.
Observations have been made along a number of Galactic lines of sight, sampling the diffuse ISM towards the Galactic center and a number of reddened field stars and YSOs, and the newly-formed circumstellar dust in the protoplanetary nebula, CRL618 (Butchart et al., 1986; McFadzean et al., 1989; Adamson, Whittet & Duley, 1990; Lequeux & Jourdain de Muizon, 1990; Sandford et al., 1991; Pendleton et al., 1994; Sandford, Pendleton & Allamandola, 1995; Imanishi et al., 1996; Whittet et al., 1997; Chiar et al., 1998, 2000, 2002; Ishii et al., 2002; Rawlings, Adamson & Whittet, 2003). The 3.4m feature has also been studied in the Murchison meteorite (Cronin & Pizzarello, 1990; de Vries et al., 1993). Where the quality of the data allows the comparison, the profile of the feature is very similar between lines of sight, as well as in some laboratory analog materials (e.g. Pendleton et al., 1994; Chiar et al., 1998; Ishii et al., 2002; Pendleton & Allamandola, 2002).
The 3.4m band has also been detected in several Seyfert galaxies and ULIRGs (Bridger, Wright & Geballe, 1994; Mizutani, Suto & Maihara, 1994; Wright et al., 1996; Imanishi et al., 1997; Imanishi, 2000a, b; Imanishi & Dudley, 2000; Imanishi, Dudley & Maloney, 2001; Imanishi, 2002, 2003; Marco & Brooks, 2003; Risaliti et al., 2003). In almost all cases, the observations were aimed at establishing the power source of each galaxy through the presence or absence of the 3.4m band and the 3.3m PAH emission feature, rather than to examine in detail the chemical makeup of the dust. Wright et al. (1996) and Imanishi et al. (1997) note the similarity of the 3.4m feature in the Seyfert 2 galaxy, NGC1068, with that observed towards the Galactic center, and Wright et al. (1996) and Pendleton (1996, 1997) also compare the feature in the ULIRG, IRAS08572+3915, to the Galactic center, again finding a striking similarity. Risaliti et al. (2003) present an L-band spectrum of the southern nucleus of the Superantennae galaxies (IRAS19254-7245), and suggest that the 3.4m feature profile implies that the carbonaceous dust in that galaxy contains more electronegative groups than that in the Galactic diffuse ISM333Since the submission of this paper, Dartois et al. (2004) have also examined the 3.4m band, hydrocarbon/silicate ratio and oxygen content of the carbonaceous dust in four galaxies. .
To investigate in more detail the chemical composition of hydrocarbon dust in galaxies, we have obtained new, higher signal-to-noise ratio (S/N) spectra of the feature towards the nucleus of NGC1068 and IRAS08572+3519 (§3). We also present a new detection of the feature towards the nucleus of the Seyfert 2 galaxy, NGC7674. In §4 we compare the 3.4m feature of NGC1068, the galaxy with the best L-band spectrum, with that observed towards the Galactic center and in the protoplanetary nebula CRL618, and with all of the galaxies in which this feature has been detected. Finally, in §5 we analyse the 3.4m band of NGC1068 in conjunction with ISO mid-IR spectra of that galaxy, something which has to date only been possible for the line of sight to the Galactic Center (Chiar et al. 2000). The implications of this work for the composition, production and survival of carbonaceous dust are discussed in §6.
2 The lines of sight
2.1 The Seyfert galaxies
As the galaxy in which Antonucci & Miller (1985) detected the first hidden broad line region in polarized light, NGC1068 is probably the most-studied active galaxy. At a distance of 16Mpc (), corresponds to 70pc. The unified model of active galactic nuclei (AGN) proposes that our view of the nucleus of NGC1068, a type 2 Seyfert galaxy, is blocked by an edge-on dusty torus, and that the broad lines visible only in polarized light are deflected into our line of sight by a scattering mirror of electrons or dust. Emission from dust in the central few hundred pc of NGC1068 can clearly be seen in IR images of that galaxy (e.g. Tomono et al., 2001; Rouan et al., 2004). The 0.48″-wide slit used for the present observations was centered on the peak of the L-band emission, and the disk of NGC1068 is quite close to face-on (, see Table 2.2) so the spectrum presented here comes from a region of the dust surrounding the central engine of this galaxy that is roughly comparable in size to a Galactic giant molecular cloud complex.
NGC7674 is also a spiral galaxy with a Seyfert 2 nucleus. Like NGC1068, the disk of the galaxy has a low inclination, so although NGC7674 is several times as distant as NGC1068, much of the dust that we observe is likely to be close to the active nucleus rather than in the diffuse ISM of the galaxy. The other Seyfert galaxies in which the 3.4m feature has been detected have greater inclinations. In these cases, there may be some contribution from absorption by dust in the diffuse ISM of the spiral arms of the galaxy.
2.2 The ULIRGs
The deepest 3.4m features yet observed in any lines of sight are found in the ultraluminous infrared galaxies (ULIRGs, ), IRAS08572+3915, IRAS19254-7245 and UGC5101, along with a weaker feature in IRAS05189-2524 (Wright et al., 1996; Imanishi & Dudley, 2000; Imanishi et al., 2001; Risaliti et al., 2003), leading to the suggestion that the major power source in these ULIRGs is a deeply obscured AGN. This could mean that the feature arises in dust close to the active nucleus, as is the case for some of the Seyfert galaxies. However, unlike the Seyfert galaxies with a classical spiral morphology, the ULIRGs are often disturbed, interacting systems, with dust lanes and discs crossing the nuclear regions (Scoville et al., 2000). Therefore it is possible that the 3.4m band in these galaxies is caused by a combination of both diffuse medium and circumnuclear dust.
Some relevant properties of the galaxies examined in this paper are summarized in Table 2.2.
| Galaxy | Type/morphology aaFrom NED | Redshift aaFrom NED | Inclination bbSpiral galaxies only. From Whittle (1992), except: NGC1068, NGC7476 — García-Gómez, Athanassoula & Barberà (2002); NGC7172 — Nagar & Wilson (1999); NGC3094 — de Vaucouleurs et al (1991); IRAS04385 — Kinney et al. (2000). | NH ccFrom Bassani et al. (1999), except: IRAS08572, IRAS19254 — Risaliti et al. (2000); UGC5101 — Imanishi et al. (2003) | References |
|---|---|---|---|---|---|
| (deg) | (1020 cm-2) | ||||
| NGC1068 | Sy2/SAb | 0.0038 | 29∘ | 1,2,3,4 | |
| IRAS04385-0828 | Sy2/S0 | 0.0151 | 60∘ | … | 11 |
| IRAS05189-2524 | ULIRG, Sy2/– | 0.0426 | … | 490 | 1,2,5 |
| IRAS08572+3915 | ULIRG, Sy2/– | 0.0584 | … | 1,2,5 | |
| UGC5101 | ULIRG, Sy1.5/– | 0.0394 | … | 6 | |
| NGC3094 | Sy2/SBa | 0.0080 | 48∘ | … | 7 |
| Mrk463 | Sy2/– | 0.0510 | 55∘ | 1600 | 9 |
| IRAS19254-7245 | ULIRG, Sy2/– | 0.0617 | … | 10 | |
| NGC7172 | Sy2/Sa | 0.0087 | 61∘ | 861 | 7 |
| NGC7479 | Sy2/SBc | 0.0079 | 51∘ | … | 7 |
| NGC7674 | Sy2/SAbc | 0.0289 | 23∘ | 1,11 |
3 Observations and data reduction
Spectra of NGC7674 and IRAS08572 were obtained using CGS4 on the 3.8m United Kingdom Infrared Telescope (UKIRT) on Mauna Kea, in October 2000. The observations of IRAS08572 were completed in March 2001, as part of the UKIRT Service Programme. For NGC7674, the 40 l/mm grating was used with a 2-pixel (1.2”) slit, giving a resolving power of . IRAS08572 was observed with the 150 l/mm grating and the 2-pixel slit, resulting in R. NGC1068 was observed in November 2002 with UIST, UKIRT’s imager/spectrometer. UIST’s short-L grism and 4-pixel (0.48”) slit were used, for R.
The data were reduced using UKIRT’s data reduction pipelines, CGS4DR and ORACDR, and the Starlink FIGARO package. After bad pixel masking, bias subtraction, and flatfielding, subtracted sky and object pairs were coadded into groups. Residual sky emission, which was generally very low, was removed by fitting a polynomial in the spatial direction and the spectra were then optimally extracted. Sky lines were cancelled by division by a standard star. For IRAS08572 and NGC7674, wavelength calibration was achieved using observations of an argon arc lamp, but for the UIST observations of NGC1068, the arc lamp was observed through the H-band filter in second order, which induces a wavelength shift in the lines. Rather than correcting for this shift, HI lines in the standard star and the telluric CH4 line were used for wavelength calibration.
The spectra of IRAS08572 and NGC7674 were obtained using more than one grating setting. The separate spectra were merged by wavelength, being multiplied by a constant where necessary to achieve a good match in flux between the sections (these adjustments were generally 10%) The wavelength calibration should ensure a good match in wavelength, but this was checked using telluric lines where possible. The spectra were flux-calibrated using the V- or K-band magnitudes of the telluric standard stars and appropriate V-K, K-L and K-L’ colors. The results are generally consistent with published measurements, but as the standard stars were selected primarily to ensure good cancellation of atmospheric lines rather than as photometric standards, the flux calibration should be considered approximate.
Data for NGC3094, NGC7172, NGC7479 and Mrk463, which were also acquired using CGS4 on UKIRT, were obtained from the UKIRT archive and reduced in the same way as the galaxies described above. These data have previously been published by Imanishi (2000a, b, 2002); the observational details are described therein. The L-band spectrum of IRAS19254 was aquired with the Infrared Spectrometer and Array Camera, ISAAC, on the Very Large Telescope (VLT), and has been published by Risaliti et al. (2003). We obtained the data from the VLT Science Archive Database. Initially, the eclipse-isaac software package (Devillard, 1997) was used to flatfield, sky-subtract, wavelength-calibrate and combine the individual frames. Removal of residual sky emission, optimal extraction, division by a standard star and flux calibration were performed using FIGARO routines.
Spectra of UGC5101 and IRAS04385, observed with NSFCAM and SpeX at NASA’s IRTF, were kindly provided by M. Imanishi. The observations and reduction of the data are described in Imanishi et al. (2001) and Imanishi (2003). The spectrum of IRAS05189 is from Wright et al. (1996).
3.1 Optical depth spectra
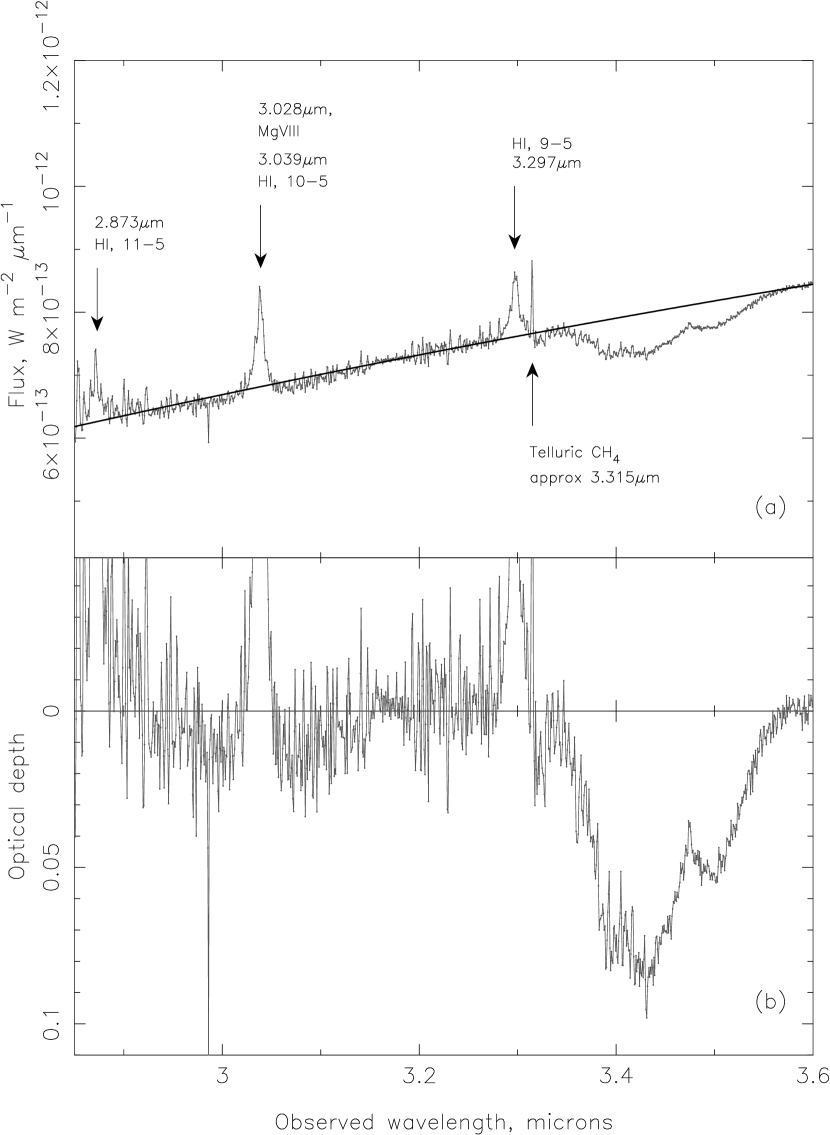
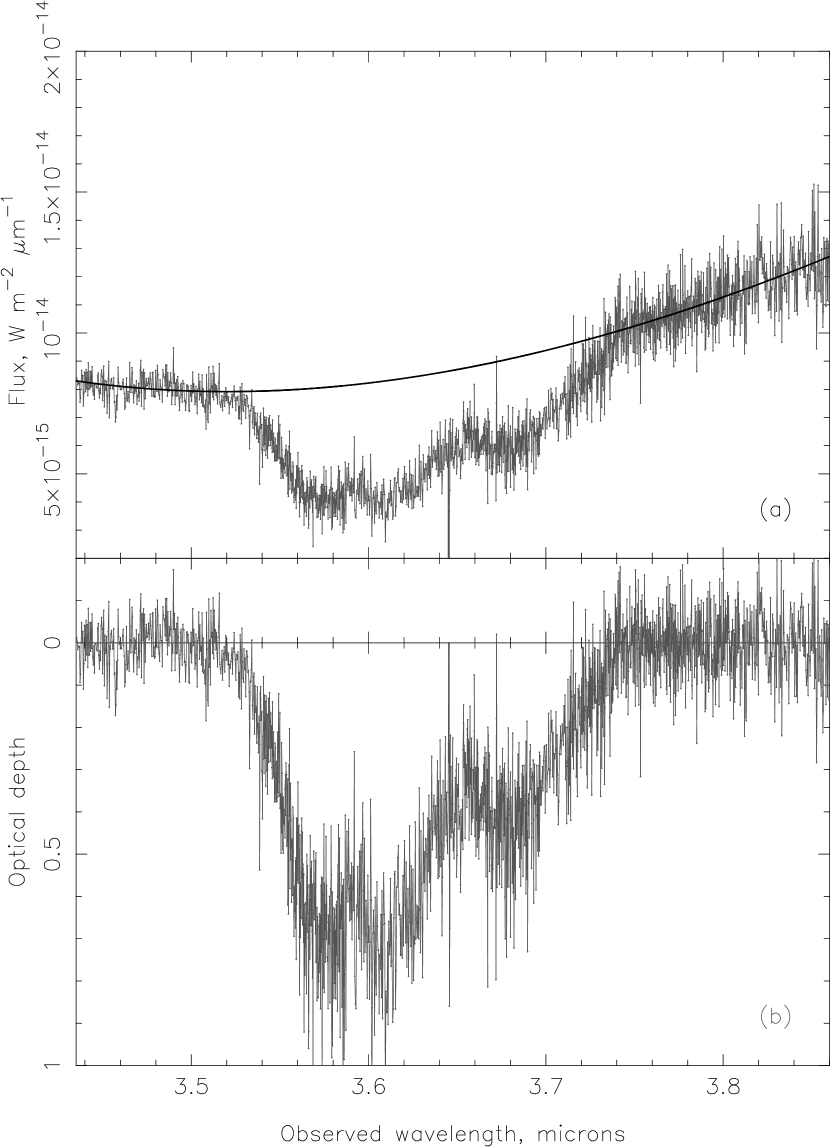
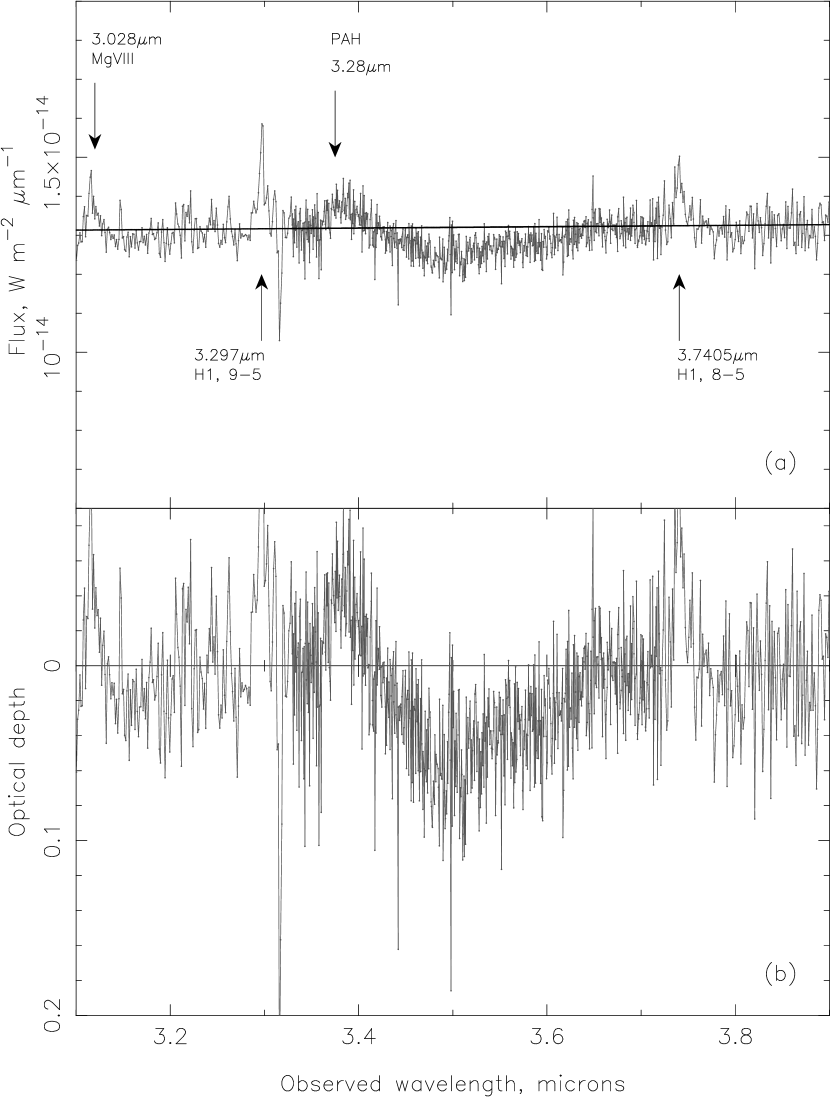
Flux and optical depth spectra from the new data, together with the continua used to derive the optical depths, are presented in Figures 1, 2 and 3. These continua result from fitting low-order polynomial curves to the spectra outside the rest-frame 3.30-3.55m region.
Several groups have measured the optical depth of the 3.4m feature in NGC1068. Imanishi et al. (1997) calculate , slightly larger than the derived by Wright et al. (1996). We measure . More recently, Marco & Brooks (2003) obtained a spectrum of NGC1068 in the 3.0-3.6m range, with . The differences in optical depth values between these studies probably result from differences in aperture sizes and in the continua used to derive .
L-band spectra of IRAS08572 have been obtained by Wright et al. (1996) and Imanishi & Dudley (2000), at in the latter case. Their spectra both have , as does the present spectrum. For NGC7674 we measure , and also detect weak PAH emission at 3.3m. This is the first time that the 3.4m feature has been reported in this galaxy; the presence of the feature is not clear in the lower-resolution spectrum reported by Imanishi (2003), who find . In none of these galaxies is there any clear indication of the 3.1m O−H stretch characteristic of the ices observed in Galactic dense molecular clouds.
4 Comparison of the 3.4m feature in Seyferts, ULIRGs and other dusty environments
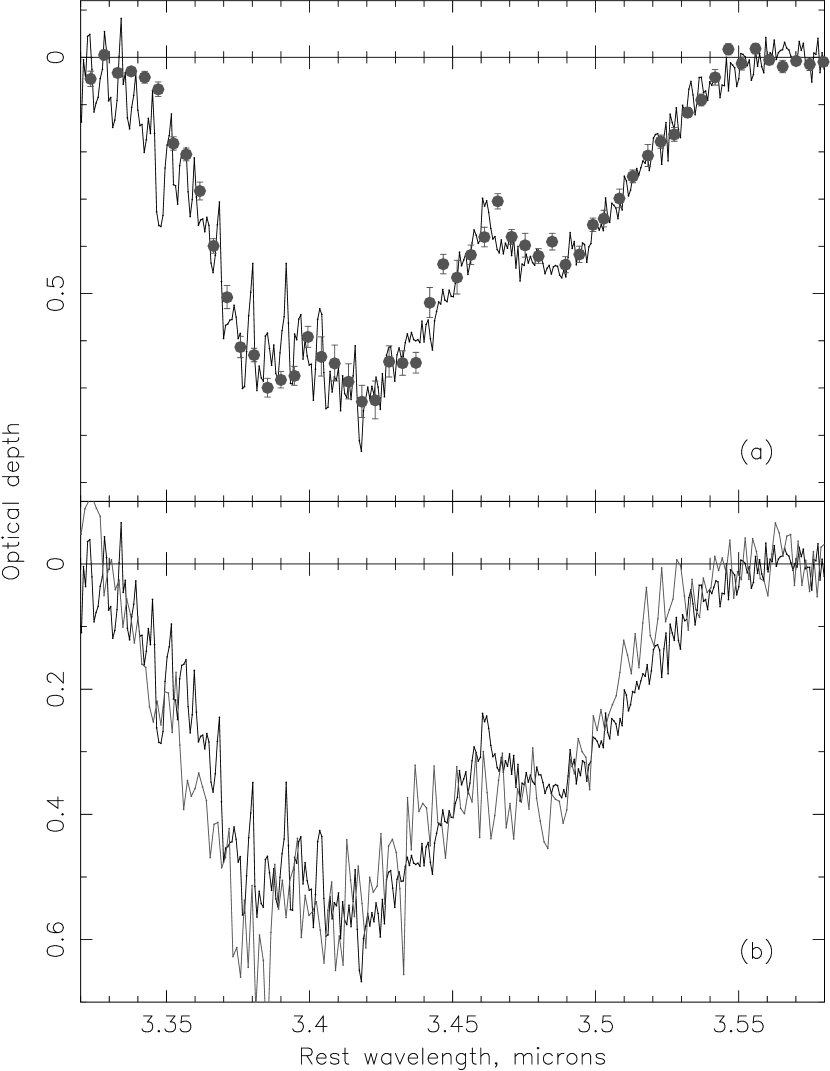
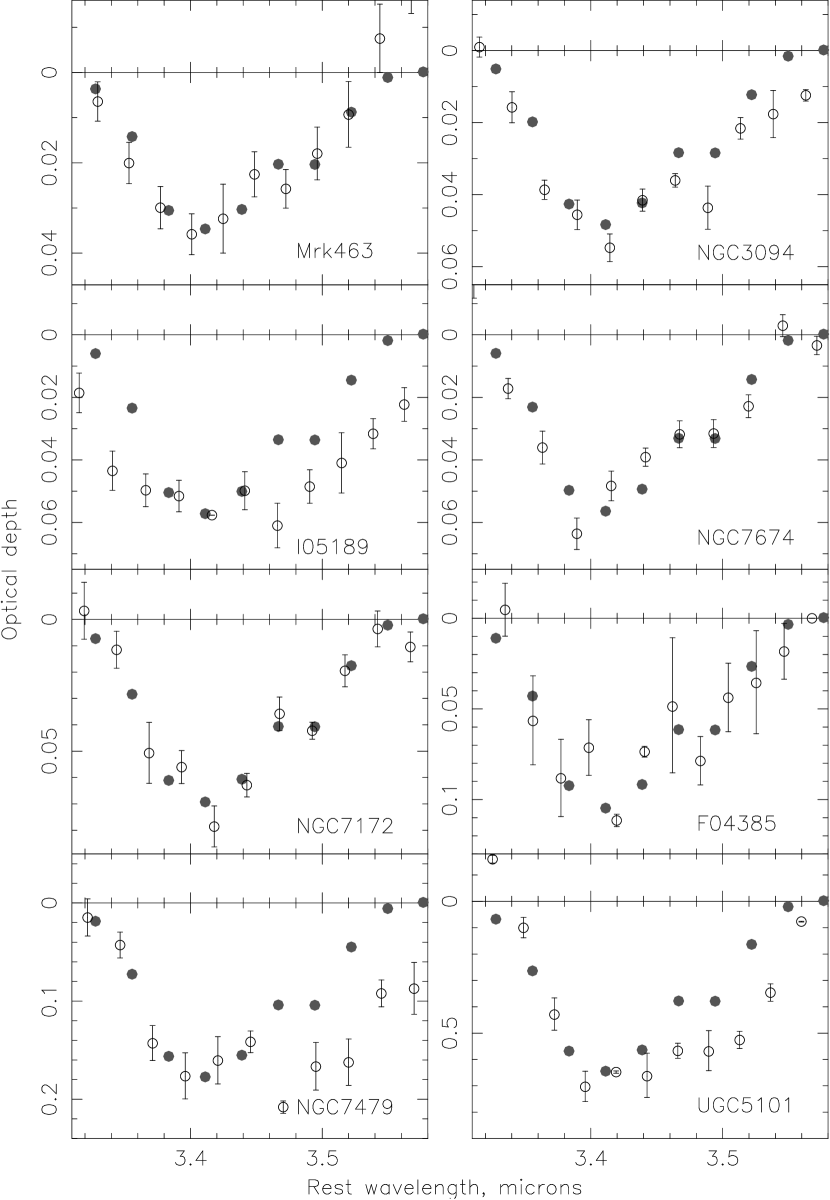
Fig. 4 compares the 3.4m feature in NGC1068 with the 3.4m feature observed in the diffuse ISM towards the Galactic center source, IRS6E, and in the protoplanetary nebula, CRL618. In Figures 5 and 6, the 3.4m feature in NGC1068 is compared with that of the ten other galaxies in which the feature has been clearly detected to date444The 3.4m absorption has also been seen in a twelfth galaxy, NGC5506 (Imanishi, 2000a). However, the weakness of the feature in that galaxy () means that its detection, depth and profile are critically dependent on the choice of baseline against which is measured. Atmospheric absorption lines at the short end of the spectrum, which do not cancel out well in this dataset, make it impossible to unambiguously determine this baseline, so we do not consider NGC5506 any further..
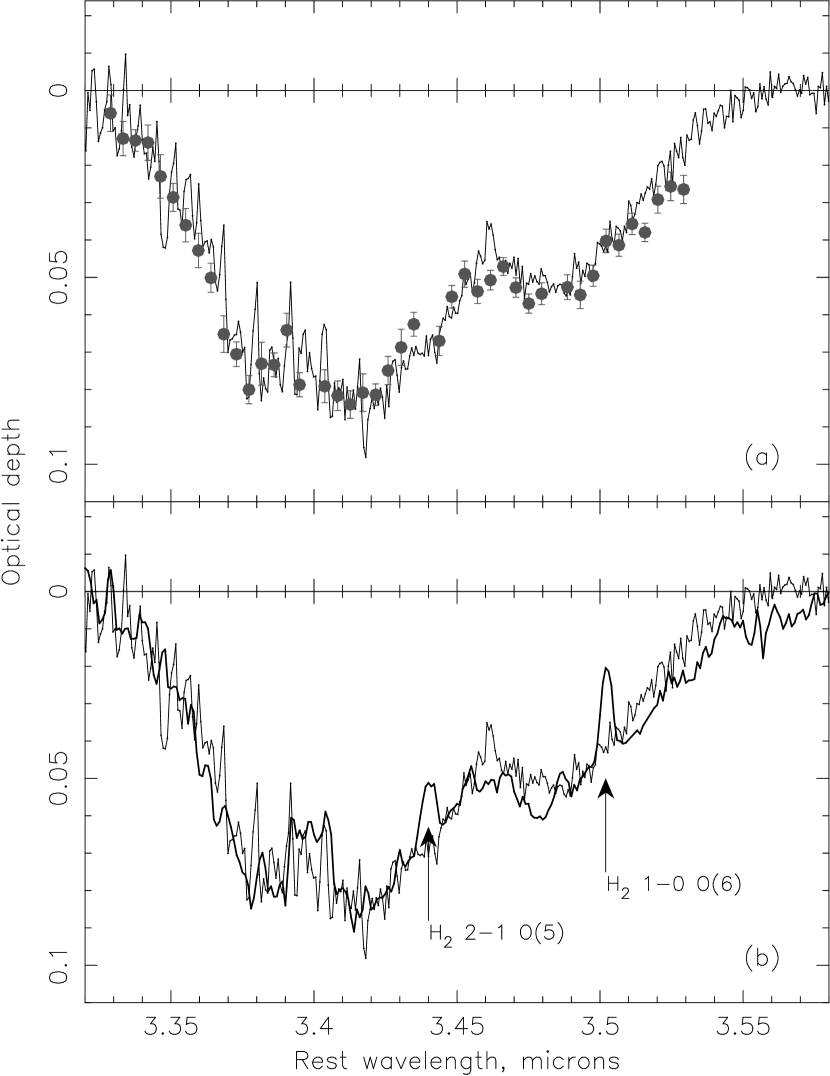
Probably the most striking aspect of Fig. 4 is the close resemblance that the 3.4m feature in NGC1068 bears to that observed in the Galactic lines of sight. The 3.4m absorption in this Seyfert 2 nucleus clearly exhibits the same subpeaks that are observed in the feature in the Galactic diffuse ISM and the protoplanetary nebula: the 3.38m CH3 asymmetric stretch, 3.42m CH2 asymmetric stretch and 3.48m CH3 symmetric stretch. As in the other spectra, the 3.50m CH2 symmetric stretch band is not clearly present, an observation interpreted by Sandford et al. (1991) as the possible effect of electron-withdrawing groups attached to the hydrocarbon chains which give rise to the feature (see §6.1). Not only are the peak wavelengths good matches, but the relative strengths of the subfeatures are also very similar between NGC1068 and the other objects. This indicates that the relative numbers of CH3 and CH2 groups, and therefore the average lengths of the hydrocarbon chains, are very similar in all the lines of sight. The new NGC1068 data confirm in more detail the findings of Wright et al. (1996) and Imanishi et al. (1997).
Besides the Galactic diffuse ISM and CRL618, the 3.4m feature in NGC1068 is very much like the feature in IRAS08572 and IRAS19254 (Fig. 5). Hydrocarbons in IRAS08572, in particular, produce a 3.4m band which is virtually identical to that caused by hydrocarbons in the nuclear region of NGC1068. Some small differences appear in the spectrum of IRAS19254. The feature in this ULIRG exhibits the same subfeatures and general shape, but, in the binned spectrum presented by Risaliti et al. (2003), the peak around 3.48m is slightly stronger than that in NGC1068 and the Galactic center. In our new reduction of these data this difference is less noticeable, but the 3.38m CH3 asymmetric stretch is a little more prominent than in the other lines of sight. Overall, though, the feature bears quite a close resemblance to that in all of the other lines of sight examined so far.
Although at much lower S/N, about half of the remaining galaxies show a similar pattern of a peak near 3.42m accompanied by a shoulder around 3.48m, in roughly the same proportions as in NGC1068 and the Galactic sightlines (Fig. 6). Interestingly, the remainder of the sample hints at differences. In particular, the ratio may be lower in UGC5101, NGC7479 and IRAS05189 than in NGC1068. However, in the absence of higher-S/N data on the 3.4m feature in these galaxies, further speculation seems premature.
5 The nuclear mid-IR spectrum of
NGC1068
As dust absorption features in the mid-IR have been shown to be a powerful tool for discriminating between models for dust composition and evolution (Pendleton & Allamandola, 2002), it would be instructive to compare 5-9m spectra of these galaxies with each other and with the laboratory data. To date, such a comparison has been attempted for only one line of sight, towards Sgr A* in the Galactic center (Chiar et al., 2000; Pendleton & Allamandola, 2002). The mid-IR spectrum of the diffuse interstellar dust in that line of sight is remarkably sparse, the only features being the asymmetric and symmetric bending modes of C−H bonds, at 6.85 and 7.25m respectively. In this regard the spectrum of Sgr A* is similar to the spectra of plasma-processed carbon materials (representing dust formed in stellar outflows), but very different from the more complex spectra of processed ice residues and the Murchison meteorite spectrum of de Vries et al. (1993), which display additional features due to functional groups such as NH, CO and OH. All of these classes of material can exhibit a 3.4m feature which is a close match to the diffuse ISM data, yet they vary greatly at longer wavelengths.
Of the galaxies with the best-quality L-band spectra, no mid-IR data yet exist for IRAS08572. PAH emission bands complicate the interpretation of the MIR spectrum of IRAS19254 (Charmandaris et al., 2002). An ISOCAM CVF 5-16m spectrum of the central 700pc (10″, ) of NGC1068 has been published by Le Floc’h et al. (2001), while at higher spectral resolution (), ISO-SWS has covered the full 2-45m range (Lutz et al., 2000; Sturm et al., 2000). The aperture through which the ISO-SWS spectrum was observed covers 14″20″ at wavelengths shorter than 12m, large enough to include some flux from the kiloparsec-scale region of star formation in NGC1068. However, the weakness of the PAH emission bands in this spectrum and their similarity to those in the smaller-aperture ISOCAM-CVF spectrum suggests that the ISO-SWS data are dominated by the region of dust close to the nucleus towards which we measured the 3.4m feature. We therefore use this spectrum to assess whether the similarity of the 3.4m feature in NGC1068 to that observed in the Galactic diffuse ISM is accompanied by a mid-IR spectrum also resembling that of the Galactic diffuse ISM.
To establish the presence or absence of mid-IR absorption features in NGC1068, the spectra were fitted with polynomial curves, with wavelengths m and m treated separately (Fig. 7). The broad emission structure between approximately 7.5 and 9m is a blend of two weak PAH bands (Sturm et al., 2000) and any hydrocarbon absorption features would be expected to be seen superimposed on this, so no attempt was made to find the underlying continuum in this region. As with the 3.4m feature, the fitted curves were used as baselines against which the optical depth of any absorption features in the spectrum could be measured. We measure for the ISO-SWS spectrum of NGC1068. The smaller value of in this spectrum than in Fig. 1 is likely to be due to the large ISO beam encompassing some less deeply obscured material than the smaller UIST aperture.
Also shown in Fig. 7 is a comparison of the NGC1068 ISO spectra with optical depth spectra of the line of sight towards Sgr A* in the Galactic center, the Murchison meteorite, and two laboratory materials which have been proposed as analogs of the hydrocarbon component of dust (Allamandola, Sandford & Valero, 1988; de Vries et al., 1993; Mennella et al., 1999; Chiar et al., 2000). These particular laboratory substances, a hydrogenated amorphous carbon (HAC) and the residue from a UV-irradiated ice, were chosen because, while they both have absorption at 3.4m, they have very different 5-9m spectra (Pendleton & Allamandola, 2002). The HAC sample produces some absorption below 3m and between the 3.4m feature and the 5-9m features, but such featureless absorption would be indistinguishable from the continuum level in the NGC1068 spectrum. This absorption was therefore subtracted from the HAC spectrum. All the comparison spectra have been multiplied by a constant in order to be normalized to .
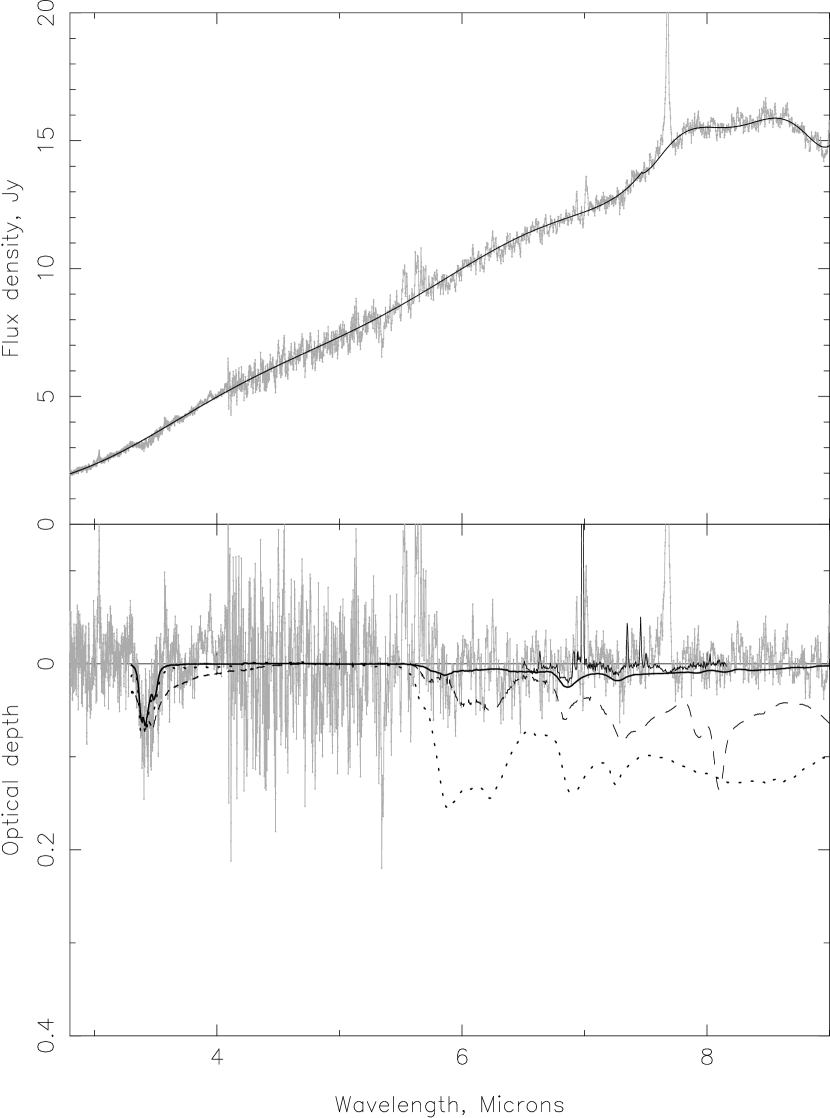
The detailed similarity of NGC1068 and Sgr A* is difficult to ascertain. It is apparent from Fig. 7 that if dust resembling that in the Galactic diffuse ISM is present in the nucleus of NGC1068, we should not expect to be able to detect and compare the 6.85 and 7.25m C−H bends which accompany the 3.4m band. The weakness of these features in the Galactic center spectrum, approximately 0.24 and 0.14 times the depth of the 3.4m feature in that line of sight (Chiar et al., 2000), would make them undetectable in the spectra of NGC1068. The same is true for the laboratory spectrum of the HAC (Mennella et al., 1999). This leaves open the possibility that weak bands exist in NGC1068 which are not observed in the Galactic center. On the other hand, Fig. 7 suggests that if the strong bands arising in the spectra of the ice residue (Allamandola et al., 1988) and the meteorite (de Vries et al., 1993) were present in the NGC1068 data, they would be clearly visible. As with the 3.4m feature, the dust in NGC1068 could have had a very different 5-9m spectrum from that of Galactic dust, but large differences are not observed.
6 Discussion
6.1 Interpreting small changes in the profile of the 3.4m feature
In §4, it was noted that the 3.4m feature in IRAS19254, while overall a good match to that observed in other lines of sight, may show some small differences in the relative depths of the subpeaks within the feature. Risaliti et al. (2003) suggest that the higher depth of the 3.48m subfeature in their spectrum of IRAS19254 may be attributed to increased numbers of electronegative groups in the grains. In pure saturated aliphatic hydrocarbons (compounds with the general formula CnH2n+2, e.g. propane, butane), four subpeaks are visible within the 3.4m feature, rather than the three which can be seen in the astronomical spectra. The four peaks are caused by symmetric and asymmetric stretches of CH2 and CH3 groups. As the symmetric stretch features lie closer together than the asymmetric stretch bands, shifts in band frequencies caused by nearby electron-withdrawing groups are more likely to cause blending of the symmetric stretch features. This effect could account for the apparent disappearance of the 3.50m CH2 symmetric stretch band in the astronomical spectra, which may in fact simply have been shifted to a position coincident with the 3.48m CH3 subfeature (Sandford et al., 1991).
Therefore it is plausible that an increase in the number of electronegative groups could shift the CH2 symmetric stretch band further under the CH3 symmetric stretch band, marginally enhancing the depth of the CH3 subfeature at 3.48m. Alternatively, given the slight increase in the strength of the CH3 asymmetric stretch band at 3.38m in IRAS19254, we could be observing a decrease in the typical length of the hydrocarbon chains in the dust. Or, conversely, an increase in the length of the chains could be supressing the symmetric stretch features with respect to the asymmetric stretching bands (Cernicharo et al., 2001). In fact, while overall trends in the shape of this feature are governed by factors such as chain length and the presence of elements other than C and H in the chains, these factors act together in a very complex manner to influence the details of the feature profile. Although variations in the shape of the 3.4m feature undoubtedly reflect the chemical composition of the material which gives rise to it, it is difficult to ascribe small changes in the 3.4m feature in complex mixtures of hydrocarbons to particular, specific chemical changes with much confidence.
6.2 The chemical makeup of the carbonaceous dust in other galaxies
It is clear that, certainly in the galaxies with the best data — NGC1068, IRAS08572 and IRAS19254 — the 3.4m feature varies only slightly from galaxy to galaxy and is very similar to that observed in Galactic lines of sight. In addition, about half of the other galaxies with lower-S/N detections of the 3.4m band have features with profiles consistent with that of NGC1068.
One explanation for the similarity of the 3.4m feature in several different galaxies may be that the spectra of different hydrocarbon-containing substances are simply averaging out to the observed spectrum. This may well be the case for small variations in the band profile, but it is less plausible that large, systematic differences in the 3.4m band in different environments could be masked in this way. If, for instance, dust in IRAS08572 generally contained a much higher fraction of longer hydrocarbon chains than dust in NGC1068, this would be expected to enhance the subpeaks corresponding to CH2 groups. That some of the galaxies in this sample do appear to show differences in the band profile, as do complex laboratory mixtures of hydrocarbons, supports this view. It appears that, whatever other differences there may be in the dust in other galaxies, the hydrocarbon fraction bears a close resemblance to that which we observe in Galactic lines of sight.
While the 3.4m feature relates directly only to the saturated hydrocarbon chains, the similarity of the band in several different lines of sight may actually reflect overall compositional similarity in the dust. Based on fits to the 3.4m feature, a number of analog materials produced by different mechanisms have been suggested to represent the carbonaceous component of dust. Pendleton et al. (1994) show that certain processed carbon-rich ice residues can produce about as good a match to the interstellar 3.4m feature as those produced from carbon plasmas, for example. Only inconsistencies with observations in the 5-9m region rule out processed ices as good analogs of interstellar dust (Pendleton & Allamandola, 2002). This means that the 3.4m absorption alone is not the ideal tool with which to probe dust composition and evolution. On the other hand, there also exist plenty of dust candidate materials with 3.4m bands which clearly differ from each other and from the astronomical spectra. This is illustrated in Fig. 8, which compares the 3.4m band in three different hydrocarbon-containing substances. Band profiles as varied as these would be easily distinguishable in spectra with the S/N and resolution as those of at least three of the galaxies for which L-band data exist.

If the dust in NGC1068, IRAS08572 and IRAS19254 were formed by a completely different mechanism from Galactic dust and/or underwent different processing, then it is certainly possible that this would be apparent from the profile of the 3.4m feature. Instead we observe that the bands in these galaxies are as good a match to each other and to Galactic spectra as are any laboratory spectra. Rather than different processes which coincidentally produce materials with almost identical features, the similarity of the feature in these extragalactic lines of sight suggests similar dust formation and/or processing mechanisms to those responsible for the feature in the Galactic diffuse ISM. The mid-IR spectrum of NGC1068, which, like that of the Galactic center, shows no indication of the deep absorption features produced by many materials proposed as analogs of carbonaceous dust, supports this interpretation. The mismatch between a dust analog material, the Murchison meteorite and NGC1068 emphasizes that, even though materials which bear a close resemblance at 3.4m can have very different mid-IR spectra, gross differences are not observed between the Galactic diffuse ISM and nuclear dust in NGC1068. This supports the suggestion that the nuclear carbon-containing dust in NGC1068 is genuinely chemically similar to that in the Galactic diffuse ISM. Further mid-IR studies of other galaxies, notably IRAS08572, will be invaluable in determining the full extent of this similarity.
6.3 Dust production and survival in galaxies
That the dust in some Seyfert galaxies and ULIRGs appears to resemble that towards the Galactic center and in CRL618 is intriguing. Can this uniformity reveal anything about the specific production mechanism of the hydrocarbon solids, the sensitivity of this mechanism to environmental conditions, or the chemical and physical conditions of the regions in which the carrier of the 3.4m band is formed?
The debate over the origins of the carbonaceous fraction of interstellar dust centers around two main formation mechanisms: photochemical reactions in the icy grain mantles found in molecular clouds, and condensation in stellar outflows followed by competing processes of dehydrogenation and reformation of C−H bonds in the diffuse ISM (e.g. Li & Greenberg, 1997; Chiar et al., 1998; Mennella et al., 2003). Laboratory experiments show that irradiation of carbon-rich ice mixtures can indeed give rise to material which absorbs at 3.4m, but the profile of the band is sensitive to the composition of the initial ice mixture. This contrasts with the very uniform behavior of the astronomical 3.4m band both in the galaxies examined here and in Galactic lines of sight. Laboratory analogs of dust produced in stellar outflows involve processes such as exposing amorphous carbon grains or graphite to hydrogen, or passing an electric or microwave-powered discharge through gaseous methane or other hydrocarbon compound (see Pendleton & Allamandola, 2002, and references therein, for examples). While there is some variation in the 3.4m band in the resulting materials, in all cases but that of the CH4 plasma/microwave discharge, this is not very pronounced. However, in experiments mimicing dust formation in carbon-rich circumstellar shells, Grishko & Duley (2002) have shown that the 3.4m feature profile is influenced by the presence of elements other than C and H. NH3 and N2 cause the individual CH2 and CH3 subpeaks to become less distinct, whereas O2 causes absorption to be replaced by scattering-induced emission. The sensitivity of the 3.4m band profile to environmental conditions in both of these formation scenarios, in contrast with the lack of variation in the feature now observed in a number of galaxies, suggests that the conditions necessary for the formation of the band carrier are common and quite invariant in evolved stars and the diffuse ISM in a range of galaxies.
It is also possible that further processing of the dust grains after their formation induces a degree of uniformity in their composition and in the profile of the 3.4m band. Greenberg et al. (1995) present spectra of ice residues exposed to the solar radiation field for four months aboard the EURECA satellite and point out the very good resemblance borne by the 3.4m feature in these samples to that of the Galactic diffuse ISM. The samples were synthesized from initial ice mixtures of somewhat different compositions, and irradiated in the laboratory before further irradiation in space. This raises the possibility that prolonged UV exposure could cause initially varied 3.4m bands to converge on the observed, astronomical profile. However, in no case was the spectrum prior to solar irradiation recorded, and the spectra of 13 other samples which also flew were not presented, so this hypothesis currently remains untested. As for dust produced in circumstellar shells, Grishko & Duley (2002) find that the differences in the 3.4m band formed in the presence of O and N often disappear when the dust is heated to 500∘C. If aliphatic hydrocarbons are synthesized in regions of circumstellar envelopes which attain this temperature, this could naturally explain the lack of variation in the resulting 3.4m feature. Observationally, the 3.4m band has only been detected so far in one PPNe (CRL618; Lequeux & Jourdain de Muizon, 1990; Chiar et al., 1998); detection in a range of evolved stars, with information on physical and chemical conditions, could show whether the feature profile is insensitive to the conditions under which it forms, or whether the necessary conditions are in fact widespread.
As both the ice photolysis and stellar outflow routes to dust production are capable of producing a 3.4m band which matches the observations quite well, that feature alone cannot be used to distinguish decisively between these two mechanisms. However, as discussed in §5 and §6.2, the mid-IR spectrum of NGC1068, like that of Sgr A*, shows none of the strong mid-IR bands which appear in spectra of photolysed ices. This means that none of the ice residues currently proposed as analogs of carbonaceous dust is really a viable candidate. The four months’ irradiation of the Greenberg et al. (1995) samples is roughly equivalent to one passage of a dust grain through the diffuse ISM before re-entering a molecular cloud, and a typical grain will experience many such episodes during its 109yr lifetime. Greenberg et al. (1995) predict that further UV exposure will remove O, N and H atoms, thus weakening the troublesome mid-IR spectral features. Each time the grain enters a molecular cloud, though, it will acquire a new ice coating containing precisely these atoms, so it is not obvious that the mid-IR bands will be diminished sufficiently to match the observations. The weight of evidence concerning Galactic hydrocarbon-containing dust now tends to support an origin in circumstellar environments and the diffuse ISM (Chiar et al., 1998; Adamson et al., 1999; Pendleton & Allamandola, 2002; Mennella et al., 2003; Shenoy et al., 2003), and the mid-IR spectrum of NGC1068 supports this view.
That the 3.4m absorption has been detected in ULIRGs and Seyfert galaxies clearly means that the band carrier is capable of surviving in these galaxies. ULIRGS are characterized by energy densities 3-4 orders of magnitude greater than those in the solar neighborhood (Maloney, 1999). Interestingly, Heckman & Lehnert (2000) find that certain properties of the diffuse interstellar bands in starburst galaxies are similar to those in Galactic lines of sight. Despite very high rates of energy deposition into the ISM, the ratios of the strengths of the bands and their correlation with reddening are roughly the same in the starbursts as in the Galactic diffuse ISM. The authors speculate that this is because, while the energy densities in these galaxies are large, the ISM pressure is increased by a corresponding amount. Maloney (1999) calculates that, like the energy densities, the pressure in the ISM of ULIRGs is also 3-4 orders of magnitude greater than the ISM pressure in the solar neighborhood, and that this, coupled with a large shielding column of dust, can be sufficient to protect even the fragile PAHs from X-ray destruction in AGN-powered ULIRGs. In IRAS08572 and IRAS19254, where the 3.4m band bears a good resemblance to that in the Galactic diffuse ISM, N (Table 1), presumably providing a great deal of shielding.
As discussed in §2.1, the 3.4m feature in face-on Seyfert 2 galaxies is likely to arise in dust local to the active nucleus. The exotic chemistry of the circumnuclear clouds in NGC1068 shows signs of being influenced by the X-ray flux from the central engine (Sternberg, Genzel & Tacconi, 1994; Usero et al., 2003), so it is reasonable to ask whether X-ray emission in AGN might also influence the hydrocarbon dust. Given that the 3.4m feature is observed in absorption, however, the environment in which the carbonaceous dust exists may not be as harsh as might be expected. The nuclei of NGC1068 and NGC7674 are obscured at both hard and soft X-ray energies (see Table 1), and H2 emission is concentrated on either side of the nuclear IR flux peak in NGC1068 (Galliano & Alloin, 2002; Gratadour et al., 2003). These observations suggest that the absorbing dust is exposed to neither X-rays nor UV photons, which would be attenuated by the large () column of warmer dust between it and the nucleus. Similarly, the absence of 3.3m PAH emission in the smallest-aperture L-band spectra of NGC1068 could reflect not destruction of the molecules in a harsh environment, but simply lack of an excitation mechanism. In some of the other Seyfert galaxies the shielding column is considerably smaller than in NGC1068 and NGC7674. These galaxies are closer to edge-on, meaning that some of the dust in the line of sight may be far from the nucleus. As the scale heights of dust in spiral galaxies tend to be small (Alton et al., 2000), though, these spectra are likely to still contain a substantial contribution from nuclear dust. This suggests that the hydrocarbons in the dust in these galaxies are robust enough to survive unchanged in quite harsh conditions.
7 Conclusions
We have shown that the 3.4m C−H bond stretch of interstellar dust in the Seyfert galaxy, NGC1068, and two ULIRGs, IRAS08572 and IRAS19254, has a very similar profile to that seen in Galactic carbonaceous material. Of the other galaxies in which the 3.4m feature has been detected at much lower S/N, several also have feature profiles consistent with that of NGC1068. Although minor differences are seen between IRAS19254 and other objects, these differences are small compared with the variations that are capable of occurring in hydrocarbon chains of varying lengths and in differing chemical environments. This implies that the hydrocarbon portion of the carbonaceous dust in these galaxies bears a close resemblance to that which exists in our own Galaxy, probably as a result of the dust having a similar formation and processing history to that in the Galactic diffuse ISM. Examination of the mid-IR spectrum of NGC1068 reveals none of the strong absorption bands characteristic of many materials proposed as analogs of carbonaceous dust. Although features like those present in the mid-IR spectrum of the Galactic center would be undetectable in the available data for NGC1068, the lack of major differences is consistent with the suggestion that the dust in this AGN is chemically very similar to dust in the Galactic diffuse ISM. It also suggests that condensation in circumstellar environments, rather than processing of icy grain mantles, is the dominant source of carbonaceous dust in many galaxies. Higher S/N spectroscopy at 3.4 and 5-9m, particularly of the galaxies whose lower S/N spectra hint at different feature profiles, will prove invaluable in assessing whether this remarkable chemical similarity is a common feature of active, ultraluminous and quiescent galaxies alike.
References
- Adamson, Whittet & Duley (1990) Adamson, A. J., Whittet, D. C. B., & Duley, W. W., 1990, MNRAS, 243, 400
- Adamson et al. (1999) Adamson, A. J., Whittet, D. C. B., Chrysostomou, A., Hough, J. H., Aitken, D. K., Wright, G. S., & Roche, P. F. 1999, ApJ, 512, 224
- Allamandola et al. (1988) Allamandola, L. J., Sandford, S. A., & Valero, G. J. 1988, Icar, 76, 225
- Alpert, Keiser & Szymanski (1970) Alpert, N., Keiser, W., & Szymanski, H. 1970, Theory and Practice of Infrared Spectroscopy (2nd Ed.; New York: Plenum Press)
- Alton et al. (2000) Alton, P. B., Rand, R. J., Xilouris, E. M., Bevan, S., Ferguson, A. M., Davies, J. I., & Bianchi, S. 2000, A&AS, 145, 83
- Antonucci & Miller (1985) Antonucci, R, & Miller, J., 1985, ApJ, 297, 621
- Bassani et al. (1999) Bassani, L., Dadina, M., Maiolino, R., Salvati, M., Risaliti, G., della Ceca, R., Matt, G., & Zamorani, G., 1999, ApJS, 121, 473
- Bridger, Wright & Geballe (1994) Bridger, A., Wright, G. S., & Geballe, T. R. 1994, in ASSL Vol. 190, Infrared Astronomy with Arrays, The Next Generation, ed. Ian S. McLean (Dordrecht: Kluwer Academic Publishers), p.537
- Butchart et al. (1986) Butchart, I., McFadzean, A. D., Whittet, D. C. B., Geballe, T. R., & Greenberg, J. M. 1986, A&A, 154L, 5
- Cernicharo et al. (2001) Cernicharo, J., Heras, A. M., Pardo, J. R., Tielens, A. G. G. M., Guélin, M., Dartois, E., Neri, R., & Waters, L. B. F. M. 2001, ApJ, 546L, 127
- Charmandaris et al. (2002) Charmandaris, V., Laurent, O., Le Floc’h, E., Mirabel, I. F., Sauvage, M., Madden, S. C., Gallais, P., Vigroux, L., & Cesarsky, C. J. 2002, A&A, 391, 429
- Chiar et al. (1998) Chiar, J. E., Pendleton, Y. J., Geballe, T. R., & Tielens, A. G. G. M. 1998, ApJ, 507, 281
- Chiar et al. (2000) Chiar, J. E., Tielens, A. G. G. M., Whittet, D. C. B., Schutte, W. A., Boogert, A. C. A., Lutz, D., van Dishoeck, E. F., & Bernstein, M. P. 2000, ApJ, 537, 749
- Chiar et al. (2002) Chiar, J. E., Adamson, A. J., Pendleton, Y. J., Whittet, D. C. B., Caldwell, D. A., & Gibb, E. L., 2002, ApJ, 570, 198
- Cronin & Pizzarello (1990) Cronin, J. R., & Pizzarello, S. 1990, GeCoA, 54, 2859
- de Vaucouleurs et al (1991) de Vaucouleurs, G., de Vaucouleurs, A., Corwin, H., Buta, R., Paturel, G., & Fouque, P. 1991, Third Reference Catalogue of Bright Galaxies (Berlin: Springer)
- de Vries et al. (1993) de Vries, M. S., Reihs, K., Wendt, H. R., Golden, W. G., Hunziker, H. E., Fleming, R., Peterson, E., & Chang, S. 1993, GeCoA, 57, 933
- Dartois et al. (2004) Dartois, E., Marco, O., Muñoz-Caro, G., Brooks, K., Deboffle, D., & d’Hendecourt, L. 2004, A&A, in press
- Devillard (1997) Devillard, N. 1997, The Messenger, 87
- Furton, Laiho & Witt (1999) Furton, D. G., Laiho, J. W., & Witt, A. N. 1999, ApJ, 526, 752
- Galliano & Alloin (2002) Galliano, E., & Alloin, D., 2002, A&A, 393, 43
- García-Gómez, Athanassoula & Barberà (2002) García-Gómez, C., Athanassoula, E., & Barberà, C. 2002, A&A, 389, 68
- Gratadour et al. (2003) Gratadour, D., Clénet, Y., Rouan, D., Lai, O., & Forveille, T. 2003, A&A, 411, 335
- Greenberg et al. (1995) Greenberg, J. M., Li, A., Mendoza-Gomez, C. X., Schutte, W. A., Gerakines, P. A., de & Groot, M. 1995, ApJ, 455L, 177
- Grishko & Duley (2002) Grishko, V. I., & Duley, W. W., 2002, ApJ, 568, 448
- Heckman & Lehnert (2000) Heckman, T., & Lehnert, M., 2000, ApJ, 557, 690
- Imanishi et al. (1997) Imanishi, M., Terada, H., Sugiyama, K., Motohara, K.,Goto, M., & Maihara, T. 1997, PASJ, 49, 69
- Imanishi et al. (1996) Imanishi, M., Sasaki, Y., Goto, M., Kobayashi, N., Nagata, T., & Jones, T., 1996, AJ, 112, 235
- Imanishi (2000a) Imanishi, M. 2000, MNRAS, 313, 165
- Imanishi (2000b) Imanishi, M. 2000, MNRAS, 319, 331
- Imanishi & Dudley (2000) Imanishi, M., & Dudley, C., 2000, ApJ, 545, 701
- Imanishi et al. (2001) Imanishi, M., Dudley, C., & Maloney, P. 2001, ApJ, 558L, 93
- Imanishi (2002) Imanishi, M. 2002, ApJ, 569, 44
- Imanishi (2003) Imanishi, M. 2003, ApJ, 599, 918
- Imanishi et al. (2003) Imanishi, M., Terashima, Y., Anabuki, N., & Nakagawa, T. 2003, ApJ, 596L, 167
- Ishii et al. (2002) Ishii, M., Nagata, T., Chrysostomou, A., & Hough, J. H. 2002, AJ, 124, 2790
- Kinney et al. (2000) Kinney, A. L., Schmitt, H. R., Clarke, C. J., Pringle, J. E., Ulvestad, J. S., & Antonucci, R. R. J., 2000, ApJ, 537, 152
- Le Floc’h et al. (2001) Le Floc’h, E., Mirabel, I. F., Laurent, O., Charmandaris, V., Gallais, P., Sauvage, M., Vigroux, L., & Cesarsky, C. 2001,A&A, 367, 487
- Lequeux & Jourdain de Muizon (1990) Lequeux, J., & Jourdain de Muizon, M. 1990, A&A, 240L, 19
- Li & Greenberg (1997) Li, A., & Greenberg, J. M. 1997, A&A, 323, 566
- Lutz et al. (2000) Lutz, D., Sturm, E., Genzel, R., Moorwood, A. F. M., Alexander, T., Netzer, H., & Sternberg, A. 2000, ApJ, 536, 697
- Maloney (1999) Maloney, Philip R. 1999, Ap&SS, 266, 207
- Marco & Brooks (2003) Marco, O., & Brooks, K., 2003, A&A 398, 101
- McFadzean et al. (1989) McFadzean, A. D., Whittet, D. C. B., Bode, M. F., Adamson, A. J., & Longmore, A. J. 1989, MNRAS, 241, 873
- Mennella et al. (1999) Mennella, V., Brucato, J. R., Colangeli, L., & Palumbo, P. 1999, ApJ, 524L, 71
- Mennella et al. (2003) Mennella, V., Baratta, G. A., Esposito, A., Ferini, G., & Pendleton, Y. J. 2003, ApJ, 587, 727
- Mizutani, Suto & Maihara (1994) Mizutani, K., Suto, H., & Maihara, T 1994, ApJ, 421, 475
- Nagar & Wilson (1999) Nagar, N., & Wilson, A. 1999, ApJ, 516, 97
- Pendleton et al. (1994) Pendleton, Y. J., Sandford, S. A., Allamandola, L. J., Tielens, A. G. G. M., & Sellgren, K. 1994, ApJ, 437, 683
- Pendleton (1996) Pendleton, Y. J. 1996, in ASSL Vol. 209, New Extragalactic Perspectives in the New South Africa, ed. D. Block & J. Greenberg (Dordrecht: Kluwer Academic Publishers), p.135
- Pendleton (1997) Pendleton, Y. J. 1997, OLEB, 27, 53
- Pendleton & Allamandola (2002) Pendleton, Y. J., & Allamandola, L. J. 2002, ApJS, 138, 75
- Rawlings, Adamson & Whittet (2003) Rawlings, M. G., Adamson, A. J., & Whittet, D. C. B. 2003, MNRAS, 341, 1121
- Risaliti et al. (2003) Risaliti, G., Maioliono, R., Marconi, A., Bassani, L., Berta, S., Braito, V., Della Ceca, R., Franceschini, A., & Salvati, M. 2003, ApJ, 595L, 17
- Risaliti et al. (2000) Risaliti, G., Gilli, R., Maiolino, R., & Salvati, M. 2000, A&A, 357, 13
- Rouan et al. (2004) Rouan, D., Lacombe, F., Gendron, E., Gratadour, D., Clénet, Y., Lagrange, A.-M., Mouillet, D., Boisson, C., Rousset, G., Fusco, T., and 7 coauthors 2004, A&A, 417, 1
- Sakata et al. (1987) Sakata, A., Wada, S., Onaka, T., & Tokunaga, A. 1987, ApJ, 320L, 63
- Sandford et al. (1991) Sandford, S. A., Allamandola, L. J., Tielens, A. G. G. M., Sellgren, K., Tapia, M., & Pendleton, Y., 1991, ApJ, 371, 607
- Sandford, Pendleton & Allamandola (1995) Sandford, S. A., Pendleton, Y. J., & Allamandola, L. J. 1995, ApJ, 440, 697
- Scoville et al. (2000) Scoville, N. Z., Evans, A. S., Thompson, R., Rieke, M., Hines, D. C., Low, F. J., Dinshaw, N., Surace, J. A., & Armus, L. 2000, AJ, 119, 991
- Shenoy et al. (2003) Shenoy, S. S., Whittet, D. C. B., Chiar, J. E., Adamson, A. J., Roberge, W. G., & Hassel, G. E., 2003, ApJ, 591, 962
- Sternberg, Genzel & Tacconi (1994) Sternberg, A., Genzel, R., & Tacconi, L. 1994, ApJ, 436L, 131
- Sturm et al. (2000) Sturm, E., Lutz, D., Tran, D., Feuchtgruber, H., Genzel, R., Kunze, D., Moorwood, A. F. M., & Thornley, M. D. 2000, A&A, 358, 481
- Tomono et al. (2001) Tomono, D., Doi, Y., Usuda, T., & Nishimura, T. 2001, ApJ, 557, 637
- Usero et al. (2003) A. Usero, S. Garcia-Burillo, A. Fuente, & J. Martin-Pintado 2003, astro-ph/0402556
- Whittet et al. (1997) Whittet, D. C. B., Boogert, A. C. A., Gerakines, P. A., Schutte, W., Tielens, A. G. G. M., de Graauw, Th., Prusti, T., van Dishoeck, E. F., Wesselius, P. R., & Wright, C. M. 1997, ApJ, 490, 729
- Whittle (1992) Whittle, M. 1992, ApJS, 79, 49
- Wright et al. (1996) Wright, G., Bridger, A., Geballe, T., & Pendleton, Y. 1996, in ASSL Vol. 209, New Extragalactic Perspectives in the New South Africa, ed. D. Block & J. Greenberg (Dordrecht: Kluwer Academic Publishers), p.143
GC IRS6 (catalog ) CRL618 (catalog ) IRAS04385-0828 (catalog ) IRAS05189-2524 (catalog ) IRAS08572+3915 (catalog ) IRAS19254-7245 (catalog ) NGC1068 (catalog ) NGC3094 (catalog ) NGC5506 (catalog ) NGC7172 (catalog ) NGC7674 (catalog ) NGC7479 (catalog ) UGC5101 (catalog ) Mrk463 (catalog )