On the constraining observations of the dark GRB 001109 and the properties of a 0.398 radio selected starburst galaxy contained in its error box††thanks: Based on observations made with telescopes at the Centro Astronómico Hispano Alemán (1.23 m + 3.50 m), at the Observatorio del Roque de los Muchachos (NOT + WHT), at the United States Naval Observatory (1.00 m) and at the Russian Academy of Sciences’s Special Astrophysical Observatory (6.05 m). The NOT is operated on the island of San Miguel de la Palma jointly by Denmark, Finland, Iceland, Norway and Sweden, in Spain’s Observatorio del Roque de los Muchahos of the Instituto de Astrofísica de Canarias. The Centro Astronómico Hispano Alemán is operated in Calar Alto by the Max-Planck Institut für Astronomie of Heidelberg, jointly with Spain’s Comisión Nacional de Astronomía.
We present optical and NIR (near infrared) follow up observations of the GRB 001109 from 1 to 300 days after the burst. No transient emission was found at these wavelengths within this GRB’s (Gamma Ray Burst) 50″ radius BeppoSAX error box. Strong limits (3) are set with: 21, 10.2 hr after the GRB; 23, 11.4 hr after the GRB; 20.7, 9.9 hr after the GRB; and 20, 9.6 hours after the GRB. We discuss whether the radio source found in the GRB’s error box (Taylor et al. (2000)) might be related to the afterglow. We also present a multiwavelength study of a reddened starburst galaxy, found coincident with the potential radio and the ray afterglow. We show that our strong band upper limit makes of the GRB 001109 the darkest one localised by the BeppoSAX’s NFI (Narrow Field Instrument), and it is one of the most constraining upper limits on GRB afterglows to date. Further to it, the implications of these observations in the context of dark GRBs are considered.
Key Words.:
Gamma rays: bursts – Galaxy: fundamental parameters – Techniques: photometric1 Introduction
For the period spanning 1997–2001, approximately only one third of all GRBs (Gamma Ray Bursts) with well determined coordinates have had successful searches for optical counterparts (Greiner (2003)). Several mechanisms (Lazzati et al. (2002); Ramírez-Ruíz et al. (2002)) have been presented to explain the lack of optical counterparts despite the prompt/deep observations carried out for some of them (Fynbo et al. (2001); Piro et al. (2002)). It is thought that extinction around the progenitor and in the host galaxy plays a role in the non detection of the optical counterpart associated with dark GRBs (Groot et al. (1998); Taylor et al. (1998)).
The GRB 001109 was detected on 09.391169 UT November 2000 ( hereafter) by the BeppoSAX (Boella et al. (1997)) with a refined uncertainty of 2.5′ (Gandolfi et al. 2000a, 2000b ). A BeppoSAX NFI (Narrow Field Instrument) observation at + 16.5 hr detected a previously unknown source inside the 2.5′ radius WFC (Wide Field Camera) error box (Amati et al. (2000)). The source, designated 1SAX J1830.1+5517, had R.A. (J2000) 18h30m07.8s, Dec. (J2000) +55°17′56″ (error radius 50″) and a 2–10 keV flux of 7.1 0.5 10-13 erg cm-2 s-1. See Amati et al. (2003, 2004) for a detailed discussion of the ray properties.
A radio source (dubbed VLA J1830+5518) was found within the NFI error box with R.A.(J2000) 18h30m06.51s, Dec.(J2000) +55°18′35.7″ (conservative errors of 0.1″ in each coordinate) and a flux of 236 31 Jy at 8.46 GHz (Taylor et al. (2000)). It seemed to decrease in brightness over a time span of 2 days (Rol et al. (2000)), but further observations at the VLA for 390 days failed to reveal a consistent decay (Berger & Frail (2001)).
In this paper we report on the deep optical/NIR (near infrared) observations carried out for the GRB 001109 and their implications in the study of dark GRBs. Further we report on millimetre observations.
| Date UT | Telescope | Filtre | Exposure Time | Limiting Magnitude |
| (seconds) | (3) | |||
| 09.7708–09.8590/11/2000 | 1.23CAHA (CCD) | 7 500 | 20.9 | |
| 09.7847–09.8854/11/2000 | 1.23CAHA (CCD) | 3 600 | 20.3 | |
| 09.7848–09.7961/11/2000 | 4.20WHT (INGRID) | 750 | 19.9∗∗ | |
| 09.7968–09.8081/11/2000 | 4.20WHT (INGRID) | 750 | 21.0∗∗ | |
| 09.8083–09.8128/11/2000 | 4.20WHT (INGRID) | 300 | 21.3∗∗ | |
| 09.8447–09.8845/11/2000 | 2.56NOT (StanCam) | 4 600 | 22.9 | |
| 10.0876–10.1084/11/2000 | 1.00USNO (CCD) | 1 800 | 21.0 | |
| 10.7363–10.7883/11/2000 | 3.50CAHA (OMEGA Prime) | 10 300 | 20.5 | |
| 10.7618–10.8417/11/2000 | 1.23CAHA (CCD) | 9 500 | 20.9 | |
| 11.8191–11.8281/11/2000 | 4.20WHT (INGRID) | 600 | 20.7∗∗ | |
| 11.8292–11.8383/11/2000 | 4.20WHT (INGRID) | 600 | 19.4∗∗ | |
| 11.8423–11.8514/11/2000 | 4.20WHT (INGRID) | 600 | 21.4∗∗ | |
| 13.0560–13.0768/11/2000 | 1.00USNO (CCD) | 1 800 | 21.0 | |
| 22.1590–22.1938/11/2000 | 2.56NOT (ALFOSC) | 600 | 23.0 | |
| 22.8278–22.8444/11/2000 | 2.56NOT (ALFOSC) | 2 600 | 24.0 | |
| 23.8035–22.8194/11/2000 | 2.56NOT (ALFOSC) | 2 600 | 23.5 | |
| 26.7576–26.7618/11/2000 | 3.50CAHA (MOSCA) | 120 | 22.0 | |
| 27.7514–27.7556/11/2000 | 3.50CAHA (MOSCA) | 180 | 22.3 | |
| 22.1590–22.1938/05/2001 | 4.20WHT (PF) | 3 900 | 24.0 | |
| 22.1951–22.2079/05/2001 | 4.20WHT (PF) | 3 450 | 23.5 | |
| 29.1249–29.1795/05/2001 | 2.56NOT (ALFOSC) | 3 1 500 | 23.5 | |
| 30.1249–30.1723/05/2001 | 2.56NOT (ALFOSC) | 900 + 300 | 23.5 | |
| 31.0468–31.0548/05/2001 | 2.56NOT (ALFOSC) | 600 | 22.0 | |
| 18.0361–18.0924/06/2001 | 4.20WHT (PF) | 5 900 | 23.5 | |
| 30.0583–30.1361/06/2001 | 3.50CAHA (OMEGA Cass) | 120 60 | 21.0 | |
| 01.0354–01.1181/07/2001 | 3.50CAHA (OMEGA Cass) | 120 60 | 21.0 | |
| 24.8655–24.8828/07/2001 | 6.05SAO (SCORPIO) | 3 180 | 25.5 | |
| 14.0524–14.0734/08/2001 | 2.56NOT (ALFOSC) | 600 + 900 | 23.8 | |
| 14.9983–15.0223/08/2001 | 2.56NOT (ALFOSC) | 2 900 | 24.0 | |
| 16.0571–16.1169/08/2001 | 2.56NOT (ALFOSC) | 4 1 200 | 25.0 | |
| 16.9835–17.0570/08/2001 | 2.56NOT (ALFOSC) | 5 1 500 | 24.1 | |
| 17.0148–17.0720/08/2001 | 2.56NOT (ALFOSC) | 5 900 | 24.5 | |
| 17.0720–17.1148/08/2001 | 2.56NOT (ALFOSC) | 6 600 | 23.7 | |
| 05.9503–06.0220/08/2002 | 2.20CAHA (BUSCA) | 6 900 | 22.5 | |
| ∗ Greiner et al. (2000). Their band limiting magnitudes have been shifted to our zero point. | ||||
| ∗∗ Vreeswijk et al. (2000). Their band limiting magnitudes have been shifted to our zero point. | ||||
| The images from 30/6–01/07/2001 were coadded in just a single limiting magnitude, 21.0. | ||||
| RA(J2000) | Dec (J2000) | ||||||
|---|---|---|---|---|---|---|---|
| h m s | ° ′ ″ | ||||||
| 1 | 18 29 52.55 | +55 16 37.8 | 18.62 0.03 | 18.53 0.08 | 17.95 0.02 | 17.58 0.02 | 17.25 0.02 |
| 2 | 18 30 18.61 | +55 16 46.6 | 21.02 0.17 | 19.57 0.04 | 18.49 0.02 | 17.79 0.02 | 17.16 0.02 |
| 3 | 18 30 02.94 | +55 17 03.2 | 19.24 0.06 | 18.48 0.07 | 17.55 0.02 | 16.90 0.02 | 16.36 0.02 |
| 4 | 18 30 04.05 | +55 17 33.7 | 21.31 0.17 | 19.99 0.05 | 18.97 0.02 | 18.16 0.02 | 17.52 0.02 |
| 5 | 18 29 48.91 | +55 19 20.5 | 20.26 0.12 | 19.27 0.06 | 18.33 0.02 | 17.73 0.02 | 17.25 0.02 |
| 6 | 18 30 22.09 | +55 19 36.9 | 19.16 0.06 | 19.45 0.02 | 19.03 0.07 | 18.77 0.02 | 18.45 0.02 |
| 7 | 18 30 20.65 | +55 19 40.7 | 20.63 0.15 | 20.49 0.08 | 20.05 0.02 | 19.68 0.03 | 19.27 0.04 |
| 8 | 18 30 14.57 | +55 20 43.3 | 19.54 0.08 | 18.62 0.03 | 17.28 0.02 | 16.33 0.02 | 15.30 0.02 |
2 Observations
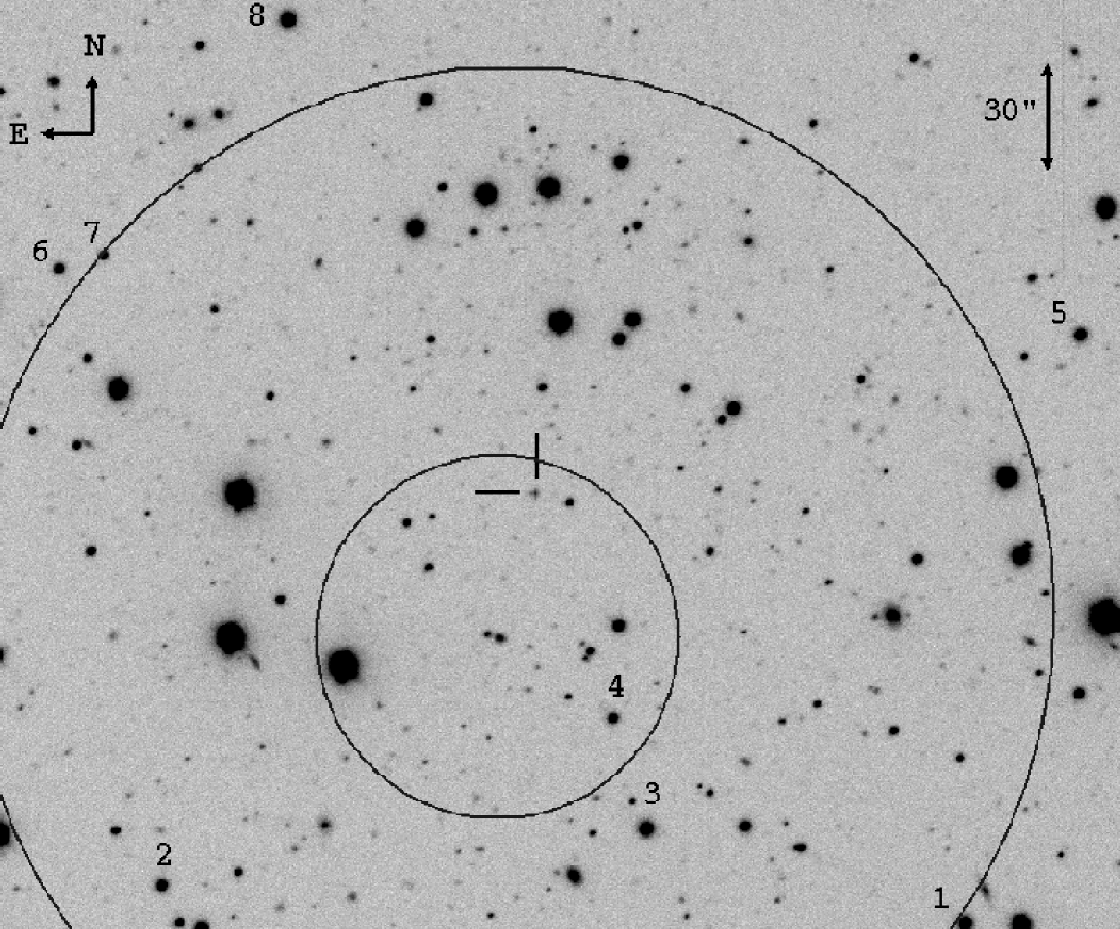
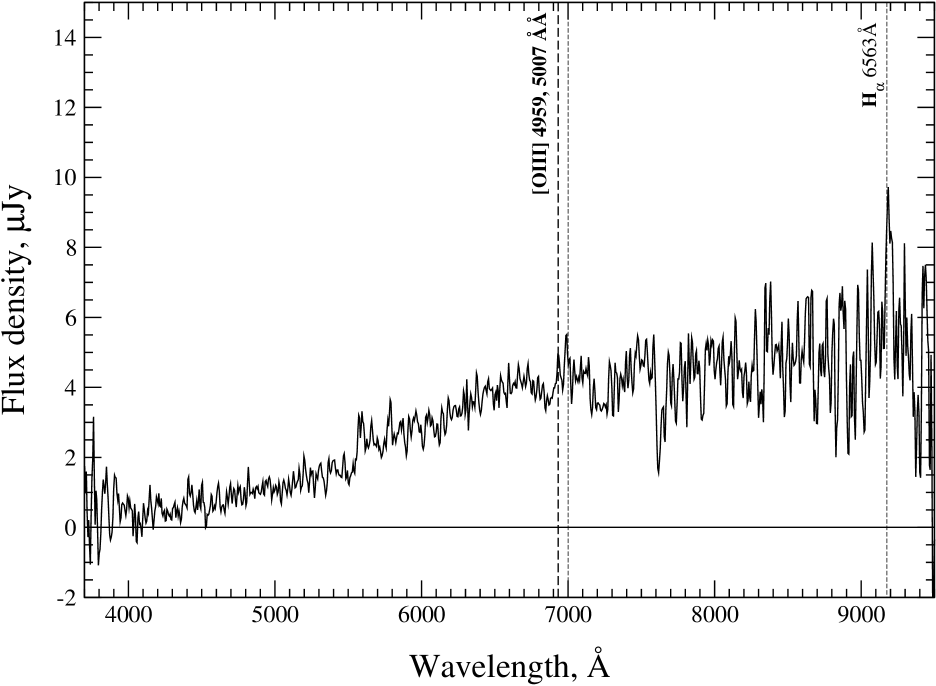
Table 1 displays the observing log. Target of Opportunity observations started at + 9.1 hr (referred to the start time of the first frame reported by Greiner et al. (2000), taken with the 1.23CAHA). We performed aperture photometry using SExtractor111http://terapix.iap.fr/soft/sextractor/ (Bertin & Arnouts (1996)) to study the contents of the BeppoSAX error box. The field was calibrated observing the Landolt field SA113 (Landolt (1992)) in the bands ( and in the Cousins system), at airmasses similar to that of the GRB’s field, in only one night. Table 2 shows the positions and magnitudes of several secondary standards in the GRB’s field (see Fig. 1). Spectroscopic observations were made at the 6.05SAO telescope (12 600 s exposures; see Fig. 2) with SCORPIO and a 300 lines/mm grating. The spectral resolution (FWHM) obtained was 20 Å and the effective wavelength coverage was 3 500–9 500 Å (Afanasiev et al. (2001)). Millimetre observations were carried out at the 30 m IRAM telescope (see Sect. 3.5).
3 Results and analysis
3.1 Content of the BeppoSAX NFI error box
No optical afterglow was detected in the first 1.23CAHA (Greiner et al. (2000); 20.9 mag at 10.2 hr after the GRB) and 2.56NOT ( 22.9 mag at 11.4 hr after the GRB) frames. Strong limits come from the deep NIR observations. The and 3.50CAHA images (Greiner et al. (2000) reported the value of ) have been compared to the and 4.20WHT ones reported by Vreeswijk et al. (2000). We derived the following upper limits222We have assumed for any NIR transient emission within the NFI error box: 19.9, 20.7 and 21.3, 10 hr after the GRB, all of them with a 3 confidence level.
3.2 Afterglow’s SED
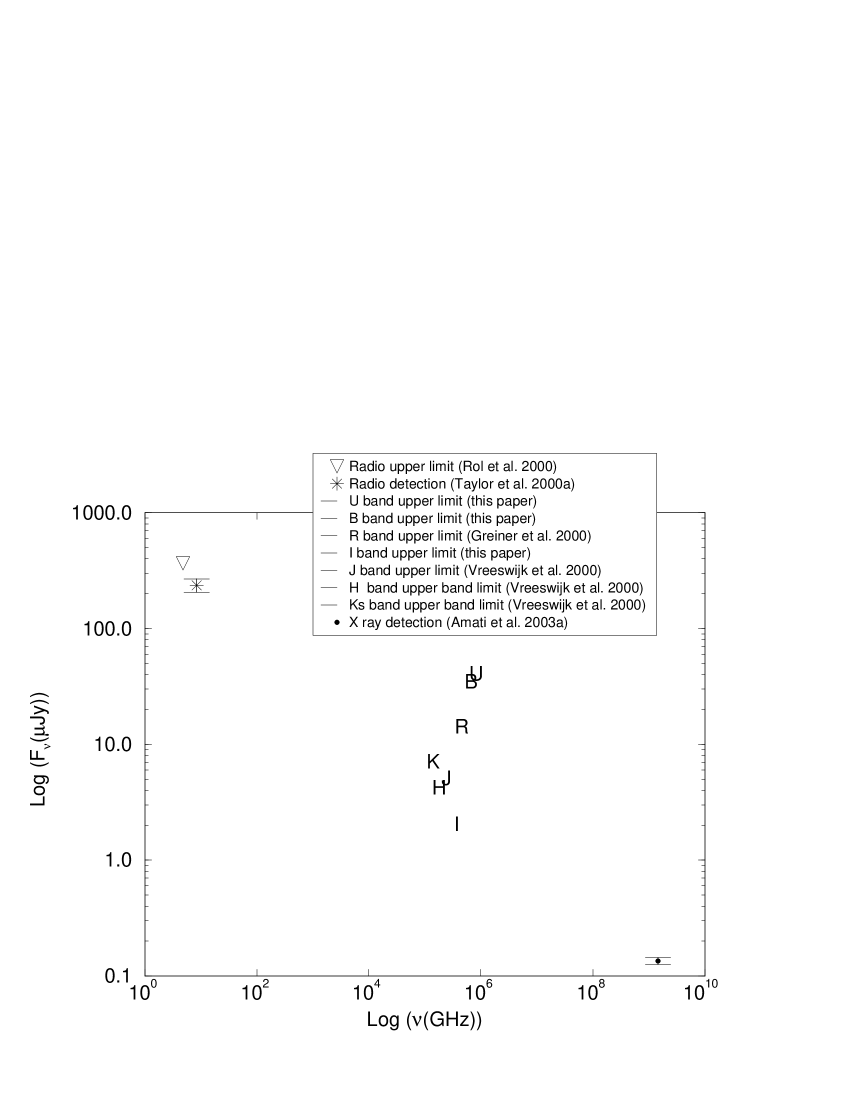
Fig. 3 displays selected detections and upper limits associated with the GRB 001109 (to keep the figure legible we have only plotted the most constraining measurement for each of the optical and NIR bands). All plotted measurements have been shifted to a common epoch [ 0.4 days; epoch of the radio detection (Taylor et al. (2000))] assuming a power law decay index 1.27 (suggested by the ray observations reported in Amati et al. (2003)). As shown, the most constraining upper limit corresponds to the 2.56NOT band image taken on 9.8447–9.8845 UT November 2000.
This band measurement allows us to impose an upper limit on the afterglow’s optical to ray spectral index: 0.33 0.02 ( is the power law index of the specific flux; ). The corresponding optical to ray spectral index upper limits for the full BeppoSax’s NFI dark burst sample can be worked out from the limits on the optical to ray flux ratio333The optical to ray flux ratio () is defined as the band flux (or upper limit), in units of Jy, divided by the 1.6–10 keV ray flux, in units of 10-13 cgs (de Pasquale et al. (2003)). ( from Table 1 in de Pasquale et al. (2003)):
The GRB 001109 has the strongest limit in this sample where the upper limits range from 0.33 to 0.55.
3.3 VLA J1830+5518
3.3.1 Astrometry
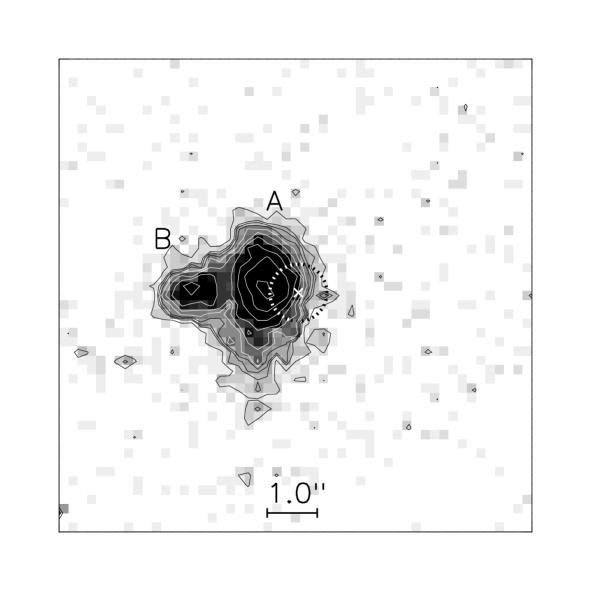
We performed astrometry on two different data sets. For the first data set, 10 USNO A2.0 stars, not saturated on the 6.05SAO images, were used. The astrometrical uncertainty was found to be 0.5″, including both, statistical and systematic errors (Sokolov et al. (2001)). For the second data set, an independent astrometric solution, based on 50 USNO A2.0 stars, was obtained using the coadded band image taken at the 2.56NOT (see the penultimate entry in Table 1). It yielded a similar uncertainty (0.57″). Both astrometric solutions showed, independently, that the position of the radio source is consistent with the brighter component ( 20.65 0.06, the object A hereafter) of a complex system (see Fig. 4). The second brightest component (the object B hereafter) is located 1.25″ to the East of the object A. Strictly speaking the astrometry reveals the registration of the optical image, and has nothing to do with the location of the VLA radio source which was determined absolutely in the International Coordinate Reference Frame. These two objects were independently detected in the optical and in the NIR, so we conclude that they are real objects.
3.3.2 Spectroscopy
Spectral measurements (performed with the slit aligned in the East-West direction) detected Balmer breaks and emission lines for the sources A and B. First we divided the 2D spectra of the objects A and B using Gaussian analysis. Then we aproximated the resulting 2D spectrum across the dispersion direction by summing the two gaussians with the FWHM parametres (wavelength dependent). Finally we checked our extraction model by subtracting the model from the real data. Object A’s redshift is 0.398 0.002 based on the identification of the H (6 563 Å) and O[III] (4 959 Å, 5 007 Å) emission lines (see Fig. 2 and Afanasiev et al. (2001)). Object B’s redshift is 0.3399 0.0005 based on the identification of the H (6 563 Å) and H (4 861 Å) emission lines (Afanasiev et al. (2001)). The redshift difference between sources A and B corresponds to a large relative expansion velocity of 13 000 km s-1. Given that velocity dispersions in galaxy clusters are, at most, 5 000 km s-1 (Fadda et al. (1996); Girardi et al. (1993)), the alignment of both sources is likely the result of a chance projection. An HST high resolution deep image that might find signs of interaction would help to clarify this issue.
If the object A were the host of the GRB 001109, then the burst redshift would be 0.398 0.002. To further constrain this suggestion we calculate the probability to find a radio source with the brightness of VLA J1830+5518 in an error box with a radius of 50″.
Following Fomalont et al. (2002) the density of radio sources detected at 8.4 GHz above a flux density in microjanskys is given by:
So we conclude that the chance probability of having a source brighter than inside the NFI error box is % and thus, consider that the probability is not low enough to establish a physical relationship between the location of this radio source inside the GRB’s error box and the occurrence of the ray event.
3.4 Object A’s SED
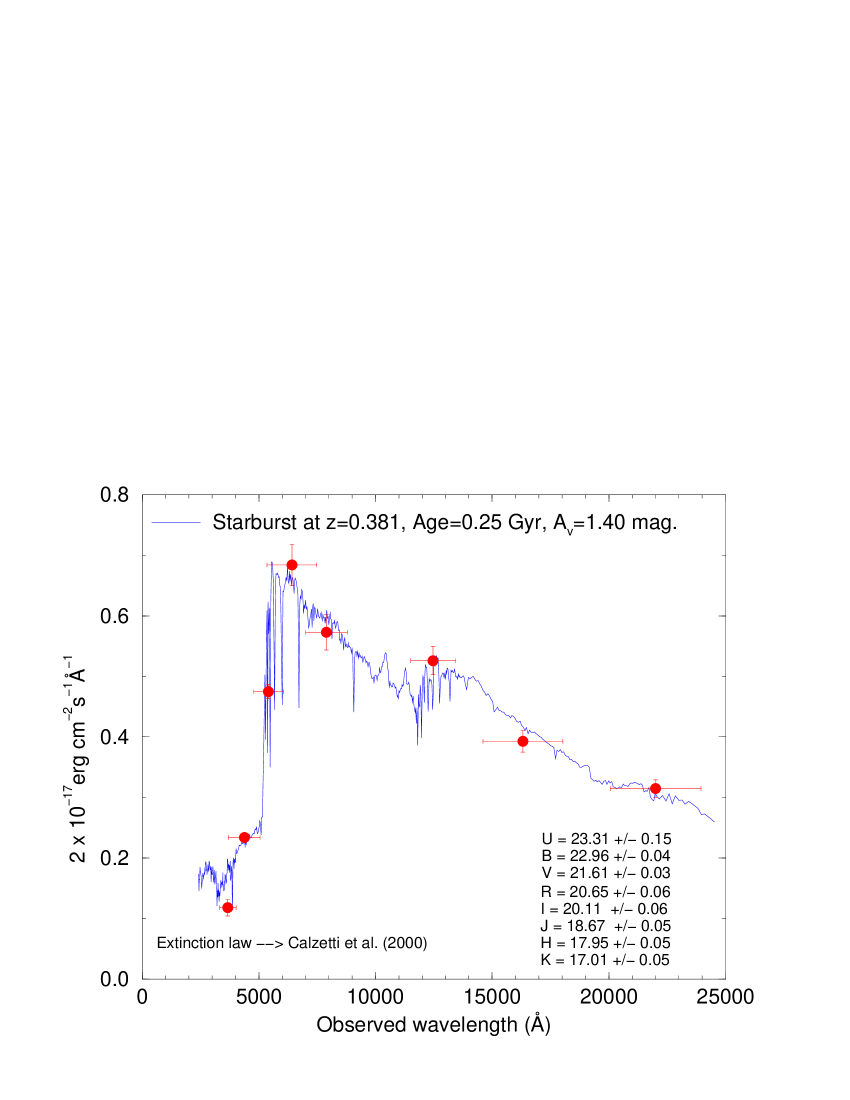
We have determined the flux distribution of the galaxy coincident (not necessarily related) with the VLA J1830+5518 by means of our broad band photometric measurements together with the broad band measurements reported by Vreeswijk et al. (2000). The photometry was based on SExtractor (Bertin & Arnouts (1996)), which allows to deblend entangled sources (this is specially relevant for cases like that of the objects A and B). The fluxes at the passband wavelengths have been dereddened of Galactic extinction using a value of E () 0.04 (DIRBE/IRAS dust maps: Schlegel et al. (1998)).
The passband fluxes (measured in units of 2 10-17 erg cm-2 s-1 Å-1; see Fig. 5) correspond to the following values: 0.118 0.014, 0.234 0.007, 0.475 0.012, 0.684 0.034, 0.573 0.030, 0.526 0.023, 0.393 0.018 and 0.315 0.014, respectively. We have modelled the SED using stellar population synthesis techniques (Bolzonella et al. (2000)) leaving the extinction and the redshift as free parametres. For the extinction law we have used the one given by Calzetti et al. (2000), which is typical for starburst galaxies. The best fit is obtained with a dusty galaxy SED at 0.381, with AV 1.4 mag and an episode of star formation 0.25 Gyr ago (see Fig. 5). This episode of star formation dominates the optical continuum.
Although the radio emission from the object A is not related to the afterglow of the GRB, the object A could still be the host galaxy of the burst. To further constrain this suggestion we have calculated the number of galaxies, with magnitude 22.96 (reddened), to be found inside a circular area with a 50″ radius. Using the Millennium Galaxy Catalogue (Liske et al. (2003)) we estimate a count of 3 galaxies (the passband flux has been dereddened of Galactic extinction using a value of E () 0.04; DIRBE/IRAS dust maps: Schlegel et al. (1998)).
The estimated extinction (AV 1.4) might explain the lack of optical emission and agree with the presence of the H (6 563 Å) and O[III] (4 959 Å, 5 007 Å) emission lines (see Fig. 2 and Afanasiev et al. (2001)) and the non negligible intrinsic NH 2.83 1022 cm-2 (de Pasquale et al. (2003)). This would also be consistent with the fact that the majority of the long duration GRB afterglows located so far have been linked to actively star forming galaxies.
3.5 Results of the millimetre observations
We observed the VLA J1830+5518 with the 117 channel Max Planck Millimetre Bolometre array (MAMBO, Kreysa et al. (1998)) at the IRAM’s 30 m radiotelescope on Pico Veleta, Spain, between 4 Mar 2003 and 12 Mar 2003. MAMBO has an effective centre frequency of 250 GHz (1.2 mm) and a beam size of 10.6″. The observations were done in standard on/off mode with 2 Hz chopping of the secondary mirror with a throw of 32″. The flux was calibrated by performing observations on Mars and Uranus, which yielded a conversion factor of 30 000 counts/Jy with an estimated error of 15%. We did not detect any emission from the VLA J1830+5518 down to a rms noise level of 0.5 mJy.
Further, we have estimated how “unusual” is a non detection with MAMBO in this case. This estimation is based in a correlation between the far IR and the radio. Carilli & Yun (1999) give the correlation of the far IR/radio bands as a function of the redshift. Adapting this correlation to our frequencies we expect, for 0.398, the fluxes at 8.4 GHz and 250 GHz to be aproximately equal. We have that, for 8.4 GHz, flux 0.2 mJy, and that, for 250 GHz, flux 1.5 mJy (3), so our results agree with the expected ones. With a higher redshift the flux at 250 GHz is expected to rise as a function of the flux in radio. Our upper limit at 250 GHz and the correlation from Carilli & Yun (1999) give us an estimate of 1 as the maximum redshift allowed for the VLA source (taking the flux at 250 GHz to be less than 1.5 mJy at 3). This consistency with the far IR/radio correlation implies that the radio emission probably originates from star formation and not from an AGN. Such conclusion can be accomodated by our band SED of the object A (see Table 3 and Fig. 5). Additionally, the 1 upper limit for the VLA J1830+5518 is consistent with the object A’s redshift.
Barnard et al. (2003) observed the VLA J1830+5518 with the 350 GHz photometry pixel on the Submillimetre Common User Bolometre Array (SCUBA, Holland et al. (1999)), at the James Clerk Maxwell Telescope on Mauna Kea, United States. Their measurement yielded a flux of 1.89 1.4 mJy, consistent with our upper limit at 250 GHz since the flux at 350 GHz is larger by a factor of 3–4 (considering a rms noise level of 0.5 mJy).
| Band | Magnitude |
|---|---|
| 23.31 0.15 | |
| 22.96 0.04 | |
| 21.61 0.03 | |
| 20.65 0.06 | |
| 20.11 0.06 | |
| 18.67 0.05 | |
| 17.95 0.05 | |
| 17.01 0.05 |
4 Discussion and conclusions
Our optical/NIR/millimetre observations are consistent with a connection between the VLA J1830+5518 and the object A. On the other hand, a connection between the object A and the GRB 001109 can not be established.
If we define a dark GRB as one with no counterpart brighter than 23 at 24 hr from the onset, then the GRB 001109 is clearly a dark GRB, given the 22.9 limit imposed by the 2.56NOT 0.47 days after the ray event. We have used our 2.56NOT 22.9 upper limit (9.8447–9.8845/11/2000 UT) to further constrain the luminosity of the GRB 001109 within the context of the BeppoSAX’s NFI dark burst sample (see upper limits for dark bursts in Table 1 of de Pasquale et al. (2003)). To do so we have (following the methodology described in de Pasquale et al. (2003)) calculated the band upper limit 11 hr after the GRB, from the 2.56NOT band constraint. First, we calculated the band flux associated with the band limit using the spectral index 0.33 0.02 (see Sect. 3.2). Then, the band flux was rescaled from 11.3624 hr (9.8646 UT November 2000; mean 2.56NOT observing time) to 11 hr (assuming a power law decay index 1.15, adopted by de Pasquale et al. (2003)). Further, the band flux upper limit was corrected for Galactic extinction using a E () 0.04 value (Schlegel et al. (1998)). As a result we derived an unextincted band flux upper limit of 1.80 Jy 11 hr after the ray event. This new band flux upper limit is approximately 7 times deeper than the one reported previously (11.81 Jy in de Pasquale et al. (2003)). Moreover, our band image lowers the from 0.59 to 0.09, making the GRB 001109, by far, the darkest BeppoSAX NFI GRB. Consequently, the 2.56NOT band measurement has impossed one of the most constraining upper limits on GRB afterglows to date.
The GRB 001109 belongs to the subsample of darkest BeppoSAX NFI bursts ( of the total BeppoSAX NFI dark GRB sample) which show values incompatible (at a 2.6 level) with GRBs with detected optical transients (de Pasquale et al. (2003)). For those objects the spectral index 0.62, so the GRB 001109 is clearly in this group, which is composed by the GRBs 981226, 990704, 990806 and 000210.
It is important to highlight that the GRB 001109 exhibited the brightest ray afteglow among the dark BeppoSAX NFI bursts (de Pasquale et al. (2003)). On the other hand it showed the lowest NH reported for the dark BeppoSAX NFI GRBs (de Pasquale et al. (2003)). In fact, the GRB 001109 NH value is consistent with the ones measured for GRBs with detected optical transients. Thus, the bright ray afterglow of the GRB 001109, its low NH value (in comparison to the rest of the dark BeppoSAX NFI GRB sample) and the constraining optical limits imposed in the present work, might indicate that the GRB 001109 showed a spectrum intrinsically different from GRBs with detected optical transients.
Acknowledgments
For their assistance during the observations we are grateful to, L. Montoya and A. Aguirre at the CAHA, A.A. Kass at the NOT and, I. Skillen, C. Benn, T. Augusteijn and C. Zurita at the WHT. Some images were taken under the auspices of the Isaac Newton Group’s Service Observation Programme. Some of the data presented here have been taken using ALFOSC, which is owned by the Instituto de Astrofísica de Andalucía (IAA-CSIC) an operated at the Nordic Optical Telescope under agreement between the IAA-CSIC and the NBIfAFG of the Astronomical Observatory of Copenhagen. We thank E. Pérez Jiménez and M.A. Cerviño Saavedra for fruitful discussions. JMCC and JG acknowledge a FPI doctoral fellowship from Spain’s Ministerio de Ciencia y Tecnología and a Marie Curie Research Grant from the European Commission respectively. JMCC is grateful for the hospitality extended by the Danish Space Research Institute (DSRI), the Instituto de Astrofísica de Andalucía (IAA-CSIC) and the Astronomical Observatory of the University of Copenhagen, where parts of this work were carried out. This research has been partially supported by Spain’s Ministerio de Ciencia y Tecnología under programme AYA2 002-082 (which includes FEDER funds). The work of the SAO team was supported by the Russian Astronomy Foundation and RFBR grant N01-02-17 106a. KAP acknowledges partial support by RFBR grants 00-02-17 164 and 99-02-16 205. UL acknowleges partial support from Spain’s Ministerio de Ciencia y Tecnología, under grant AYA 2 002-03 338, and Junta de Andalucía. JPUF gratefully acknowledges support from the Carlsberg Foundation. This work was supported by the Danish Natural Science Research Council. This research has made use of NASA’s Astrophysics Data System. The authors wish to thank Dr. G.B.Taylor for helpful comments during the refereeing process.
References
- Afanasiev et al. (2001) Afanasiev, V., Fatkhullin, T., Dodonov, S., et al. 2001, GCN, 1 090
- Amati et al. (2000) Amati, L., Frontera, F., Pian, E., et al. 2000, IAU Circ., 7 519
- Amati et al. (2003) Amati, L., Frontera, F., Castro Cerón, J.M., et al. 2003, The Prompt and Afterglow Emission of GRB 001109 Measured by BeppoSAX, in Gamma-Ray Bursts and Afterglow Astronomy 2001: A Workshop Celebrating the First Year of the HETE Mission, ed. G.R. Ricker, & R.K. Vanderspek (Melville: AIP Conference Proceedings), 662, 387
- Amati et al. (2003, 2004) Amati, L., Frontera, F., Castro Cerón, J.M., et al. 2004, A&A, in preparation
- Barnard et al. (2003) Barnard, V.E., Blain, A.W., Tanvir, N.R., et al. 2003, MNRAS, 338, 1
- Berger & Frail (2001) Berger, E., & Frail, D.A. 2001, GCN, 1 168
- Bertin & Arnouts (1996) Bertin, E., & Arnouts, S. 1996, A&AS, 117, 393
- Boella et al. (1997) Boella, G., Chiappetti, L., Conti, G., et al. 1997, A&AS, 122, 327
- Bolzonella et al. (2000) Bolzonella, M., Miralles, J.M., & Pelló, R. 2000, A&A, 363, 476
- Calzetti et al. (2000) Calzetti, D., Armus, L., Bohlin, R.C., et al. 2000, ApJ, 533, 682
- Carilli & Yun (1999) Carilli, C.L., & Yun, M.S. 1999, ApJ, 513, L13
- de Pasquale et al. (2003) de Pasquale, M., Piro, L., Perna, R., et al. 2003, ApJ, 592, 1 018
- Fadda et al. (1996) Fadda, D., Girardi, M., Giuricin, G., Mardirossian, F., & Mezzetti, M. 1996, ApJ, 473, 670
- Fomalont et al. (2002) Fomalont, E.B., Kellermann, K.J., Partridge, R.B., Windhorst, R.A., & Richards, E.A. 2002, AJ, 123, 2 402
- Fynbo et al. (2001) Fynbo, J.U., Jensen, B.L., Gorosabel, J., et al. 2001, A&A, 369, 373
- (16) Gandolfi, G. & Piro, L. 2000a, GCN, 878
- (17) Gandolfi, G. & Piro, P. 2000b, GCN, 879
- Girardi et al. (1993) Girardi, M., Biviano, A., Giuricin, G., et al. 1993, ApJ, 404, 38
- Greiner et al. (2000) Greiner, J., Stecklum, B., Klose, S., et al. 2000, GCN, 887
- Greiner (2003) Greiner, J. 2003, http://www.mpe.mpg.de/jcg/grb.html
- Groot et al. (1998) Groot, P.J., Galama, T.J., van Paradijs, J., et al. 1998, ApJ, 493, L27
- Holland et al. (1999) Holland, W.S., Robson, E.I., Gear, W.K., et al. 1999, MNRAS, 303, 659
- Kreysa et al. (1998) Kreysa, E., Gemuend, H.P., Gromke, J., et al. 1998, Bolometre array development at the Max Planck Institut für Radioastronomie, in Advanced Technology MMW, Radio, and Terahertz Telescopes, ed. T.G. Phillips (Bellingham: Proceedings of the SPIE), 3 357, 319
- Lazzati et al. (2002) Lazzati, D., Covino, S., & Ghisellini, G. 2002, A&A, 330, 583
- Landolt (1992) Landolt, A.U. 1992, AJ, 104, 340
- Liske et al. (2003) Liske, J., Lemon, D.J., Driver, S.P., Cross, N.J.G., & Couch, W.J. 2003, MNRAS, 344, 307
- Piro et al. (2002) Piro, L., Frail, D.A., Gorosabel, J., et al. 2002, ApJ, 577, 680
- Ramírez-Ruíz et al. (2002) Ramírez-Ruíz, E., Trentham, N., & Blain, A.W. 2002, MNRAS, 329, 465
- Rol et al. (2000) Rol, E., Vreeswijk, P.M., Strom, R., et al. 2000, GCN, 889
- Schlegel et al. (1998) Schlegel, D.J., Finkbeiner, D.P., & Davis, M. 1998, ApJ, 500, 525
- Sokolov et al. (2001) Sokolov, V., Fatkhullin, T., & Komarova, V. 2001, GCN, 1 092
- Taylor et al. (1998) Taylor, G.B., Frail, D.A., & Kulkarni, S.R. 1998, ApJ, 502, L115
- Taylor et al. (2000) Taylor, G.B., Frail, D.A., & Bloom, J.S. 2000, GCN, 880
- Vreeswijk et al. (2000) Vreeswijk, P.M., Rol E., Packham, C., et al. 2000, GCN, 886