An ISOCAM survey through gravitationally lensing galaxy clusters††thanks: Based on observatios with ISO, an ESA project with instruments funded by ESA Member States (especially the PI countries: France, Germany, the Netherlands and the United Kingdom) with the participation of ISAS and NASA
We have observed the cluster Abell 2218 () with ISOCAM on board the Infrared Space Observatory using two filters, LW2 and LW3, with reference wavelengths of 6.7 and 14.3 m, respectively. We detected 76 sources down to 54 and 121 Jy (50% completeness levels) at 6.7 and 14.3 m, respectively. All these sources have visible optical counterparts. We have gathered optical and near-infrared magnitudes for 60 of the 67 non-stellar optical counterparts to the ISOCAM sources, as well as redshifts for 43 of them. We have obtained acceptable and well constrained fits to the observed spectral energy distributions (SEDs) of 41 of these sources, using the “GRASIL” models of Silva et al. (1998), and have determined their total infrared luminosities (’s) and star formation rates (SFRs).
The SEDs of 20 (out of 27) ISOCAM cluster members are best fit by models with negligible ongoing star formation, and no major episode of star formation in the last Gyr. Their SEDs resemble those of 5–10 Gyr old early-type galaxies. A slightly higher, but still very mild, star-formation activity is found among the remaining cluster sources, which are mostly spirals. The median IR luminosity of the 27 ISOCAM cluster sources is The ISOCAM-selected cluster galaxies have indistinguishable velocity and spatial distributions from those of the other cluster galaxies, and do not contribute significantly to the Butcher-Oemler effect. If A2218 is undergoing a merger, as suggested by some optical and X-ray analyses, then this merger does not seem to affect the mid-infrared properties of its galaxies.
The SEDs of most ISOCAM-selected field sources are best fit by models with moderate ongoing star formation, with a significant fraction of their stellar mass formed in the last Gyr. Their SEDs resemble those of massive star-forming spirals or starburst galaxies, observed close to the maximum of their star formation activity, but not necessarily during the short-lived starburst event. The median redshift of these field galaxies is . Their ’s span almost two orders of magnitudes, from to , with a median of (eight of the 14 field sources are LIRGs). The SFRs of these 14 ISOCAM-selected field sources range from 2 to 125 , with a median value of 22 .
We compare our findings with those obtained in other ISOCAM cluster and field surveys.
Key Words.:
Galaxies: clusters: general – Galaxies: clusters: individual (Abell 2218) – Infrared: galaxies1 Introduction
Clusters of galaxies are not a very common galaxy environment, but they are crucial for our understanding of galaxy formation and evolution. In a hierarchical cosmological scenario, the first galaxies to form are those located in high density peaks, which then evolve to become galaxy clusters (e.g., Coles et al. cole99 (1999)). Hence, on average, cluster galaxies are believed to be older than field galaxies (e.g., Kauffmann & Charlot kauf98 (1998)). When a field galaxy is accreted by a cluster, it is likely to speed up its evolution rate, as a consequence of the physical processes which are switched on in the new, rather extreme, environmental conditions, such as ram-pressure, tidal stripping, ‘harassment’, and galaxy-galaxy collisions (see, e.g. Abraham et al. abra96 (1996); Acreman et al. acre03 (2003); Gnedin gned03 (2003)). While the long-term effect of these processes is to transform a star-forming galaxy into a quiescent one (or to disrupt it entirely, in the case of dwarfs), it is yet unclear how this transformation occurs, and, in particular, if the affected galaxy undergoes a starburst phase during the transformation process (see, e.g., Poggianti pogg03 (2003); Okamoto & Nagashima okam03 (2003)).
A direct observational evidence of the evolution of the properties of cluster galaxies with redshift , is the Butcher-Oemler (BO, hereafter) effect , i.e. the excess of blue galaxies in distant clusters relative to nearby ones (see, e.g., Butcher & Oemler butc84 (1984); Margoniner et al. marg01 (2001); Pimbblet pimb03 (2003)). The effect is partly, yet not entirely, due to field contamination (see, however, Andreon et al. andr04 (2004) who argue that the BO-effect could be due to observational biases). The BO-effect is based on photometric data. The spectroscopic analogue of the BO-effect is the increase of the fraction of ‘k+a’ galaxies (originally called ‘E+A’ by Dressler & Gunn dres83 (1983)) with . The spectra of k+a galaxies are characterized by strong Balmer lines in absorption and the absence of (strong) emission lines (see e.g. Dressler et al. dres99 (1999); Ellingson et al. elli01 (2001)). These spectroscopic features are usually interpreted as the signatures of a post-starburst phase (see, e.g. Poggianti pogg03 (2003)). Another direct evidence of the evolution of cluster galaxies is the change in the morphological mix of clusters with (Dressler et al. dres97 (1997); Fasano et al. fasa00 (2000)); clusters at have a significantly lower fraction of S0s (or early-type galaxies, see Fabricant et al. fabr00 (2000)) than nearby clusters. This suggests that a transformation of spiral galaxies into S0s took place over the last Gyr.
It is yet unclear how the BO-effect is related to the change in the morphological fractions of cluster galaxies. The blue BO galaxies seem to be mostly disk galaxies with disturbed morphologies (Lavery & Henry lave94 (1994)). They could be spirals seen before they transform into S0s. If the transformation occurs after the gas content of these galaxies is used in one or several starbursts, an excess population of post-starburst galaxies is naturally expected at an intermediate phase of the transformation process. Since starbursts usually occur in very dusty environments, it is important to explore these processes at infrared (IR) wavelengths, where the stellar radiation is re-emitted, in the presence of dust (see, e.g. Poggianti pogg03 (2003)). In particular, it was shown by Poggianti et al. (pogg99 (1999)) that a particular spectral class of cluster galaxies, the ‘e(a)’ galaxies (characterized by strong Balmer lines in absorption and emission lines of moderate intensity), are most easily interpreted as dust-hidden starbursts. If the e(a) galaxies are the progenitors of the more common k+a spectral-type galaxies, then it is likely that also k+a galaxies are dust-rich.
Up to now, the available information on the IR properties of cluster galaxies is rather limited. Mid-IR (MIR, hereafter) fluxes have been published for members of the nearby clusters Virgo, Coma, and A1367 (Boselli et al. bose97 (1997), bose98 (1998); Quillen et al. quil99 (1999); Contursi et al. cont01 (2001)), as well as for the medium-distant clusters A370 (Soucail et al. souc99 (1999); Metcalfe et al. metc03 (2003), hereafter Paper I), A1689 (Fadda et al. fadd00 (2000); Duc et al. duc02 (2002)), A1732 (Pierre et al. pier96 (1996)), A2218 (Barvainis et al. barv99 (1999); Paper I), A2219 (Barvainis et al. barv99 (1999)), A2390 (Lémonon et al. lemo98 (1998); Altieri et al. alti99 (1999); Paper I), and Cl0024+1654 (Coia et al. 2004a , C04 hereafter). These analyses have shown that, on average, optically-selected normal early-type galaxies have their MIR emission dominated by the Rayleigh-Jeans tail of the cold stellar component, while late-type galaxies have their MIR emission dominated by the thermal emission from dust (Boselli et al. bose98 (1998)). In the Coma cluster, the k+a galaxies were only found to have enhanced 12 m emission when also optical emission-lines were present (Quillen et al. quil99 (1999)). Since early-type galaxies are the dominant cluster population, one does not expect to find a large number of strong-IR emitters among cluster galaxies at wavelengths where the stellar photospheric emission becomes negligible. Nevertheless, in C04 we report the detection of a large number of very bright IR-galaxies in the distant cluster Cl0024+1654, an indication that the IR properties of cluster members can vary with redshift, and among different clusters.
Outside clusters, there is now ample evidence for a significant evolution of the population of MIR-detected field galaxies (Altieri et al. alti99 (1999); Aussel et al. auss99 (1999); Elbaz et al. elba99 (1999), elba02 (2002), elba03 (2003); Paper I; Sato et al. sato03 (2003), Serjeant et al. serj00 (2000)). These MIR field galaxies have a redshift distribution peaked around . Their MIR-emission is mostly powered by starbursts (rather than AGNs), with typical star formation rates (SFRs) of . The integrated source counts of the MIR galaxy population exceed by an order of magnitude the predictions of no-evolution models based on the local MIR luminosity function (Franceschini et al. fran01 (2001); Paper I). Models that explain the high MIR source counts require either a strong evolution of the whole luminosity function or a strong evolution in both luminosity and density of a sub-population of starburst galaxies (Chary & Elbaz char01 (2001); Franceschini et al. fran01 (2001); Xu xu00 (2000)). The integrated emission from the field MIR sources detected by ISOCAM accounts for most of the cosmic infrared background detected by Puget et al. (puge96 (1996); see Elbaz et al. elba02 (2002)).
In this paper we analyse the properties of IR-selected galaxies in the A2218 cluster, located at a mean redshift We base our analysis on the data obtained in our gravitational-lensing deep-survey programme, which was part of the “Central Programme” of the ISO mission. These data were used in Paper I, in conjunction with ISOCAM data for other clusters, to derive deep source counts at 6.7 and 14.3 m. The counts we derived in Paper I confirm and extend earlier findings of an excess by a factor of ten in the population of 14.3 m emitters with respect to no-evolution models (Altieri et al. alti99 (1999); Aussel et al. auss99 (1999); Elbaz et al. elba99 (1999)), and they agree with the counts of 6.7 m sources reported by Sato et al. (sato03 (2003)) and Aussel et al. (auss99 (1999)). We complement the ISOCAM MIR data with photometric and spectroscopic data at optical and near-IR (NIR) wavelengths, taken from the literature. We fit the optical–MIR spectral energy distributions (SEDs) of the ISOCAM sources with the GRASIL models of Silva et al. (silv98 (1998), S98 hereafter) to constrain the spectral types, total IR luminosities, and SFRs of the cluster and background sources.
In § 2 we describe our data-set. In § 3 we describe the model fits to the observed SEDs of the ISOCAM extragalactic sources, and in § 4 we describe how we determine the IR luminosities and SFRs of these sources. In the two following sections we describe the results of our analysis, separately for cluster sources (§ 5) and field sources (§ 6). We address the issue of the BO-effect in the IR in § 7. In § 8 we discuss our findings, and compare them with previous results from the literature. In § 9 we summarize our results and provide our conclusions. Some aspects of the SED fitting procedure are detailed in Appendix A. We discuss a few individual ISOCAM sources and their SEDs in Appendix B.
In this paper we use km s-1 Mpc-1, and (see, e.g., Melchiorri & Ödman melc03 (2003)). In this cosmology, the cluster luminosity distance is 845 Mpc, 1 arcmin corresponds to 178 kpc, and the age of the Universe at the cluster redshift is 11.3 Gyr.
2 The Data
The Abell 2218 field was observed with the LW2 and LW3 filters of ISOCAM (Cesarksy et al. cesa96 (1996)), with reference wavelengths of 6.7 and 14.3 m, respectively, in the context of a gravitational-lensing deep survey programme, part of the “Central Programme” of the ISO mission. This programme is described in detail in Paper I. The total observing time was 6.2 hours per filter. The observations were done in raster mode with the per-pixel field-of-view, and a raster step size of , covering a total area of 20.5 arcmin2, i.e. Mpc2 at the cluster distance.
For a detailed description of the ISOCAM data reduction and source identification and reliability, we refer the reader to Paper I. The only modification with respect to Paper I concerns an improved photometry for the three extended sources 28, 30, and 45 (we use the ISOCAM source identification numbers of Paper I). As was pointed out in Paper I in the cases of sources 28 and 45, the fluxes of these three sources as listed in that paper are underestimates, because their MIR photometry was derived under the point-source assumption, but these sources are extended. The total flux of these sources is between 1.5 (source 45) and 2 (sources 28 and 30) times higher than quoted in Paper I. Since these three sources are cluster members, their flux corrections have no effect on the field-source counts reported in Paper I.
In total, 76 sources were detected in the A2218 field, with an average level of significance (i.e. the ratio of the source signal to the 1- local noise floor) of 9 and 12 in the LW2 and the LW3 band, respectively. Four of these sources were also detected by Barvainis et al. (barv99 (1999)); their flux density estimates are in agreement with ours, within the errors. Among our 76 MIR sources, 18 were detected in both bands, 30 in the LW2 band only, and 28 in the LW3 band only. Source fluxes at 6.7 and 14.3 m are in the ranges 23–934 Jy, and 90–919 Jy, respectively. Background sources have their fluxes amplified by the cluster gravitational lensing. After correction for lensing amplification (see Paper I), the faintest source detected at 6.7 (14.3) m has an intrinsic flux of 5 (18) Jy.
We looked for optical and near-infrared (NIR) counterparts for the 76 ISOCAM sources, in the catalogues of Le Borgne et al. (lebo92 (1992), hereafter LPS), Smail et al. (smai01 (2001), hereafter S01), and Ziegler et al. (zieg01 (2001), hereafter Z01). The catalogue of LPS contains and magnitudes for 729 objects in the central arcmin2 of A2218. LPS also provide redshifts for 66 objects in the same field. The catalogue of S01 contains photometry in the F450W, F606W, and F814W filters of the Hubble Space Telescope – HST herafter –, and in the filter, for 81 galaxies in the central arcmin2 of A2218. S01 also provide morphologies for most of their sources, and redshifts for 34 of them. Finally, the catalogue of Z01 contains magnitudes and redshifts for 48 early-type cluster members in the central arcmin2, as well as morphologies for 19 galaxies.
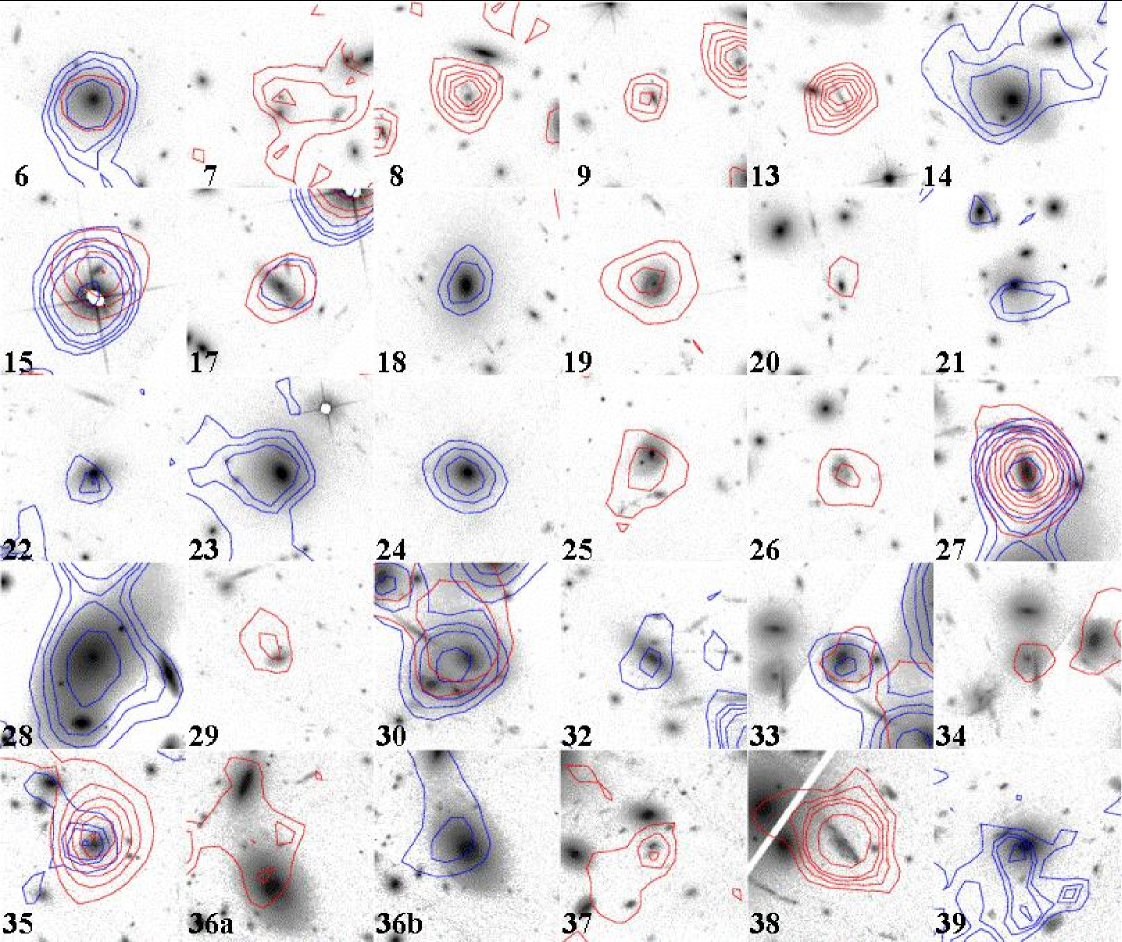
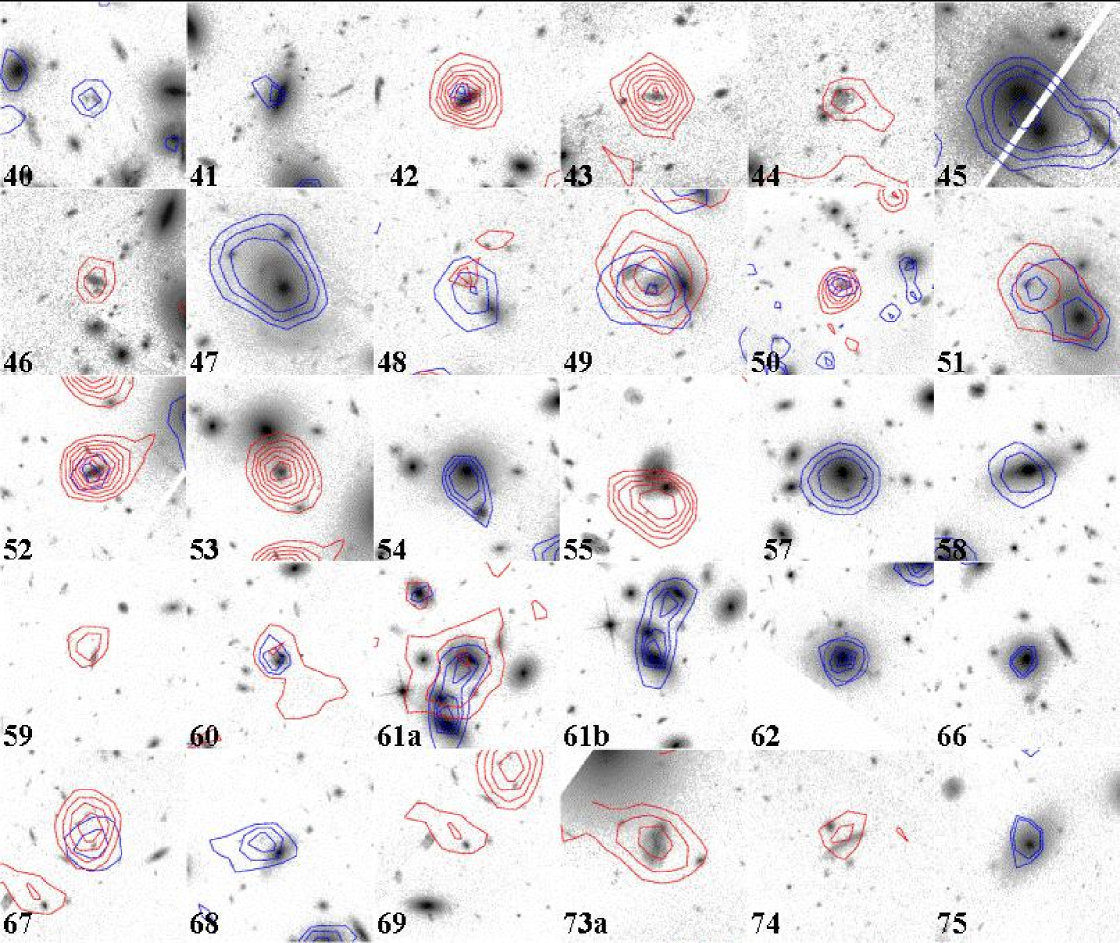
We estimated the morphologies of another 17 optical counterparts from an HST image in the F814W band. The HST mosaic of Abell 2218 was observed with WFPC2 in the F606W filter under the GO programme 7343 (PI: Squires). Most of the observations were conducted in March and May 1999, and the remaining in May 2000. It comprises 24 pointings observed in the CVZ (continue viewing zone) during 2 orbits. At each position 12 exposures of 700 sec were obtained totalizing 8.4 ksec. The data were retrieved from the ST-ECF/ESO archive. The data reduction was done using standard IRAF and STSDAS scripts and was combined into one mosaic using Swarp (www.terapix.fr/swarp). More details on these data can be found in Hudelot et al. (hude04 (2004)). For those ISOCAM sources that lie in the field covered by this HST image, we show in Fig. 1 their MIR isocontours at 6.7 and 14.3 m (in blue and red, respectively) overlaid on the optical image (sources with stellar counterparts – see below – are not shown).
We search for optical/NIR counterparts within a circle of radius around each ISOCAM source, in order to match (roughly) the size of the ISOCAM PSF diameter at 14.3 m (Okumura okum98 (1998)). Following the method of Flores et al. (flor99 (1999)), we determine quantitative likelihoods of all possible counterparts. These likelihood estimates are based on the distance between the ISOCAM source and its possible counterpart, and on the magnitude of the possible counterpart (see Flores et al. flor99 (1999) for details). The mean (median) distance between the ISOCAM sources and their most likely counterparts is (), and all sources, except two, have distances (sources 5 and 60 have distances of from their most likely optical counterparts). Visual inspection of the ISOCAM LW2 and LW3 maps overlaid on optical images (see Fig. 1 and Figs. 6 and 7 in Paper I) confirms the identification of the counterparts obtained by the maximum likelihood procedure. The likelihoods of the assigned optical/NIR counterparts of our ISOCAM sources are very high. Cases where confusion might play a relevant rôle are detailed in Appendix B.
Since the ISOCAM flux densities are total flux densities, we must convert the apparent magnitudes of the optical/NIR counterparts into total magnitudes. S01 provide total magnitudes in the -band, and , , aperture colours, that we use to derive approximate total , , and magnitudes (assuming negligible colour gradients within the galaxies). Similarly, we determine approximate total , , and magnitudes, using the -band total magnitudes and , , aperture colours in Z01. We then convert Z01’s magnitudes into the photometric system of S01, using the mean magnitude difference (in bands of similar central wavelength) of objects in common to the two data-sets. Finally, we transform LPS’ isophotal magnitudes into total, by using the following relations between LPS’ and S01’s magnitudes, determined for objects in common to the two data-sets: , , . Clearly, the magnitudes obtained using these empirical relations have larger errors than the original ones, because of the scatter in the relations ( magnitudes), and these larger errors are taken into account in our analysis.
All the optical and NIR magnitudes are corrected for galactic extinction, and then converted into flux densities using the relations of Fukugita et al. (fuku95 (1995)) and Tokunaga (toku00 (2000)).
Nine of the 76 ISOCAM sources are identified with stars. These are sources no. 3, 4, 11, 12, 15b, 16, 56, 71, and 72. Seven of our ISOCAM sources are outside the surveyed areas of the LPS, S01, or Z01 catalogues. These are sources no. 19, 36a, 43, 48, 50, 55, and 73b. The lack of photometry in optical/NIR bands precludes a thorough analysis of their properties. These 16 sources are not considered in this paper. We are thus left with a sample of 60 extragalactic ISOCAM sources with optical counterparts and available optical and/or NIR magnitudes.
3 The Spectral Energy Distributions
We construct Spectral Energy Distributions (SEDs) for the 60 non-stellar ISOCAM sources with available optical/NIR photometry. When either the 6.7 or the 14.3 m flux density is not available, an upper limit is used instead. This limit is equal to the 50% completeness limit for the region where the ISOCAM source is located (see Table 3 in Paper I), or twice that value for the extended sources 28, 30, and 45. With this definition, MIR upper limits approximately correspond to 4 limits. SED models that violate this limit are rejected in the fitting procedure.
| ISOCAM | Optical | morphology | Best-fit | Nsfr(0.1) | Nsfr(1.1) | Redshift | Membership | Quality |
|---|---|---|---|---|---|---|---|---|
| source id. | counterpart | (reference) | model | (reference) | of the fit | |||
| ISO_A2218_02 | L664 | – | Sa5 | 0.4 | 0.5 | 0.53 (Paper I) | f | P |
| ISO_A2218_05 | L621 | Sa | Sa5 | 0.4 (0.1–0.8) | 0.1 (0.1–3.4) | c | G | |
| ISO_A2218_06 | L630 | E/S0 | Em5 | 0.0 () | 0.0 () | 0.1802 (LPS) | c | G |
| ISO_A2218_08 | L587 | Sc | Mps2 | 1.4 (1.1–3.0) | 1.3 (1.3–1.4) | 0.68 (Paper I) | f | G |
| ISO_A2218_09 | L565 | SBa | Sa2 | 1.1 (0.4–1.8) | 1.2 (0.5–2.4) | 0.68 (Paper I) | f | G |
| ISO_A2218_10 | L557 | – | Sb5 | 1.1 () | 1.2 () | - | U | |
| ISO_A2218_13 | L537 | S | M5 | 3.0 (1.1–3.0) | 1.3 (1.3–1.4) | f | G | |
| ISO_A2218_14 | L535/Z2076 | E | Es2 | 0.0 () | 0.00 () | 0.1827 (LPS) | c | G |
| ISO_A2218_17 | L484 | Sa | Sb10 | 0.6 (0.4–1.1) | 0.6 (0.5–3.4) | c | G | |
| ISO_A2218_18 | L482/S4013 | E/S0 | Em5 | 0.0 | 0.0 | 0.1778 (LPS) | c | G |
| ISO_A2218_20 | L467/S159 | S0 (S01) | Aps2 | 0.5 () | 1.6 (0.1–2.4) | 0.476 (E98) | f | G |
| ISO_A2218_21 | L436/S137/Z1516 | SB0/a (S01) | Em5 | 0.0 () | 0.0 () | 0.1638 (S01) | c | G |
| ISO_A2218_22 | L430/S337/Z2604 | E | Em5 | 0.0 () | 0.0 () | 0.1800 (LPS) | c | G |
| ISO_A2218_23 | Z1976 | E | Em2 | 0.0 () | 0.1 () | 0.1686 (Z01) | c | G |
| ISO_A2218_24 | L419/Z1142 | E | Es2 | 0.0 () | 0.0 () | 0.1641 (LPS) | c | G |
| ISO_A2218_25 | L409 | SB0/a | Em2 | 0.0 () | 0.1 () | 0.1741 (LPS) | c | G |
| ISO_A2218_26 | L411/S103 | Sdm (S01) | Sa5 | 0.4 () | 0.5 () | c | G | |
| ISO_A2218_27 | L395/S333 | Sc (S01) | Sa5 | 0.4 (0.4–0.8) | 0.5 (0.5–3.4) | 0.1032 (LPS) | f | G |
| ISO_A2218_28 | L391/S301 | cD (S01) | Em10 | 0.0 | 0.0 | 0.1720 (LPS) | c | P |
| ISO_A2218_29 | L381 | SB0/a | Sc2 | 1.8 (0.4–1.8) | 1.4 (0.5–2.4) | 0.521 (E98) | f | G |
| ISO_A2218_30 | L373/S280/Z1552 | SB0/a (S01) | Sa10 | 0.1 () | 0.1 () | 0.1776 (LPS) | c | G |
| ISO_A2218_32 | L348/Z2270 | Sa (Z01) | Es10 | 0.0 () | 0.0 () | 0.1676 (Z01) | c | G |
| ISO_A2218_33 | L341/S351/Z1662 | E (S01) | Em10 | 0.0 | 0.0 | 0.1637 (LPS) | c | G |
| ISO_A2218_34 | L323 | S | Sa10 | 0.1 () | 0.1 () | 0.179 (E98) | c | G |
| ISO_A2218_35 | L317/S420 | Scd (S01) | Mps5 | 1.1 | 1.4 | 0.474 (E98) | f | P |
| ISO_A2218_36b | L296/Z1888 | Sab (Z01) | Em2 | 0.0 () | 0.1 () | 0.1760 (LPS) | c | G |
| ISO_A2218_38 | L289 | S/Irr | Mps5 | 1.1 (1.1–3.0) | 1.4 (1.3–1.4) | 1.033 (LPS) | f | G |
| ISO_A2218_39 | Z849 | E | El5 | 0.0 () | 0.0 () | 0.1652 (Z01) | c | G |
| ISO_A2218_40 | L287 | Irr | Sb2 | 1.6 (0.4–3.0) | 1.4 (0.5–2.4) | 0.702 (E98) | f | G |
| ISO_A2218_42 | L275 | Sa | Sb2 | 1.6 (1.1–1.8) | 1.4 (1.2–1.5) | 0.45 (Paper I) | f | G |
| ISO_A2218_44 | L262 | Irr | Sc2 | 1.8 | 1.4 | 0.596 (E98) | f | G |
| ISO_A2218_45 | L244/S307/Z1437 | S0 (S01) | Em10 | 0.0 | 0.0 | 0.1646 (LPS) | c | G |
| ISO_A2218_47 | L235/Z1175 | SB0/a (Z01) | Em10 | 0.0 () | 0.0 () | 0.1765 (LPS) | c | G |
| ISO_A2218_52 | L206/S323 | Sc (S01) | Sb5 | 1.1 (0.4–1.1) | 1.2 (0.5–1.4) | 0.55 (Paper I) | f | G |
| ISO_A2218_53 | L205/S368 | Sc (S01) | Sc5 | 1.6 | 1.5 | 0.693 (E98) | f | P |
| ISO_A2218_54 | L196/S401/Z1466 | E (S01) | Em5 | 0.0 () | 0.0 () | 0.1798 (LPS) | c | G |
| ISO_A2218_57 | L149/S1057 | E (S01) | Em10 | 0.0 () | 0.0 () | 0.1753 (LPS) | c | G |
| ISO_A2218_58 | L148/S428/Z1343 | S0 (S01) | Em10 | 0.0 | 0.0 | 0.1830 (LPS) | c | G |
| ISO_A2218_59 | L145/S646 | Sdm (S01) | Mps5 | 1.1 (0.4–1.1) | 1.4 (0.5–1.4) | 0.628 (E98) | f | G |
| ISO_A2218_60 | L116/S4010 | E (S01) | Sa5 | 0.4 () | 0.5 () | 0.2913 (LPS) | f | G |
| ISO_A2218_61a | L119/S638 | S0 (S01) | Sa10 | 0.1 () | 0.1 () | c | G | |
| ISO_A2218_61b | L113/S633/Z2702 | S0 (S01) | Es10 | 0.0 | 0.0 | 0.1738 (LPS) | c | G |
| ISO_A2218_62 | L118/Z1293 | E (Z01) | Em5 | 0.0 () | 0.0 () | 0.1758 (Z01) | c | G |
| ISO_A2218_66 | L77/S4007 | SB0 (S01) | Es5 | 0.0 () | 0.0 () | 0.1681 (LPS) | c | G |
| ISO_A2218_67 | L75/S4004 | – | Es2 | 0.0 | 0.0 | 1.5 | - | P |
| ISO_A2218_68 | L62/S4009 | Sa (S01) | Sa5 | 0.4 () | 0.5 () | 0.42 (Paper I) | f | G |
| ISO_A2218_70 | L58 | – | Sa10 | 0.1 | 0.1 | 0.1703 (LPS) | c | G |
| ISO_A2218_73a | L38/S4015 | Sc (S01) | M10 | 2.8 () | 1.0 () | - | U |
In order to fit the observed SEDs of our ISOCAM sources we consider a battery of models computed with the GRASIL code of S98. This code computes the spectral evolution of stellar systems by taking into account the effects of dust. In particular, it takes into account several environments with different dust properties and distributions, such as the AGB envelopes, the diffuse interstellar medium, and the molecular clouds. GRASIL models consider different kinds of dust particles, including the very small grains and the polycyclic aromatic hydrocarbons that are mainly responsible for the MIR emission detected by ISOCAM. GRASIL models have been shown to provide excellent fits to the observed SEDs of nearby galaxies, in both quiescent and starburst phases, with infrared data obtained with ISO (S98; Mann et al. mann02 (2002); C04). Full details of the GRASIL model are given in S98.

The available photometric data for our MIR-selected sources do not
allow an accurate modelling of each individual galaxy SED. Rather, we
perform the comparison of the observed SEDs with a limited set of
models meant to be representative of four broad classes of spectral
types. Mann et al. (mann02 (2002)) have considered five
model SEDs, while we have considered 20 model SEDs in C04, i.e. 10
models each seen at two different ages. Here we consider 30 models,
i.e. the same 10 models of C04, each seen at three different
ages. Some of these models were taken directly from the GRASIL web
site111http://web.pd.astro.it/granato/grasil/grasil.html
or: http://adlibitum.oat.ts.astro.it/silva/grasil/grasil.html, some were
kindly provided by L. Silva (private comm.), and some were built by
ourselves by running the GRASIL code (also freely available on the
web).

The models we consider are the following:
-
E:
three models of early-type galaxies, characterized by an initial burst of star formation lasting 0.5, 1.0, or 2.0 Gyr, and by passive evolution thereafter. Depending on the duration of the initial burst, we label these models ‘Es’ (short), ‘Em’ (medium), and ‘El’ (long). These models have been used in Granato et al. (gran01 (2001)) and reproduce the range of SEDs of ellipticals and S0s in the nearby universe.
-
S:
three models of disk galaxies (spirals), characterized by different values of: i) the gas infall timescales, and ii) the efficiency term in the Schmidt-type law (see § 2.1 in S98). The star formation histories (SFHs, herafter) of these models gently increases with time up to a maximum, and then gently decreases. The maximum SFR occurs at , , and Gyr after galaxy formation, for the three models here considered, which we label ‘Sa’, ‘Sb’, and ‘Sc’, respectively, because their SEDs reproduce those of nearby spirals of the Sa, Sb, and Sc types.
-
SB:
two starburst models that provide good fits to the observed SEDs of the moderate starburst galaxy M82, and of the strong starburst galaxy Arp220. We refer to these two starburst models as ‘M’ and ‘A’, respectively. The starburst is characterized by an e-folding time of 0.05 Gyr, and involves and of the total mass of the galaxy, for the M and A model, respectively.
-
PSB:
the two starburst models mentioned above (‘M’ and ‘A’), but observed 1 Gyr after the starburst event; we label these ’post-starburst’ models ‘Mps’ and ‘Aps’.
The SB models we consider here are rather extreme examples of the starburst phenomenon. We considered including NGC6090 as another example of starburst galaxy, of intermediate IR luminosity between Arp220 and M82. However, after suitable normalisation, the SED of M82 is not different enough from that of NGC6090 to justify including an additional model in our analysis, given the relatively large error bars on our (rather faint) MIR fluxes.
The SFHs of the 10 models are shown in Figure 2. Three SEDs were built for each of these ten models, by stopping their star formation histories at ages of 2, 5, and 10 Gyr. The SB and PSB model SEDs are obtained from the same models, stopping their star formation histories at the time of the starburst event, and, respectively, 1 Gyr later.
Since these GRASIL models were produced in order to fit the observed SEDs of nearby galaxies, it is not clear what the physical meaning of, e.g., a 2 Gyr Sa model is. Such a model might, or might not, resemble a real Sa of that age, depending on the way an Sa galaxy forms and evolves. It is therefore more meaningful to parametrize these models in terms of their current and recent SFR’s. More specifically, we define the normalized star formation rates Nsfr(0.1) and Nsfr(1.1) as the SFR of the model, averaged over the last 0.1 and, respectively, 1.1 Gyr, divided by the SFR averaged over the entire galaxy SFH. These two quantities measure the shape of the model SFH, rather than the intensity of the star formation process. Using Nsfr(0.1) and Nsfr(1.1) we can group our 30 models into five classes (see Figure 3, top panel). Values of characterize galaxies that have experienced their main star formation activity more than 1.1 Gyr ago. Among these, those with have some residual star formation activity left. When , we distinguish three cases, depending on the value of Nsfr(0.1). When Nsfr(0.1) is very high, the galaxy is undergoing a starburst. Intermediate values of Nsfr(0.1) characterize galaxies near a maximum of star forming activity in their SFH (see Figure 2). Finally, when Nsfr(0.1) is comparable or even lower than Nsfr(1.1), the galaxy might have recently suffered a starburst, but the starburst phase is now over. These are the models that we call post-starbursts (PSB), although they still retain substantial amounts of star formation activity, as the starburst event has used up only a fraction of the available gas. Note that the range of Nsfr(0.1) and Nsfr(1.1) values that characterizes the PSB galaxies is also shared by other models, namely those of normal spirals observed shortly after the peak of their SFH.
We compare the observed and model SEDs with a standard procedure (see Appendix A for a detailed description of some technical aspects of our SED-fitting procedure). When the redshift of the optical counterpart to the ISOCAM source is known, there are two free parameters in the fit, the model SED and its normalization. When the redshift is unknown, it is taken as an additional free parameter. We only accept the best-fit solution if the range of acceptable values for the source redshift is sufficiently narrow (see Appendix A).
In order to constrain the fit to a galaxy SED and estimate its probability, the number of free parameters plus one must be less than the number of photometric data-points. This is true for 48 of the original 60 sources. For 40 of them, the redshift is known.
Note that, currently, no AGN component is included in the GRASIL models. We do not expect to find many cases of AGN-dominated emission among MIR selected sources. Several studies (e.g., Franceschini et al. fran01 (2001); Rowan-Robinson rowa01 (2001)) have shown that most ISOCAM sources have their MIR emission dominated by dust-reprocessed stellar radiation, especially at the lower flux levels. Elbaz et al. (elba02 (2002)) have found that only % of the ISOCAM sources in the Hubble Deep Field North have their MIR flux dominated by dust re-processed AGN radiation. Among the 48 ISOCAM sources for which we try a SED-model fitting, we can therefore expect in which the MIR emission is dominated by dust-reprocessed radiation from an obscured AGN. This number could be different if the relative number of AGNs among galaxies depends on the environment.
The results of our SED-fitting analysis are summarized in Table 1, along with the optical counterparts and their morphologies when available. In the columns of Table 1 the following information is listed:
-
1.
ISOCAM source identification;
-
2.
identification of the optical/NIR counterpart in the LPS, S01, and Z01 catalogues (L: LPS, S: S01, Z: Z01);
-
3.
morphology of the optical counterpart, and reference (S01, Z01; if no reference is given, the morphology estimate is ours);
-
4.
best-fit model, followed by a number indicating the age of the model in Gyr;
-
5.
Nsfr(0.1), i.e. the SFR of the best-fit model, averaged over the last 0.1 Gyr, divided by the SFR averaged over the entire SFH of the model. The 95 % confidence level (c.l. hereafter) range (in brackets) is also given, when applicable, i.e. when other models provide an acceptable (-probability of the fit ) fit to the observed SED, and when the Nsfr(0.1) values of these models are different from the best-fit one;
-
6.
same as Col. 5, but for Nsfr(1.1) (the SFR averaged over the last 1.1 Gyr, divided by the SFR averaged over the entire SFH), in lieu of Nsfr(0.1);
-
7.
spectroscopic redshift, if available, and reference (LPS, S01, Z01, Paper I, and Ebbels et al. ebbe98 (1998), hereafter E98), or photometric redshift obtained through the SED fitting procedure, with its uncertainty (rms of the redshift values found among all the acceptable fits, see Appendix A), if available;
-
8.
cluster/field membership (labelled c/f, respectively), based on the spectroscopic or photometric redshift estimates of Col. 6;
-
9.
quality of the fit (G: good, -probability of the fit ; P: poor, -probability of the fit ; U: unconstrained, -probability of the fit , but the photometric redshift solution is unconstrained).
In Table 2 we list the 12 ISOCAM sources without sufficient photometric data for a reliable SED-fitting analysis. In Col. 1 we list the ISOCAM source identification, in Col. 2 the identification of the optical/NIR counterpart in the LPS catalogue, in Col. 3 the spectroscopic redshift, if available, and its reference.
| ISOCAM | Optical | Redshift |
|---|---|---|
| source id. | counterpart | (reference) |
| ISO_A2218_07 | L599 | – |
| ISO_A2218_15a | L515 | – |
| ISO_A2218_37 | L292 | – |
| ISO_A2218_41 | L283 | – |
| ISO_A2218_46 | L242 | 0.654 (E98) |
| ISO_A2218_49 | L225 | – |
| ISO_A2218_51 | L220 | – |
| ISO_A2218_64 | L111 | – |
| ISO_A2218_65 | L96 | 0.64 (Paper I) |
| ISO_A2218_69 | L60 | – |
| ISO_A2218_74 | L33 | – |
| ISO_A2218_75 | L26 | 0.1688 (LPS) |
In summary (see also Table 3), we obtain acceptable fits for 41 out of the 48 galaxy SEDs, five of which have no spectroscopic- estimate. Of these five, four have photometric-’s consistent with the mean cluster , so we consider them as cluster members. In total, acceptable fits are obtained for 27 cluster members and 14 field galaxies. For two sources the best fit is unconstrained because of a degeneracy problem (different models at very different ’s provide fits of comparable quality). For another five sources, no acceptable fit was found (they are discussed in Appendix B).
| Sample | number |
|---|---|
| Non-stellar sources | 60 |
| Sources with well-sampled SED | 48 |
| Sources without acceptable SED model fit | 5 |
| Sources with unconstrained SED model fit | 2 |
| Sources with acceptable SED model fit | 41 |
| Cluster sources with acceptable SED model fit | 27 |
| Field sources with acceptable SED model fit | 14 |
4 The IR Luminosities and Star Formation Rates
Computing the IR luminosities, ’s, of our MIR sources requires knowledge of both their redshifts and SEDs. We can therefore determine the ’s for 41 ISOCAM sources in the A2218 field.
We adopt two methods to determine : (a) We integrate the best fit model SED over the range 8–1000 m; (b) we use the empirical relations of Elbaz et al. (elba02 (2002), eqs. 13 and 14 in that paper), between and the K-corrected monochromatic MIR luminosities at 6.7 and 14.3 m. The best-fit model SED is used to estimate the K-correction. In both cases, the luminosities of background sources are corrected for the lensing amplification factors (taken from Tables 5 and 8 of Paper I).
The estimates obtained by the two methods are very similar, except for those sources with SEDs that are best fit by E-type models, for which method (b) returns systematically higher luminosities than method (a) – see Fig. 4. This is not surprising, since the relations of Elbaz et al. (elba02 (2002)) are consistent with those of Chary & Elbaz (char01 (2001)), which were derived on a sample of galaxies with significant star formation activity. The SEDs of the galaxies in Chary & Elbaz’s (char01 (2001)) sample are clearly different from those of E-type galaxies, where the MIR emission is dominated by the Rayleigh-Jeans tail of the cold stellar component (see, e.g., Boselli et al. bose98 (1998)), not by thermal emission from dust. Because of this problem, in the following we adopt the -estimates obtained with method (a). We also calculate the NIR-luminosities, , using the same method, i.e. by integrating the best fit model SED over the range 0.9–3.0 m.
We then compute the SFRs from Kennicutt’s (kenn98 (1998)) relation between a galaxy SFR and its ,
| (1) |

| ISOCAM | SFR | ||
|---|---|---|---|
| source id. | |||
| Cluster sources | |||
| ISO_A2218_05 | 7.2 | 17.3 | 2.9 |
| ISO_A2218_06 | 58.2 | 0.7 | 0.1 |
| ISO_A2218_14 | 42.8 | 0.8 | 0.1 |
| ISO_A2218_17 | 1.4 | 4.1 | 0.7 |
| ISO_A2218_18 | 44.1 | 0.6 | 0.1 |
| ISO_A2218_21 | 18.8 | 0.2 | 0.0 |
| ISO_A2218_22 | 27.1 | 0.3 | 0.1 |
| ISO_A2218_23 | 32.3 | 0.7 | 0.1 |
| ISO_A2218_24 | 31.2 | 0.6 | 0.1 |
| ISO_A2218_25 | 9.7 | 0.2 | 0.0 |
| ISO_A2218_26 | 2.5 | 5.9 | 1.0 |
| ISO_A2218_30 | 55.0 | 26.4 | 4.5 |
| ISO_A2218_32 | 15.6 | 0.3 | 0.0 |
| ISO_A2218_33 | 40.2 | 0.5 | 0.1 |
| ISO_A2218_34 | 6.4 | 3.1 | 0.5 |
| ISO_A2218_36b | 27.0 | 0.5 | 0.1 |
| ISO_A2218_39 | 24.8 | 0.4 | 0.1 |
| ISO_A2218_45 | 83.4 | 1.0 | 0.2 |
| ISO_A2218_47 | 53.6 | 0.7 | 0.1 |
| ISO_A2218_54 | 37.3 | 0.5 | 0.1 |
| ISO_A2218_57 | 50.7 | 0.6 | 0.1 |
| ISO_A2218_58 | 42.7 | 0.5 | 0.1 |
| ISO_A2218_61a | 16.5 | 7.9 | 1.3 |
| ISO_A2218_61b | 36.2 | 0.7 | 0.1 |
| ISO_A2218_62 | 33.6 | 0.4 | 0.1 |
| ISO_A2218_66 | 23.9 | 0.4 | 0.1 |
| ISO_A2218_70 | 9.8 | 4.7 | 0.8 |
| Field sources | |||
| ISO_A2218_08 | 23.6 | 353.3 | 60.1 |
| ISO_A2218_09 | 25.5 | 210.3 | 35.7 |
| ISO_A2218_13 | 41.6 | 526.6 | 89.5 |
| ISO_A2218_20 | 6.1 | 42.5 | 7.2 |
| ISO_A2218_27 | 5.6 | 13.4 | 2.3 |
| ISO_A2218_29 | 7.9 | 73.2 | 12.4 |
| ISO_A2218_38 | 103.5 | 736.5 | 125.2 |
| ISO_A2218_40 | 2.4 | 25.9 | 4.4 |
| ISO_A2218_42 | 11.8 | 125.9 | 21.4 |
| ISO_A2218_44 | 4.5 | 41.7 | 7.1 |
| ISO_A2218_52 | 38.9 | 225.6 | 38.3 |
| ISO_A2218_59 | 22.8 | 162.3 | 27.6 |
| ISO_A2218_60 | 9.4 | 22.5 | 3.8 |
| ISO_A2218_68 | 53.0 | 126.4 | 21.5 |
In Table 4 we list in Col. 1 the source identification (sources without spectroscopic redshift are listed in italic), in Cols. 2 and 3, and , respectively, in units of , and finally in Col. 4 the SFR, in units of . Only the 27 cluster sources and the 14 field sources with acceptable model fits to their SEDs are listed.
5 Cluster sources
5.1 Internal properties

In Fig. 5 we show the SEDs of the 27 cluster sources for which an acceptable fit was found (see Table 3), with the best-fitting models overlayed. Most cluster sources are characterized by a SED that decreases from the NIR to the MIR, typical of passively evolving galaxies. Models with provide the best-fit to the SEDs of 20 cluster sources (see Fig. 3, middle panel). Models with slightly higher values of Nsfr(0.1) and Nsfr(1.1) (but still below unity) provide the best-fit to the SEDs of the remaining seven cluster sources (three of which however lack spectroscopic redshift determinations, so their cluster membership is not certain). Models with are still acceptable for four of these seven galaxies (see Table 3), and only three of them have Nsfr(0.1) significantly greater than zero, implying significant, albeit small, ongoing star formation.
In order to make a more efficient use of our data, we combine the 27 SEDs of the ISOCAM cluster sources. We assume the mean cluster redshift for all cluster sources, and we scale the observed SED of each source by the rest-frame -band flux, as estimated from the best fit model. Not all sources are detected in the LW3 ISOCAM band. We estimate the average LW3 flux using both the measured LW3 flux values and the LW3 flux upper limits. The average LW3 flux we derive is therefore an overestimate, and we treat it as an upper limit. The resulting average SED is shown in Fig. 6, with the best fit model, an Em10, superposed. This model (and all acceptable models, at % c.l.) has . This analysis therefore confirms that, on average, ISOCAM cluster sources have negligible ongoing, or even recent, star formation. This result indicates they must have formed the bulk of their stars quite some time before the observing epoch.
Our conclusion is in agreement with what can be inferred from optical and NIR data. In fact, morphologically, most ISOCAM cluster sources are classified as ellipticals or S0’s, which in general are characterized by old stellar populations. A similar conclusion can be reached from the analysis of their optical/NIR colours. In Fig. 7 we plot the vs. colour-colour diagram from the cluster galaxies in S01’s sample. ISOCAM sources lie in the sequence defined by the redder (and more luminous) galaxies, except source 26, a galaxy with an Sdm optical morphology (whose cluster membership, as mentioned before, is not certain). On the basis of this colour-colour diagram, S01 determine ages from 5 to 10 Gyr for the redder and more luminous A2218 cluster members (see Figure 3 in S01).
The consistent age estimates derived from the optical and the IR data suggest that there is little dust, on average, in the A2218 cluster galaxies, and that the MIR emission of ISOCAM cluster sources comes from the Rayleigh-Jeans tail of the photospheric emission from cold stars (see, e.g., Boselli et al. bose98 (1998))
The - and SFR-distribution of cluster sources are shown in the two top panels of Fig. 8. The average is , but the median is only , and in fact most cluster sources have , corresponding to SFR . There are a few sources with moderate ’s and SFRs, but none qualify as a Luminous IR Galaxy (LIRG, , see Genzel & Cesarsky genz00 (2000)). Source 30 has the highest SFR, but even in this case it is only .
If the galaxy is small, even a relatively small SFR can be considered a sign of strong ongoing star formation activity. In order to investigate this, we consider the ratio vs. . The SFR scales linearly with (eq. 1), and is a fair indicator of the total baryonic mass of a galaxy (e.g. Gavazzi et al. gava96 (1996)), so is proportional to the SFR normalised by the baryonic mass of a galaxy. We plot vs. for cluster sources in Fig. 9 (top panel). For most cluster sources , and for all spectroscopically-confirmed cluster members . Only three non-spectroscopically confirmed cluster members (sources 5, 17, and 26) have , and for one of them (source 5) the assigned optical counterpart is not certain (see § 2). Thus, in general, even the normalised SFRs of ISOCAM cluster sources are small, although the SFR per unit baryonic mass seems to be higher for galaxies of lower NIR luminosity.


We conclude that most ISOCAM cluster sources are passively evolving galaxies. Their MIR emission is of stellar photospheric origin. There are nonetheless ISOCAM cluster sources with non-zero, albeit small, SFRs, and the most active of these sources are those with the smallest baryonic masses.
5.2 Spatial and velocity distributions
In order to obtain useful information from the spatial and velocity distributions of ISOCAM cluster members, we compare them with those of optically selected cluster sources. In Fig. 10 we show a smoothed projected number-density map, (obtained with the method of the adaptive kernel, see, e.g., Biviano et al. bivi96 (1996)), of the 266 likely cluster members from the LPS catalogue. The membership has been established by selecting galaxies within magnitude of the colour-magnitude sequence in the vs. diagram (see, e.g., Biviano et al. bivi96 (1996)). Superposed on the density map are the ISOCAM galaxies belonging to the cluster, and with photometric data from LPS. The ISOCAM sources seem to share the same spatial projected distribution of optically-selected sources, except perhaps that they seem to avoid the main density peak. However, the relative fractions of optically-selected and MIR-selected cluster members contained within the highest-density cluster region (i.e. within the second highest isocontour of Fig. 10) are not significantly different (23/266 and 2/27, respectively). And in fact, the whole spatial distributions of the two samples are not significantly different (22 % c.l.) according to the bi-dimensional Kolmogorov-Smirnov test (see, e.g., Fasano & Franceschini fasa87 (1987)).

We now check the relative distributions of optically-selected and MIR-selected cluster members in velocity space. We select 79 cluster members from the full sample of 101 galaxies with measured redshifts in the A2218 field, using the method of den Hartog & Katgert (denh96 (1996)). The velocity distribution of the A2218 cluster members is shown in Fig. 11 (note that velocities are rescaled to the cluster rest-frame using the average cluster velocity). The dashed and solid histograms refer to the 79 cluster members, and, respectively, to the subsample of 25 ISO cluster members with available redshift (see Tables 1 and 2). We run the Kolmogorov-Smirnov test to test the null hypothesis that the two samples have the same parent velocity distribution; the null hypothesis cannot be rejected (17 % c.l.).
The average velocity and velocity dispersion of the 79 optically-selected cluster members (corrected for cosmological effects and velocity measurement errors, see Danese et al. dane80 (1980)), are km s-1 and km s-1, respectively (here and hereafter, the biweigth estimators for the location and scale of a distribution are used, see Beers et al. beer90 (1990)). These values are in agreement with those given by Cannon et al. (cann99 (1999)) and Girardi & Mezzetti (gira01 (2001)), and are not significantly different from the average velocity and velocity dispersion of the 25 ISOCAM cluster members ( km s-1 and km s-1, respectively).
We conclude that the projected phase-space distribution of ISOCAM-selected cluster members is not significantly different from that of the global cluster population.
It is nonetheless interesting to analyse the distribution of cluster galaxies in some more detail, to search for the existence of substructures. We find that the velocity distribution of the 79 central cluster members is marginally different from a Gaussian (98 % c.l.), according to the Anderson-Darling test (see, e.g., D’Agostino dago86 (1980)), even if a battery of other tests (skewness, kurtosis, tail-index, see Bird & Beers bird93 (1993)) fail to find a significant difference. We also note that the velocity of the cD galaxy is significantly offset from the cluster mean (as indicated by the test of Gebhardt & Beers gebh91 (1991); see also Fig. 11). The non-Gaussian velocity distribution of the cluster members, and the fact that the cluster cD is not at rest at the bottom of the cluster potential, suggest that the cluster is not fully dynamically relaxed (see, e.g., Girardi & Biviano gira03 (2003)).
We then look for the presence of substructures in the 3d-space of positions and velocities. We do not detect significant substructure with the classical test of Dressler & Shectman (dres88 (1988)). However, a detailed modelling of the gravitational-lensing properties of the cluster has suggested the presence of two main mass concentrations, one centered on the cD and the other on the second brightest member, LPS244 (Kneib et al. knei95 (1995)). The model for the mass distribution of Kneib et al. (knei95 (1995)) is remarkably similar to the projected galaxy distribution shown in Fig. 10 (compare with Fig.5 in Kneib et al. knei95 (1995)).


Since there is evidence for a bimodal cluster structure, one could ask whether the ISOCAM cluster members belong to one structure rather than to the cluster as a whole. However, neither from the projected spatial distribution (see Fig. 10), nor from their velocity distribution (see Fig. 11), is there any evidence for significant subclustering of the ISOCAM cluster population.
6 Field sources
In Fig. 12 we show the SEDs of the 14 field sources for which an acceptable fit was found (see Table 3), with the best-fitting models overlayed. The SEDs of field sources are quite different from those of cluster sources, and are charachterized by an increasing flux density with wavelength. Such a SED is characteristic of actively star-forming galaxies, where part, or even most, of the stellar radiation is reprocessed by dust and re-emitted in the IR. In fact, models that provide the best-fits to the field-source SEDs have median values of and , indicating substantial ongoing and recent star formation, at a rate higher, on average, than the mean SFR over the galaxy SFH. Taking into consideration all the acceptable models, we note that Nsfr(0.1) and Nsfr(1.1) are both significantly higher than zero in 11 (out of 14) field sources.
The ongoing star formation activity in field sources is consistent with them being mostly (late) spirals or irregulars, as expected from the morphology-density relation (e.g. Dressler dres80 (1980)).
The of field sources correlates with redshift (see Fig. 13), as expected in a flux-limited survey. In Fig. 13 we show that the lower envelope of the observed vs. relation approximately corresponds to the expected relation for a source with an observed 14.3 m flux density 0.121 mJy (the 50% completeness limit of the A2218 ISOCAM survey, see Paper I), corrected by the average amplification factor (0.6) due to the cluster lensing, and using the average K-corrections for the models that best fit the observed field source SEDs.
The - and SFR-distribution of field sources are shown in Fig. 8 (bottom panels). The average is , and the median is . Eight of the 14 field sources classify as LIRGs (% of all field sources). All LIRGs are sources with known redshift. These high ’s translate (via eq. 1) into high SFRs, 2–125 , with an average (median) of 33 (22) . The highest-SFR source in our sample is no.38, a lensed object at already detected in the MIR by Barvainis et al. (barv99 (1999)).
The distribution of the field sources in the Nsfr(1.1) vs. Nsfr(0.1) diagram (see Figure 3, bottom panel) can help us understand better the nature of these field sources. Most of them are located in the central part of the diagram, characterized by similar values of Nsfr(1.1) and Nsfr(0.1), both above unity (see also Table 1), and only for one source is Nsfr(0.1) significantly higher than Nsfr(1.1). This suggests that we are not observing these galaxies during an exceptional starburst event, and that their current SFR was maintained at a similar level for quite some time. If anything, the median value of Nsfr(1.1) of these 14 field galaxies is higher than their median value of Nsfr(0.1), implying a higher SFR in the recent past than today. Consistently, almost half of the galaxies in the field sample are located in the Nsfr(0.1)-Nsfr(1.1) part of the diagram also occupied by PSB models (see Figure 3, bottom panel). However, on a galaxy per galaxy basis, the values of Nsfr(0.1) and Nsfr(1.1) are not significantly different, and other models, implying no major starbursts (e.g. intermediate-age spirals) fit the field galaxy SEDs as well as the PSB models.
With the present data we are therefore unable to say whether the IR-selected field galaxies in our sample experienced one (or several) starburst events in the recent past, or whether they underwent a smoother evolution. However, the SED fitting analysis suggests that their SFRs have not changed significantly in the last Gyr. This conclusion implies that, on average, of stars were produced in the last Gyr before the observing epoch. This represents a substantial fraction of the total baryonic mass of these galaxies (as estimated from the best-fit GRASIL models) %, on average.
These ISOCAM field sources are therefore powerful star-forming galaxies, and they shine in the IR because a substantial fraction of their stellar luminosity is re-emitted in the IR. The amount of extinction is –1.5 and –2 magnitudes, respectively, in the rest-frame and bands, for the typical best-fit models. All field sources have , and a few have (see Fig. 9, bottom panel).

7 The Butcher-Oemler effect
In Fig. 14 we show the vs. colour-magnitude diagram for all the sources in the LPS catalogue. Among these, the sources detected by ISOCAM are plotted as filled symbols, and confirmed cluster sources are plotted as diamonds. The dashed line is a best-fit to the main sequence of cluster members. All ISOCAM cluster sources lie close to the main colour-magnitude sequence.
The fraction of blue BO galaxies was defined by Butcher & Oemler (butc84 (1984)) as the fraction of galaxies 0.2 mag bluer than the early-type galaxies, and brighter than a K-corrected (but not evolutionary corrected) (they used km s-1 Mpc-1, and ). This absolute magnitude limit corresponds to an apparent magnitude limit , after correcting for the Galactic absorption in the direction of A2218 (as given by Schlegel et al. schl98 (1998)), and for the K-correction (we take the values from Poggianti pogg97 (1997)), and using the color of an early-type galaxy at (Fukugita et al. fuku95 (1995)). At the cluster redshift, a colour difference of 0.2 mag corresponds roughly to the difference between the colours of an E and a S0 galaxy; at the same redshift, the colours of the same galaxy types differ by mag (Fukugita et al. fuku95 (1995)). Therefore, in order to compute the BO effect in A2218, we consider the galaxies with , and, among these, those bluer by mag than the colour-magnitude sequence in the vs. colour-magnitude diagram.
Using the LPS data we estimate a BO galaxy fraction , intermediate between the value given by Butcher & Oemler (butc84 (1984)), , and that given by Rakos et al. (rako01 (2001)), . However, if we only consider the confirmed cluster members, the fraction of blue BO galaxies drastically decreases to . Similar fractions of blue galaxies are found when selecting ISOCAM galaxies. When we consider all ISOCAM galaxies, the blue fraction is ; only five ISOCAM galaxies contribute to the blue fraction in the A2218 field (sources 2, 15a, 27, 61a, and 64). Of these five galaxies, two are in the field, and three are at unknown redshift, although one, sources 61a, is a likely cluster member, based on the results of the SED fit analysis.
In A2218 the BO effect is the same when galaxies are selected in the optical or in the MIR. Hence we would conclude that there is no MIR-BO effect in A2218. However, we might have underestimated the size of the effect because of the relatively small field covered by ISOCAM observations. Ellingson et al. (elli01 (2001)) have in fact shown that in order to detect the BO effect it is necessary to sample radii larger than , which is much beyond the radius of our ISOCAM observations of A2218.


8 Discussion
8.1 Cluster sources
We have fitted the SEDs of 27 ISOCAM cluster sources (see Table 3) with GRASIL models. Of these 27 sources, most are characterized by a SED that declines from the NIR to the MIR, which is a typical feature of quiescent galaxies with little or no star formation. The SEDs of 20 ISOCAM cluster sources are best fit by models without episodes of star formation in the last 1.1 Gyr. For simplicity, hereafter we refer to these 20 galaxies as the passive cluster sample.
The MIR emission of these galaxies corresponds to the Rayleigh-Jeans tail of the photospheric emission from cold stars, as found by Boselli et al. (bose98 (1998)) for early-type galaxies in the Virgo cluster. The MIR flux densities of the galaxies detected by Boselli et al. (bose03 (2003)) in Virgo span a wide range (–1000 mJy); the 50% completeness limits of our survey of A2218 at 6.7 m (see Paper I) corresponds to 130 mJy at the distance of Virgo, hence we have only detected the bright end of the distribution of early-type galaxies in A2218 (see also Figs. 7 and 14). In general, the optical morphologies of the passive cluster members show they are early-type galaxies.
Our ISOCAM-selected passive galaxies seem to share the properties of the average A2218 population of bright galaxies, for which S01 estimated an age of 5–10 Gyr. An age of 5 Gyr implies that the last major episode of star formation in these galaxies occurred at .
The remaining seven ISOCAM-selected cluster sources show some evidence of a (small) star formation activity. We refer to these galaxies as the active cluster sample. Their SFRs are not strong, yr-1, and, according to the best-fit GRASIL models, are significantly lower than the average SFRs over the whole SFHs of these galaxies. However, galaxies of the active sample are among the faintest ISOCAM-detected members of the A2218 cluster in the NIR (see Fig. 9, top panel; the active cluster sources are indicated with crosses). The active cluster sources have IR luminosities that are comparable to, or even higher than, their luminosities in the NIR. Our results are therefore consistent with the general trend found by Boselli et al. (bose03 (2003)) in Virgo, namely that less massive cluster galaxies have higher flux density ratios.
Morphologically, most of the active cluster galaxies are not early-type, so it is perhaps not surprising that we find residual traces of recent star formation activity in their SEDs. However, two of them are S0–SB0/a. This is also not surprising, given the results obtained by S01, who showed that 30% of the S0 galaxies in A2218 have relatively blue colours, indicative of a recent (or ongoing) star formation activity. This supports a scenario in which part of cluster S0s are formed via transformation from field spirals that have recently entered the cluster environment (see, e.g., Poggianti pogg03 (2003)). We must caution the reader that four galaxies of the active cluster sample are not spectroscopically confirmed members, and it is therefore possible that some of them are in fact field galaxies that we erroneously assign to the cluster (for one of them, source 5, even the assigned optical counterpart is not certain, see § 2).
The spatial and velocity distributions of the MIR cluster sources are not different from those of the overall A2218 galaxy population. There is no evidence that they belong to substructures of A2218 or to an infalling population. Rather, it seems that the MIR selection of A2218 cluster sources is not biased. Probably, this happens because our MIR cluster sample is dominated by the passive population selected at 6.7 m, where the emission is of stellar photospheric origin. We would have obtained a different view of the cluster MIR population had our 6.7 m observations been less deep. If we only consider the nine MIR cluster members detected at 14.3 m, we find that only two of them belong to the passive population. It is therefore important, when comparing A2218 with other clusters, to account for the surveys different sensitivities and different areas.
In this respect, it is particularly interesting to compare the number of cluster LIRGs detected by ISOCAM in five different clusters, namely A1689 (Fadda et al. fadd00 (2000); Duc et al. duc02 (2002)), Cl0024+1654 (C04), A370 and A2390 (Paper I), and A2218. The advantage of using LIRGs to compare the number of IR active galaxies in different clusters is that a LIRG luminosity is high enough to lie above the limiting sensitivities of the surveys of all these clusters. In C04 we have recently determined the number of LIRGs for these five clusters, normalised by the surveyed areas and cluster masses. The fraction of LIRGs in Cl0024+1654 turns out to be significantly higher than the fraction in A370, and than the average fraction in A1689, A2218, and A2390. There is however no significant difference in the LIRG fractions of the latter three clusters.
In this same context it is also instructive to analyse the BO-effect in A2218, compared to the BO-effect in Cl0024+1654 and A1689. In Cl0024+1654 two thirds of the MIR cluster sources are part of the blue BO galaxies, and the MIR cluster sources contribute a third of all BO galaxies. In A1689, all BO galaxies are detected in the MIR (see Fig. 7 in Duc et al. duc02 (2002)). In A2218, only one MIR cluster source qualifies as a blue BO galaxy, out of four cluster members.
The reason for the different LIRG fractions and MIR BO-effects among different clusters is not clear. Part (but not all) of the differences could be due to the different surveyed areas. While the LIRG fractions were computed after normalising for the different surveyed areas, such normalisation might not be sufficient if the LIRG fraction significantly increases with the distance from the cluster centre. Such a dependence is suggested by the analysis of Cl0024+1654 (see C04), but more data are needed to confirm it. On the other hand, the radial dependence of the BO-effect is an obvious consequence of the morphology-density relation (e.g. Dressler dres80 (1980)), and larger physical areas have been covered by ISOCAM observations in Cl0024+1654 and A1689, than in A2218. Certainly, a larger physical area of A2218 needs to be covered in the IR, before we can make a solid statement about the (lack of a) MIR BO-effect. After all, even in the optical the BO-effect remains undetected when only the cluster central regions are observed (Ellingson et al. elli01 (2001)), as in the present study. However, given that all BO galaxies are MIR emitters in A1689, the fraction of MIR emitters among BO galaxies would not change if the surveyed area was smaller, and so it would still remain substantially higher than the corresponding fraction in A2218.
The different LIRG fraction is not simply related to the average evolution of clusters with redshift, since A370 and Cl0024+1654 have similar redshifts and yet have very different LIRG fractions. In C04 we suggest that an ongoing merger could be at the origin of the starbursting activity in the Cl0024+1654 galaxies. However, also A2218 is undergoing a merger with a substructure (Girardi et al. gira97 (1997); Cannon et al. cann99 (1999); Machacek et al. mach02 (2002)). An ongoing cluster-subcluster merger can stimulate starbursts in cluster galaxies through the tidal effects of a rapidly changing gravitational field (see, e.g., Bekki bekk01 (2001)), but only if these galaxies are gas-rich. Differences in the average cluster populations before the merger occurs could explain the different impact of a cluster-subcluster merger on the stimulation of star-formation and of IR-emission in cluster sources. As a matter of fact, the fraction of emission-line galaxies in Cl0024+1654 (40 % according to Czoske et al. czos02 (2001)), is much higher than in A2218, and in rich clusters in general (Biviano et al. bivi97 (1997)), and, correspondingly, the fraction of blue galaxies is quite low in A2218, possibly even lower than the average fraction in nearby clusters (Rakos et al. rako01 (2001)).
We might thus speculate that the enhancement in the fraction of MIR active cluster members is not simply the consequence of an ongoing cluster-subcluster collision, but also of the integrated history of the cluster, from which it depends how many cluster galaxies still retain significant amounts of gas to fuel the star formation activity. However, a larger physical area coverage of galaxy clusters in the IR is needed before we can make a conclusive statement about the variation (if any) of the number of MIR galaxies among different clusters.
8.2 Field sources
We have fit the SEDs of 14 field sources(see Table 3) with GRASIL models. These SEDs are very different from those of cluster sources, and are characterized by an increasing flux density with increasing wavelength from the UV–optical to the MIR. Models of star-forming galaxies without an AGN component provide satisfactory fits to the observed SEDs. Although we cannot exclude that an AGN component is also present, it is unlikely to be dominant for these 14 sources. The SEDs of three field sources (see Appendix B) could not be fit with any of the models we considered. Possibly this is due to a problem of source confusion, or, possibly, the emission of these three sources is AGN-dominated. In the latter case, the fraction of MIR sources in our sample with an AGN-dominated emission would be , comparable to the fractions reported in the literature (Fadda et al. fadd02 (2002); Elbaz et al. elba02 (2002)). Characterizing the MIR SED of AGNs is however beyond the scope of this paper.
Models providing acceptable fits to the 14 field galaxy SEDs have significant recent and ongoing star formation. To be specific, we find that the median SFR of these 14 field galaxies is 22 , and that this corresponds to 1.1 the SFR averaged over the galaxies entire SFHs, according to the best-fit GRASIL models. According to the same models, the SFRs of these galaxies have not changed much over the last Gyr, so that % of the galaxies total baryonic mass was converted in stars in the last Gyr before the observing epoch (i.e. since , taking the median redshift of these sources, , as representative of the sample). Such an intense star forming activity can occur in a continuous smooth fashion or in a single starburst. In the former case, we would identify our MIR-selected field galaxies with massive () spirals near the peak of activity in their SFH. In the latter case, the starburst is likely to have occurred some time before observation, as SB models do not in general provide best-fits to the observed field galaxy SEDs, and, in fact, PSB models are preferred (see Table 1 and Figure 3, bottom panel). Note however that since we only considered two SB and two PSB models, the evidence in favour of PSB vs. SB models is only tentative, but a full statistical approach of the kind described by Chary & Elbaz (char01 (2001)) is not justified because of the rather large errors on our (quite faint) MIR fluxes.
Among the two rather extreme SFHs described above, a more realistic one could be that described by Elbaz et al. (elba04 (2004)), in which the galaxies undergo a series of Luminous IR Phases (LIRPs). Such LIRPs would be produced by minor starburst events triggered by galaxy-galaxy interactions, but not necessarily major collisions or major mergers. This scenario is supported by the observations of Flores et al. (flor99 (1999)) who have found that the SEDs of many ISOCAM galaxies selected in the Canada-France Redshift Survey are not indicative of young dusty starbursts, but, rather, of normal spirals with a significant population of A stars, suggesting previous (recent) starbursting episodes. Similarly, Mann et al. (mann02 (2002)) have shown that the SEDs of several ISOCAM sources in the Hubble Deep Field South are adequately fitted by models of normal spirals, rather than by starburst models.
The morphologies of the field ISOCAM galaxies in our sample span a wide range, from E to Sdm and Irr, but late-types dominate. Peculiarities and asymmetries are visible in a few cases, possibly indicating past or ongoing interactions with other galaxies, which could be partly responsible for an enhanced star formation activity (Condon et al. cond82 (1982)). Previous studies have already suggested that interactions might be quite common among ISOCAM-selected field galaxies (Flores et al. flor99 (1999); Elbaz & Cesarsky elba03 (2003); Hammer et al. hamm04 (2004)).
The LIRG fraction among our MIR field sources (%), and their average SFR (33 ) are in good agreement with the values found in other ISOCAM field surveys (e.g. Chary & Elbaz char01 (2001); Elbaz et al. elba02 (2002); Elbaz & Cesarski elba03 (2003); Mann et al. mann02 (2002)). In this context it is useful to warn the reader about the different nomenclature used here, with respect to the one adopted by Chary & Elbaz (char01 (2001)) and Elbaz et al. (elba02 (2002)). We all use the terms LIRGs and ULIRGs to indicate, respectively, galaxies with and . However, Chary & Elbaz (char01 (2001)) and Elbaz et al. (elba02 (2002)) use the term ’starburst’ to indicate galaxies with intermediate IR luminosity (), while we use the same term to indicate that the galaxy is undergoing an intense and short phase of star formation, at a rate significantly higher than the average SFR of the galaxy before the starburst event, independently from the galaxy IR luminosity. Adopting Elbaz et al.’s (elba02 (2002)) definition, we would count 8 LIRGs and 6 ’starbursts’ in our sample of 14 field galaxies.
The redshift distribution of our field sources (, with a median ) is also in agreement with the values found in other ISOCAM field surveys (see Flores et al. flor99 (1999); Rigolopolou et al. rigo02 (2002); Elbaz & Cesarski elba03 (2003); Paper I).
In conclusion, our analysis confirms and reinforces previous results, that we can summarize by saying that, on average, ISOCAM-selected field galaxies are disk galaxies at , with ongoing star formation activity at a rate of several dozens . It is possible that some (or even most) of these galaxies have suffered one or more starburst events in the recent past, but only a minority seem to be detected during the peak of the (short-lived) starburst phase. The contribution of an AGN to the IR emission of field galaxies cannot be excluded, but it is unlikely to be dominant.
9 Summary and conclusions
Using ISOCAM observations of the A2218 cluster (described at length in Paper I), optical data from LPS, S01, and Z01, and imaging, we have investigated the properties of MIR-selected sources in the A2218 cluster field. Specifically, we have used a battery of GRASIL models (S98) to search for the best-fit to the optical-to-MIR SEDs of the non-stellar sources. Acceptable and well constrained fits have been obtained for the SEDs of 41 sources, of which 27 are cluster members (see Table 3).
The properties of the cluster members detected in the MIR can be summarized as follows. Most of them are early-type galaxies with small or negligible ongoing star-formation, and no significant evidence of recent previous episodes of star-formation. These galaxies are mostly detected at 6.7 m only, where we see the Rayleigh-Jeans tail of cold stellar photospheres. A quarter of the MIR cluster galaxies show significant (albeit small) star-formation activity. They are characterized by smaller baryonic masses (as indicated by their NIR luminosities), on average, and generally have spiral or irregular morphologies, but two of them are of S0–S0a type.
The spatial and velocity distributions of the MIR-selected cluster galaxies are not significantly different from those of the general cluster population. MIR-selected cluster galaxies are not, in general, BO galaxies. Several independent analyses suggest that A2218 is not a dynamically relaxed cluster. Complementing what is seen in other clusters (see, e.g., C04), our results therefore suggest that a cluster active dynamical status is not sufficient to affect the MIR properties of its member galaxies.
Foreground and background galaxies in the A2218 cluster field are mostly detected at 15 m. They span the redshift range 0.1–1.1, with a median . Their MIR emission is most likely dominated by dust-reprocessed stellar radiation, although we cannot exclude an AGN contribution in some of them. Models of actively star-forming galaxies, such as those of normal spirals and starburst galaxies, observed close to the time of maximum star-formation activity, but not necessarily during the short-lived starburst phase, provide good fits to the SEDs of MIR field galaxies. These field galaxies have a wide range of morphologies, but most of them are spirals. Features suggestive of ongoing or past interaction are found in a minority of the galaxies of the sample. About half of the field galaxies in our sample are LIRGs, and their high IR luminosities translate into a median SFR of .
This paper is the second in a series devoted to the analysis of the data of the ISOCAM gravitational lensing deep survey (see Paper I). In a forthcoming paper of these series (Perez et al. pere04 (2004)) we will extend our analysis to the lensing clusters A370 and A2390, which, together with our analyses of the clusters Cl0024+1654 (C04) and A2219 (Coia et al. 2004b ), will provide the most extensive data-sample of MIR-selected galaxies in medium-distant clusters. This sample will be expanded by forthcoming observations with the Spitzer Space Telescope.
Acknowledgements.
We thank Laura Silva for her invaluable advice on the use of the GRASIL code, and Andy Pollock and Ian Smail for useful discussions. We also wish to thank Jean François Le Borgne and Ian Smail for sending us electronic versions of their data-sets. Finally, we thank the referee for valuable suggestions that helped to improve the presentation of our results. The ISOCAM data presented in this paper was analysed using “CIA”, a joint development by the ESA Astrophysics Division and the ISOCAM Consortium. The ISOCAM Consortium is led by the ISOCAM PI, C. Cesarsky. This research has made use of NASA’s Astrophysics Data System, of the SIMBAD database at the Centre de Données Astronomiques in Strasbourg, and of the NASA/IPAC Extragalactic Database (NED) which is operated by the Jet Propulsion Laboratory, California Institute of Technology, under contract with the National Aeronautics and Space Administration.Appendix A The SED fitting procedure
As described in § 3, we fit the SEDs of our ISOCAM sources with 30 GRASIL models using a method. Here we detail some aspects of the SED fitting procedure.
The wavelength resolution of the GRASIL models in the IR is such that we must take the band-widths of the LW2 and LW3 ISOCAM filters (which are significantly larger than the band-widths of optical and NIR filters) into account, yet, on the other hand the detailed shape of the filter wavelength responsivities (see, e.g., Blommaert et al. blom01 (2001)) is not important, hence we consider them to be box-shaped.
The model SEDs are redshifted to the source . When the source is not known, we search for the best-fit among 12 values of between and , roughly equally spaced in cosmological time, and including the mean cluster redshift, . Note that, at variance with Mann et al. (mann02 (2002)), we only consider models with an age less than the age of the Universe (in the adopted cosmology) at the given .
When the redshift of the optical counterpart is known, there are two free parameters in the fit, the model SED and the normalisation of the model. In principle, parameters in the GRASIL code depend on the galaxy mass (e.g. the duration of the wind phase), so that the flux scale cannot be re-normalized at will. However, a fine-tuning of the GRASIL parameters is only appropriate when the galaxy SED we are trying to fit is very well constrained. Otherwise, it is sensible to leave the flux scale normalisation as a free parameter in the fit, in so far as the observed galaxy masses are not very different from those the models were originally designed to fit. The GRASIL models we use here had their (mass-related) parameters set to reproduce galaxies of luminosity or brighter (L. Silva, private comm.), hence they are appropriate for a comparison with our ISOCAM galaxies.
When is not known, it is taken as an additional free parameter in the fitting procedure. In order to check how well we can determine the photometric redshift, , of our ISOCAM galaxies using the GRASIL models and the available optical-to-MIR data, we used the ISOCAM sources with known-, and left as a free parameter in the SED-fitting procedure. The best-fit then provides our estimate. The photometric and spectroscopic ’s are significantly correlated (Kendall’s rank correlation probability is %), and the root mean square (rms, hereafter) difference between the spectroscopic and photometric ’s is 0.10. Hence, we can hope to use the SED-fitting procedure to determine approximate estimates for the ISOCAM sources with the best-sampled SEDs.
In particular, for a given ISOCAM source we consider our estimate sufficiently well constrained when the rms of the -values obtained in all the acceptable fits (at the % c.l.) is . In this case, if is consistent with the cluster mean redshift, we assign the source to the cluster, otherwise, we adopt the best-fit estimate.
Source confusion is not a major issue for most of our A2218 ISOCAM sources. However, when we suspect that another optical galaxy could contribute to the MIR flux, we should consider the summed contribution of both optical counterparts. Of course, in this case, we must fit two models (and sometimes two redshifts) instead of one. Hence, the number of free parameters sometimes become too large with respect to the number of available data, and we cannot constrain the best-fit solution. The available data suggest that we try the two-model fit for source nos. 33, 45, 61a, 61b, 67. In none of these cases does the best-fit improve with respect to the fit with a single optical counterpart.
Appendix B Notes on individual sources
We discuss in some detail here the five sources whose SEDs we failed to fit with the 30 GRASIL models considered (see § 3).
ISO_A2218_02. This ISOCAM source is detected in both the LW2 and LW3 bands. We identify this ISOCAM source with the optical counterpart L664, at a redshift , but we note that the nearby galaxy L663, at unknown redshift, could contribute substantially to the MIR flux, since its -band flux density is 30% of the flux density of L664. Using L664 as the only optical counterpart, we do not find acceptable fits to the source optical-to-MIR SED. Formally, the best-fit is obtained for a Sa5 model, but the fit is poor mostly because the model underestimates the -band flux. It is possible that the MIR flux is provided by both L664 and L663. However, we do not have enough data to constrain a fit with two independent models for the two galaxies, and a free redshift for L663.
ISO_A2218_28. This ISOCAM source is detected in the LW2 band only, and its optical counterpart is L391, the cluster cD, at . Its spectral type is that of an early-type galaxy, according to LPS. The MIR emission of this ISOCAM source is very extended, and probably it is not contributed solely by the cD (see Fig. 1). Using L391 as the only optical counterpart, this source SED is best fit by an Em10 model, but the fit is poor, mainly because it underestimates the band flux. Given the very extended emission from this galaxy, and the considerable crowding of galaxies in its vicinity, it is perhaps not surprising that it is difficult to fit its SED. Consistent aperture photometry is needed to ensure that we are sampling the same parts of this galaxy at different wavelength. An accurate modelling of the cD is however beyond the scope of this paper.
ISO_A2218_35. This is an ISOCAM source detected in both the LW2 and LW3 bands. It is identified with L317 (also S420), an Scd at . The best-fit to the source SED is given by a Mps5 model, but the fit is only marginally acceptable (at the 1.6% c.l.).
ISO_A2218_53. This ISOCAM source is detected in the LW3 band only. Its most likely optical counterpart is L205 (also S368), but L212 might contribute significantly to the MIR flux, since the -band flux ratio of the two galaxies is 0.4. L205 is an Sc at , L212 is an unknown- spiral. Using L205 as the only optical counterpart, the best-fit is obtained for a Sc5 model, but the fit is poor, mainly because it underestimates the band flux. Unfortunately, we do not have enough data to constrain a fit with two independent models for the two galaxies, and a free redshift for L212.
ISO_A2218_67. This ISOCAM source is detected in both the LW2 and LW3 bands. It is identified with L75 (also S4004), a faint object at unknown . Other galaxies could contribute to the MIR emission, in particular L71 (also S4005), an Scm, but possibly also L67. The -band flux ratios of L75 to L71 and to L67 are 1.4 and 0.6, respectively. Adopting L75 as the only optical counterpart, we do not find an acceptable fit to the source SED, whatever the source redshift. Formally, the best-fit is found for an Es2 model at , but it is a poor fit that severely underestimates the MIR fluxes. We try adding L71 as an additional counterpart. Unfortunately, no acceptable fits are found in this case either. The formal best-fit is obtained for a combination of a El5 model, and a Es2 model. Although the fit now reproduces the LW2 flux, it still underestimates the LW3 flux. The role of another possible counterpart, L67, cannot be evaluated for lack of photometric data. Notably, this source has also been detected in the X-ray by Chandra (Sanchez, private comm.). Hence, part of the MIR emission could arise from an AGN component embedded in a dusty torus, something that GRASIL models do not currently account for.
References
- (1) Abraham, R. G. et al. 1996, ApJ, 471, 694
- (2) Acreman, D.M., Stevens, I.R., Ponman, T.J., & Sakelliou, I. 2003, MNRAS, 341, 1333
- (3) Altieri, B., Metcalfe, L., Biviano, A., et al. 1998, in “The Young Universe: Galaxy Formation and Evolution at Intermediate and High Redshift”, S. D’Odorico, A. Fontana, & E. Giallongo eds. ASP Conference Series, Vol. 146, p.436
- (4) Altieri, B., Metcalfe, L., Kneib, J-P., et al. 1999, A&A, 343, 65
- (5) Andreon, S., Lobo, C., & Iovino, A. 2004, MNRAS, 349, 889
- (6) Aussel, H., Cesarsky, C.J., Elbaz, D., Starck, J.-L. 1999, A&A, 342, 313
- (7) Barvainis, R., Antonucci R., & Helou., G. 1999, ApJ118, 645
- (8) Beers, T. C., Flynn, K., & Gebhardt, K. 1990, AJ, 100, 32
- (9) Bekki, K. 2001, ApJ, 546, 189
- (10) Bertin, E., & Arnouts, S. 1996, A&AS, 117, 393
- (11) Bird, C. M., & Beers, T. C. 1993, AJ, 105, 4
- (12) Biviano, A., Durret, F., Gerbal, D., et al. 1996, A&A, 311, 95
- (13) Biviano, A., Katgert, P., Mazure, A., et al. 1997, A&A, 321, 84
- (14) Blommaert, J., Siebenmorgen, R., Coulais, A. et al., 2001, http://www.iso.vilspa.esa.es/users/expl_lib/CAM_top.html “The ISO Handbook: Volume III, CAM – The ISO Camera”, ESA SP-1262, SAI/99-069/Dc, Version 1.2
- (15) Boselli, A., Lequeux, J., Contursi, A., et al. 1997, A&A, 324, L13
- (16) Boselli, A., Lequeux, J., Sauvage, M., et al. 1998, A&A, 335, 53
- (17) Boselli, A., Gavazzi, G., & Sanvito, G. 2003, A&A, 402, 37
- (18) Butcher, H., & Oemler, A. Jr. 1984, ApJ, 285, 426
- (19) Cannon, D. B., Ponman, T. J., & Hobbs, I. S. 1999, MNRAS, 302, 9
- (20) Cesarsky, C., Abergel, A., Agnése, P., et al. 1996, A&A, 315, L309
- (21) Chary, R. & Elbaz, D. 2001, ApJ, 556, 562
- (22) Coia, D., McBreen, B., Metcalfe, L. et al., 2004a, A&A, submitted (C04)
- (23) Coia, D., McBreen, B., Metcalfe, L. et al., 2004b, in preparation
- (24) Coles, P., Melott, A. L., & Munshi, D. 1999, ApJ, 521, L5
- (25) Condon, J. J., Condon, M. A., Gisler, G., & Puschell, J. J. 1982, ApJ, 252, 102
- (26) Contursi, A., Boselli, A., Gavazzi, G., et al. 2001, A&A, 365, 11
- (27) Czoske, O., Moore, B., Kneib, J.-P., & Soucail, G. 2002, A&A, 386, 31
- (28) D’Agostino, R. 1986, in ”Goodness-of-fit techniques”, p. 372, R. B. D’Agostino & M. A. Stephens eds., Marcel Dekker, Inc., New York
- (29) Danese, L., De Zotti, D., & di Tullio, G. 1980, A&A, 82, 322
- (30) den Hartog, R., & Katgert, P. 1996, MNRAS, 279, 349
- (31) Dressler, A. 1980, ApJS, 42, 565
- (32) Dressler, A., & Gunn, J. E. 1983, ApJ, 270, 7
- (33) Dressler, A., Oemler, A., Couch W., et al. 1997, ApJ, 490, 577
- (34) Dressler, A., & Shectman, S. A. 1988, AJ, 95, 284
- (35) Dressler, A., Smail, I., Poggianti, B.M., et al. 1999, ApJS, 122, 51.
- (36) Duc, P.-A., Poggianti, B. M., Fadda, D. et al., 2002, A&A, 382, 60
- (37) Ebbels, T., Ellis, R., Kneib, J.-P., et al., 1998, MNRAS 295, 75
- (38) Elbaz, D., & Cesarsky, C. 2003, Science, 300, 270
- (39) Elbaz, D., Marcillac, D., & Moy, E. 2004, to appear in the Proceedings of the ESO/USM/MPE Workshop on ”Multiwavelength Mapping of Galaxy Formation and Evolution”, eds. R. Bender and A. Renzini, astro-ph/0403209
- (40) Elbaz, D., Cesarsky, C. J., Fadda, D., et al. 1999, A&A, 351, L37
- (41) Elbaz, D., Cesarsky, C. J., Chanial, P., et al. 2002, A&A, 384, 848
- (42) Ellingson, E., Lin, H., Yee, H.K.C. & Carlberg, R.G. 2001, ApJ, 547, 609
- (43) Fabricant, D., Franx, M., & van Dokkum, P. 2000, ApJ, 539, 577
- (44) Fadda, D., Elbaz, D., Duc, P.-A., et al. 2000, A&A, 361, 827
- (45) Fadda, D., Flores, H., Hasinger, G., et al. 2002, A&A, 383, 838
- (46) Fasano, G., & Franceschini, A. 1987, MNRAS, 225, 155
- (47) Fasano, G., Poggianti, B.M., Couch, W.J. et al. 2000, ApJ, 542, 673
- (48) Flores, H., Hammer, F., Thuan, T. X. et al. 1999, ApJ, 517, 148
- (49) Franceschini, A., Aussel, H., Cesarsky, C.J., Elbaz, D., & Fadda, D. 2001, A&A, 378, 1
- (50) Fukugita, M., Shimasaku, K., & Ichikawa, T. 1995, PASP, 107, 945
- (51) Gavazzi, G., Pierini, D., & Boselli, A. 1996, A&A, 312, 397
- (52) Gebhardt, K. & Beers, T. C. 1991, ApJ, 383, 72
- (53) Genzel, R., & Cesarsky, C. J. 2000, ARA&A, 38, 761
- (54) Girardi, M., Fadda, D., Escalera, E., et al. 1997, ApJ, 490, 56
- (55) Girardi, M., & Mezzetti, M. 2001, ApJ, 548, 79
- (56) Girardi, M., & Biviano, A. 2003, in “Merging Processes in Galaxy Clusters”, p.39, L. Feretti, I. M. Gioia, & G. Giovannini, eds., Astrophysics and Space Science Library, 272, Kluwer, Dordrecht
- (57) Gnedin, O.Y. 2003, ApJ, 589, 752
- (58) Granato, G. L., Silva, L., Monaco, P., et al. 2001, MNRAS, 324, 757
- (59) Hammer, F., Flores, H., Liang, Y., et al. 2004, to appear in the proceedings of the ESO symposium ”Multiwavelength Mapping of Galaxy Formation and Evolution”, R. Bender & A. Renzini eds., astro-ph/0401246
- (60) Hudelot, P. et al. 2004, in preparation
- (61) Kauffmann, G., & Charlot, S. 1998, MNRAS, 294, 705
- (62) Kennicutt, R. C. Jr. 1998, ARA&A, 36, 189
- (63) Kneib, J.-P., Mellier, Y., Pelló, R., et al. 1995, A&A, 303, 27
- (64) Lavery, R. J. & Henry, H. J. 1994, ApJ, 426, 524
- (65) Le Borgne, J. F., Pelló, R., & Sanahuja, B. 1992, A&AS, 95, 87
- (66) Lémonon, L., Pierre, M., Cesarsky, C. J., et al. 1998, A&A, 334, L21
- (67) Machacek, M. E., Bautz, M. W., Canizares, C., & Garmire, G. P. 2002, ApJ, 567, 188
- (68) Mann, R. G., Oliver, S., Caarballo, R., et al. 2002, MNRAS, 332, 549
- (69) Margoniner, V. E., de Carvalho, R. R., Gal, R. R., & Djorgovski, S. G. 2001, ApJ, 548, L143
- (70) Melchiorri, A., & Ödman, C. 2003, Phys. Rev. D, 67, 081302
- (71) Metcalfe, L., Kneib, J.-P., McBreen, B., et al. 2003, A&A, 409, 791 (Paper I)
- (72) Okamoto, T., & Nagashima, M. 2003, ApJ, 587, 500
- (73) Okumura, K. 1998, ESA ISOCAM PSF Report, www.iso.vilspa.esa.es/users/expl_lib/CAM/psf_rep.ps.gz
- (74) Pelló, R., Le Borgne, J. F., Sanahuja, B., Mathez, G., & Fort, B. 1992, A&A, 266, 6
- (75) Perez, R., Metcalfe, L., McBreen, B., et al. 2004, in preparation
- (76) Pierre, M., Aussel, H., Altieri, B., et al. 1996, A&A, 315, L297
- (77) Pimbblet, K. A. 2003, PASA, 20, 294
- (78) Poggianti, B. M. 1997, A&AS, 122, 399
- (79) Poggianti, B. M. 2003, Ap&SS, 285, 121
- (80) Poggianti, B. M., Smail, I., Dressler, A., et al. 1999, ApJ, 518, 576
- (81) Puget, J.-L., Abergel, A., Bernard, J. P., et al. 1996, A&A, 308, L5
- (82) Quillen, A. C., Rieke, G. H., Rieke, M. J., Caldwell, N., & Engelbracht, C. W. 1999, ApJ, 518, 632
- (83) Rakos, K., Dominis, D., & Steindling, S. 2001, A&A, 369, 750
- (84) Rigopoulou, D., Franceschini, A., Aussel, H., et al. 2002, ApJ, 580, 789
- (85) Rowan-Robinson, M. 2001, New Astron. Rev., 377, 631
- (86) Sato, Y., Kawara, K., Cowie, L. L., et al. 2003, A&A, 405, 833
- (87) Schlegel, D. J., Finkbeiner, D. P., & Davis, M. 1998, ApJ, 500, 525
- (88) Serjeant, S., Oliver, S., Rowan-Robinson, M., et al. 2000, MNRAS, 316, 768
- (89) Silva, L., Granato, G. L., Bressan, A., & Danese, L. 1998, ApJ, 509, 103 (S98)
- (90) Smail, I., Kuntschner, H., Kodama, T., et al. 2001, MNRAS, 323, 839
- (91) Soucail, G., Kneib, J. P., Bézecourt, J., et al. 1999, A&A, 343, L70
- (92) Tokunaga, A. T. 2000, in “Allen’s Astrophysical Quantities”, 4th edition, ed. A. N. Cox, AIP Press (Springer Verlag), New York
- (93) Xu, C. 2000, ApJ, 541, 134
- (94) Ziegler, B. L., Bower, R. G., Smail, I., Davies, R. L., & Lee, D. 2001, MNRAS, 325, 1571