STATISTICAL ISOTROPY OF THE WILKINSON MICROWAVE ANISOTROPY PROBE DATA:
A BIPOLAR POWER SPECTRUM ANALYSIS
Abstract
The statistical expectation values of the temperature fluctuations of the cosmic microwave background (CMB) are assumed to be preserved under rotations of the sky. We use the bipolar power s pectrum (BiPS) proposed in Hajian & Souradeep to investigate the statistical isotropy (SI) of the CMB anisotropy maps recently measured by the Wilkinson Microwave Anisotropy Probe (WMAP). The method can isolate and probe specific regions of choice in multipole space using appropriate window functions. The BiPS is estimated for full sky CMB anisotropy maps based on the first year WMAP data using a range of window functions. The BiPS spectra computed for both full sky maps for all our window functions are consistent with zero, roughly within . The null BiPS results may be interpreted as an absence of strong violation of statistical isotropy in the first-year WMAP data on angular scales larger than that corresponding to . However, pending a careful direct comparison, our results do not necessarily conflict with the specific SI related anomalies reported using other statistical tests.
1 Introduction
The cosmic microwave background (CMB) anisotropy is a very powerful observational probe of cosmology. The recent Wilkinson Microwave Anisotropy Probe (WMAP) data have provided a precise determination of standard cosmological parameters reaffirming an emerging concordance model of cosmology, structure formation Bennett et al. (2003); Spergel et al. (2003) and, even inflation and the early universe. This remarkable success story is almost entirely based on the measurements of the angular power spectrum, , of the CMB anisotropy.
In standard cosmology, the CMB anisotropy is expected to be statistically isotropic, i.e., the statistical expectation values of are preserved under rotations of the sky. The issue of statistical isotropy (SI) applies to both Gaussian and non-Gaussian CMB sky maps. Here we limit our study to the Gaussian CMB anisotropy field, where the two-point correlation function contains all the statistical information encoded in the field. The importance of SI is based on a very well known fact: if the two point correlation is rotationally invariant, one can equivalently completely specify CMB anisotropy in terms of the Legendre transform, , the widely used angular power spectrum of CMB. When the SI holds, the information of the full CMB data set can be compressed into a multipole spectrum.
After the recent release of the first year of WMAP data, the SI of the CMB anisotropy has attracted considerable attention. Tantalizing evidence of SI breakdown (albeit, in very different guises) has mounted in the WMAP first year sky maps, using a variety of different statistics. It was pointed out that the suppression of power in the quadrupole and octopole are aligned Tegmark et al. (2004). Further “multipole-vector” directions associated with these multipoles (and some other low multipoles as well) appear to be anomalously correlated Copi et al. (2004); Schwarz et al. (2004). There are indications of asymmetry in the power spectrum at low multipoles in opposite hemispheres Eriksen et al. 2004a ; Hansen et al. (2004); Naselsky et al. (2004). Possibly related, are the results of tests of Gaussianity that show asymmetry in the amplitude of the measured genus amplitude (at about to significance) between the north and south galactic hemispheres Park (2004); Eriksen et al. 2004b . Analysis of the distribution of extrema in WMAP sky maps has indicated non-gaussianity, and to some extent, violation of SI Larson & Wandelt (2004). However, what is missing is a common, well defined, mathematical language to quantify SI (as distinct from non Gaussianity) and the ability to ascribe statistical significance to the anomalies unambiguously.
These results provide considerably increased motivation for this Letter in which we test the WMAP data for SI, in detail, using the bipolar power spectrum (BiPS) of CMB anisotropy, a powerful and easy to understand statistics, which was recently introduced to the field of CMB analysis Hajian & Souradeep 2003b ; Souradeep & Hajian (2003). If SI is violated, the do not contain all the statistical information of a Gaussian sky map. It is described by the whole set of cross-correlations of the coefficients in the harmonic space . The cosmic variance of the elements will prevent us from estimating the individual elements from a single map. Hence, it is very important to define a statistic that condenses the information of that matrix into a single spectrum that reduces the cosmic variance. BiPS does exactly that. Furthermore it is easy to interpret and straightforward to implement for very rapid computation.
2 Bipolar Power Spectrum Analysis
In spherical harmonic space representation where , the condition for SI translates to a diagonal where , is a complete description of (Gaussian) CMB anisotropy. When is not diagonal, the off-diagonal elements contain information beyond .
The BiPS is a combination of these off-diagonal elements in , containing extra non-SI information. The BiPS together with give a complete, orientation independent description of a Gaussian CMB anisotropy map.
The BiPS of CMB is defined by Hajian & Souradeep 2003b ; Souradeep & Hajian (2003); Hajian & Souradeep (2004)
| (1) |
where are the coefficients of the bipolar spherical harmonic (BiPoSH) expansion of the correlation function, which is the most general expansion of :
| (2) |
BiPoSH functions are the natural complete basis on Varshalovich et al. (1988). Here are a complete set of linear combinations of off-diagonal elements of :
| (3) |
where are Clebsch-Gordan coefficients. Every specific measure of off-diagonal elements of the covariance matrix suggested in the literature Durrer et al. (1998); Prunet et al. (2004) can be expressed in terms of . For an SI correlation function , implying and . An equivalent real space description of the BiPS in terms of appropriately weighted averages of the correlation is given in previous publications Hajian & Souradeep 2003b ; Souradeep & Hajian (2003).
We compute the BiPS using fast methods of spherical harmonic transform of the map 111We use the ANAFAST routine of the HEALPix package Górski,Hivon & Wandelt (1999) publicly available at http://www.eso.org/science/healpix/. and apply filters in multipole space using the appropriate positive definite window function . We define an unbiased estimator for the BiPoSH coefficients and then estimate ,
| (4) |
where , is the bias that arises from the SI part of the correlation function. Although BiPS is quartic in , it is designed to detect SI violation and not non-Gaussianity.
Consequently, for SI correlation, the measured will be consistent with zero within the cosmic variance. Cosmic error, , and bias, , are given by equations (14) and (17) of Hajian & Souradeep 2003b respectively, with , where is the total SI angular power spectrum of the “true” signal and noise. Multipole space windows that weigh down the contribution from the rest of the SI region of the multipole space will enhance the signal relative to cosmic error, .
It is important to note that bias can never be subtracted exactly for a non-SI map. What is important is whether the measured differs from zero at a statistically significant level.
It is not inconceivable that for strong SI violation, over-corrects for the bias leading to negative values of . The noise covariance is a possible source of SI violation. However, we have restricted our analysis to where the errors are dominated by the cosmic variance.
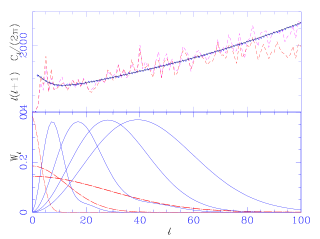
We carry out measurement of the BiPS, , on two full sky CMB anisotropy maps – (A) the Internal Linear Combination map (denoted as “ILC” in the figures; Bennett et al. (2003)), and (B) a foreground cleaned map (denoted as “Tegmark”; Tegmark et al. (2004)). The angular power spectra of these maps, shown in Figure 1, are consistent with the best fit theoretical power spectrum from the WMAP analysis. 222Based on an LCDM model with a scale-dependent (running) spectral index.
We use simple filter functions in space to isolate different ranges of angular scales. A low pass, Gaussian filter
| (5) |
which cuts off power on small angular scales (), and a band pass filter,
| (6) |
which retains power within a range of multipoles set by and . The window functions used in our work are plotted in Figure 1.
We use the WMAP best-fit (WMAPbf) to generate 1000 simulations of the SI CMB maps. The are generated up to an of 1024 (corresponding to maps at HEALPix resolution ). These are then multiplied by the window functions and and the BiPS for each realization is computed. We use to analytically compute the bias and the cosmic variance for . The average and standard deviation of of the SI maps are also estimations of the bias and the cosmic variance. We verified that the theoretical cosmic variance and bias match the numerical estimations of standard deviation and average of the realizations of the SI maps.
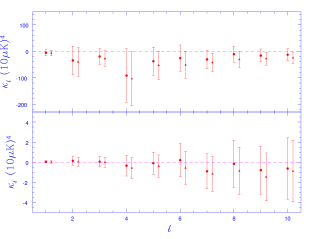
The BiPS of the full-sky CMB maps (A) and (B) based on the WMAP first-year data is computed in the same manner. We use the WMAPbf to compute the bias and cosmic variance analytically. Using the analytical bias and cosmic variance allows us to rapidly compute BiPS with 1 error bars for different theoretical . Figure 2 shows the measured values of for maps (A) and (B) for two of the window functions. We compute the BiPS for all the window functions shown in Figure 1.
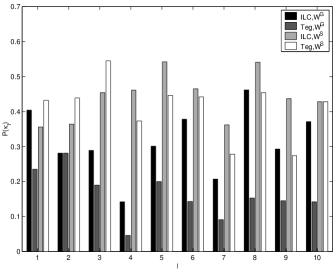
The BiPS measured from the simulated SI realizations of WMAPbf is also used to estimate the probability distribution functions (PDFs), defined as for and for (Fig. 3). We compute the individual probabilities of the map being SI for each of the measured .
The probabilities for the window function are greater than and the minimum probability at occurs at for . The reason for systematically lower SI probabilities for as compared to is simply due to the lower cosmic variance of the former. The contribution to the cosmic variance of BiPS is dominated by the low spherical harmonic multipoles. Filters that suppress the at low multipoles have a lower cosmic variance.
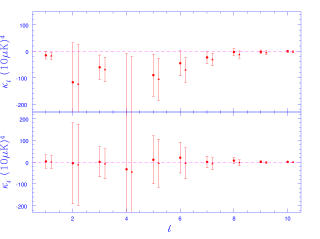
It is important to note that this probability is a conditional probability of the measured being SI given the theoretical spectrum used to estimate the bias. A final probability emerges as the Bayesian chain product with the probability of the theoretical used given data. Hence, small differences in these conditional probabilities for the two maps are perhaps not significant. The important role played by the choice of the theoretical model for the BiPS measurement is shown for a that retains power in the lowest multipoles, and . Assuming WMAPbf , there are hints of non-SI detections in the low (Fig. 4, top). We also compute the BiPS using a for a model that accounts for the suppressed quadrupole and octopole in the WMAP data Shafieloo & Souradeep (2004). The mild detections of a non zero BiPS vanish for this case (Fig. 4, bottom). This suggests that the excess power in the WMAPbf with respect to the measured from WMAP at the lowest multipoles tends to indicate mild deviations from SI.
The SI of the CMB anisotropy has been under scrutiny after the release of the first year of WMAP data. Using a BiPS analysis we find no strong evidence for SI violation in the WMAP CMB anisotropy maps. We have verified that our null results are consistent with measurements on simulated SI maps.
It is also possible to construct a model-independent “frequentist” estimator of BiPS that uses the of the map itself to compute the bias. Measurements on our simulated sky maps show that cosmic variance for this estimator is much smaller. The preliminary results on the same set of observed maps are consistent with SI and will be reported later. Work is in progress to verify them against analytical results. The full-sky maps and the restriction to low (where instrumental noise is sub-dominant) permits the use of our analytical bias subtraction and error estimates. The excellent match with the results from numerical simulations is a strong verification of the numerical technique. This is an important check before using Monte-Carlo simulations in future work targeting the regime, which involves a galactic mask and a non-uniform noise matrix.
There are strong theoretical motivations for hunting for SI violation in the CMB anisotropy. The possibility of non-trivial cosmic topology is a theoretically well-motivated possibility that has also been observationally targeted Ellis (1971); Levin (2002). Violation of SI is a generic feature of cosmic topology Bond,Pogosyan & Souradeep 1998, (2000). And the BiPS expected in flat, toroidal models of the universe has been computed and shown to be related to the principle directions in the Dirichlet domain Hajian & Souradeep 2003a . Hence, the null result of BiPS have important implications for cosmic topology. This approach complements the direct search for the signature of cosmic topology, and our results are consistent with the absence of the matched circles and the null S-map test of the WMAP CMB maps Cornish et al. 1998 & (2003); de Oliveira-Costa et al. 1996 & (2003). Work is in progress to combine a full Bayesian likelihood analysis with BiPS analysis to constrain cosmic topology Hajian et al. (2004), in particular the recently proposed dodecahedron universe Luminet et al. (2003). We defer to future publication, detailed analysis and constraints on cosmic topology using null BiPS measurements. Other theoretical scenarios that predict the breakdown of SI are also being probed using BiPS, e.g., primordial cosmological magnetic fields Durrer et al. (1998); Chen et al. (2004).
Observational artifacts such as foreground residuals, non-circular beam, inhomogeneous noise correlation, residual stripping patterns, etc. are potential sources of SI breakdown. Our null BiPS results confirm that these artifacts do not significantly contribute to the maps studied here.
3 Summary and Conclusion
In summary, we find null measurements of the BiPS for a selection of full-sky CMB anisotropy maps based on the first year of WMAP data. Our results rule out radical violation of statistical isotropy, and are consistent with null results for matched circles and the S-map tests of SI violation. We find that the excess power at low in the best-fit theory with respect to derived from the WMAP maps tends to enhance the SI violation signatures in BiPS. Our result is an unambiguous, well-defined, quantitative evaluation and assessment of the SI of the CMB anisotropy. But pending a more careful comparison, the results do not necessarily conflict with a number of other statistical tests that have suggested violation of statistical isotropy. We should also mention that our null BiPS results do not have any bearing on the non-Gaussianity of the maps.
The authors are very thankful for close interaction with David Spergel and Glenn Starkman all through the project, including careful reading and valuable comments on previous drafts of this Letter. We also acknowledge useful discussions with Dick Bond, Dmitry Pogosyan, and Carlo Contaldi. A.H. acknowledges help from A. Bhattacharjee. The use of the HPC facility of IUCAA computation is acknowledged.
References
- Bennett et al. (2003) Bennett, C. L., et.al., 2003, Astrophys. J. Suppl., 148, 1.
- Bond,Pogosyan & Souradeep 1998, (2000) Bond, J. R., Pogosyan, D. & Souradeep,T. 1998, Class. Quant. Grav. 15, 2671; ibid. 2000, Phys. Rev. D 62,043005;2000, Phys. Rev. D 62,043006.
- Chen et al. (2004) Chen, G., et al. 2004, preprint (astro-ph/0403695).
- Coles (2003) Coles, P. et al. 2003, preprint (astro-ph/0310252).
- Copi et al. (2004) Copi, C. J., et al. 2004 preprint, (astro-ph/0310511).
- Cornish et al. 1998 & (2003) Cornish, N.J., et al. 1998, Class. Quantum Grav., 15, 2657; 2004, Phys.Rev.Lett. 92, 201302.
- Cruz et al. (2004) Cruz, M., et al. 2004, preprint (astro-ph/0405341).
- de Oliveira-Costa et al. 1996 & (2003) de Oliveira-Costa, A., et al. 1996, ApJ 468, 457, de Oliveira-Costa, A., et al. 2004, Phys. Rev.D69, 063516.
- Durrer et al. (1998) Durrer, R., et al. 1998, Phys. Rev. D 58, 3004.
- Ellis (1971) Ellis, G. F. R. 1971, Gen. Rel. Grav. 2, 7.
- (11) Eriksen, H. K. et al., 2004 , Astrophys. J 605, 14.
- (12) Eriksen, H. K. et al., 2004, preprint (astro-ph/0401276).
- Gaztanaga & Wagg (2003) Gaztanaga, E. & Wagg, J. 2003, Phys. Rev. D68 021302.
- Górski,Hivon & Wandelt (1999) Górski,K. M., Hivon, E., Wandelt, B. D. 1999, in ”Evolution of Large-Scale Structure”, eds. A.J. Banday, R.S. Sheth and L. Da Costa, PrintPartners Ipskamp, NL, pp. 37-42 (also astro-ph/9812350).
- (15) Hajian, A. & Souradeep, T., 2003a preprint (astro-ph/0301590).
- (16) Hajian, A. & Souradeep, T., 2003b, ApJ 597, L5 (2003).
- Hajian & Souradeep (2004) Hajian, A. & Souradeep, T., 2004 in preparation.
- Hajian et al. (2004) Hajian, A., Pogosyan, D., Souradeep, T., Contaldi, C., Bond, J. R., 2004 in preparation; Proc. 20th IAP Colloq. on CMB physics and observation, 2004.
- Hansen et al. (2004) Hansen, F. K., et al. 2004, preprint. (astro-ph/0404206); 2004 ,ApJ.Lett. 607, 67.
- Komatsu et al. (2003) Komatsu, E., et al., 2003, ApJS, 148, 119.
- Larson & Wandelt (2004) Larson, D. L. & Wandelt, B. D. 2004, preprint, (astro-ph/0404037).
- Levin (2002) Levin, J. 2002, Phys. Rep. 365, 251.
- Luminet et al. (2003) Luminet, J.-P. et al. 2003, Nature 425 593.
- Naselsky et al. (2004) Naselsky et al, 2004, preprint, (astro-ph/0405523); (astro-ph/0405181); 2003 ,ApJ,599,L53 and references therein.
- Park (2004) Park, C., 2004, Mon. Not. Roy. Astron. Soc. 349, 313.
- Prunet et al. (2004) Prunet, S., et al. 2004, preprint (astro-ph/0406364).
- Shafieloo & Souradeep (2004) Shafieloo, A. & Souradeep, T., 2004, Phys. Rev. D, in press, (astro-ph/0312174).
- Schwarz et al. (2004) Schwarz, D. J. et al., 2004, preprint (astro-ph/0403353).
- Souradeep & Hajian (2003) Souradeep, T. and Hajian, A., 2004, Pramana, 62, 793.
- Spergel et al. (2003) Spergel, D. et al., 2003, Astrophys. J. Suppl., 148, 175.
- Tegmark et al. (2004) Tegmark, M., et al. 2004, Phys.Rev. D68 123523.
- Varshalovich et al. (1988) Varshalovich, D. A., et al. 1988 Quantum Theory of Angular Momentum (World Scientific).
- Vielva et al. (2003) Vielva, P., et al. 2003, preprint (astro-ph/0310273).