Infrared Properties of Radio-Selected Submillimeter Galaxies in the Spitzer First Look Survey Verification Field
Abstract
We report on submillimeter and infrared observations of 28 radio-selected galaxies in the Spitzer First Look Survey Verification field (FLSV). All of the radio-selected galaxies that show evidence for emission at 850m with SCUBA have Spitzer counterparts at 24m, while only half of the radio-selected galaxies without 850m emission have detectable counterparts at 24m. The data show a wide range of infrared colors (S70/S24 –30, S8/S3.6 –4), indicative of a mixture of infrared-warm AGN and cooler starburst dominated sources. The galaxies showing 850m emission have Spitzer flux densities and flux density ratios consistent with the range of values expected for high-redshift (–4) ultraluminous infrared galaxies.
1 Introduction
The Spitzer Space Telescope provides us with the exciting opportunity to study the high-redshift universe at mid&far-infrared wavelengths. The IRAS mission first uncovered the presence of infrared luminous galaxies in the local universe (Neugebauer et al. 1984), and the sub-mm/mm surveys with SCUBA and MAMBO have highlighted the importance of ultraluminous infrared galaxies (ULIRGs, ) at high redshift (e.g., Smail, Ivison, & Blain 1997; Hughes et al. 1998; Bertoldi et al. 2000). Studies of high-redshift ULIRGs are important for our general understanding of galaxy evolution since they are responsible for a significant fraction of the total energy generated by all galaxies over the history of the universe (e.g., Blain et al. 2002).
The recent spectroscopic studies of the sub-mm galaxy (SMG) population show that the redshift distribution peaks at –3 (Chapman et al. 2003b, 2004), and that the population is comprised of starbursts, AGN, and composite AGN+starburst systems (Ivison et al. 1998, 2000; Frayer et al. 2003; Knudsen, van der Werf, & Jaffe 2003). Even though many SMGs show the presence of AGN, the molecular CO line emission (Frayer et al. 1998, 1999; Neri et al. 2003) and X-ray data (Alexander et al. 2003) are consistent with the majority of the infrared emission for the population arising from star formation. The Multiband Imaging Photometer for Spitzer (MIPS, Rieke et al. 2004) allows us to directly measure the infrared colors and constrain the fraction of infrared-warm AGN dominated versus infrared-cool starburst dominated SMGs.
2 Observations
Before the launch of Spitzer, we identified potential SMGs in the First Look Survey Verification field (FLSV) by selecting radio sources with faint optical counterparts, following previous successful selection techniques (e.g., Cowie, Barger, & Kneib 2002; Chapman et al. 2003a). We used deep Westerbork 1.4 GHz radio data (rmsJy, Morganti et al. 2004) and deep optical NOAO -band data ( mag, Fadda et al. 2004a) to derive a list of candidate sources for follow-up observations with SCUBA. In the Spring of 2003, we observed 28 galaxies at the James Clerk Maxwell Telescope (JCMT) using the SCUBA two-bolometer photometry mode, achieving rms levels of 2–3 mJy at 850m.
The Spitzer observations were taken as part of the Extragalactic First Look Survey (FLS)111Spitzer program ID = 26, http://ssc.spitzer.caltech.edu/fls/extragal/spitzer.html.. The 28 galaxies in the sample are located within the 0.25 degree2 of the FLS verification field (FLSV) and were observed with both the InfraRed Array Camera (IRAC, Fazio et al. 2004) and MIPS. The data presented here have effective integration times of 480 s, 336 s, 168 s, and 34 s for the IRAC bands and the MIPS 24, 70, and 160m arrays, respectively. The data were reduced using the standard SSC pipeline and were coadded and corrected offline as needed. The details of the data reduction will be described in future FLS data papers (IRAC: Lacy et al. 2004; MIPS-24m: Fadda et al. 2004b; MIPS-70,160m: Frayer et al. 2004b).
3 Results and Discussion
3.1 Source Identification
We observed 28 Westerbork radio sources with SCUBA and detected 7 SMGs at S/N. Fourteen sources were not detected at 850m, and the remaining 7 sources have marginal results, showing positive signals of 1.5–3 (Column [4], Table 1). The Westerbork radio data have a resolution of which is well matched to the SCUBA data, but is not sufficient to obtain reliable counterparts in general for the optical and Spitzer data. We used the higher resolution () VLA (1.4 GHz) data of the field (Condon et al. 2003) to obtain more accurate radio positions. The resolution of the VLA data is well matched to the MIPS-24 resolution of . Although the VLA data have lower S/N (rmsJy), the Westerbork sources were typically detected at in the VLA image, providing radio positional errors of about 1–2. The offsets between radio and MIPS-24 positions are typically less than 2, consistent within the positional uncertainties of the radio data and the 1.5–2 positional uncertainties of the MIPS-24 data set. Based on the 24m counts in the FLS field (Marleau et al. 2004), the probability of a chance coincidence within 2 is only about 1% for 24m sources brighter than 100Jy. Hence, confusion at 24m is not a significant issue for this study. After the identification of the MIPS-24 and R-band counterparts based on the radio positions, the corresponding MIPS-24 and optical positions were used to identify the appropriate IRAC counterparts.
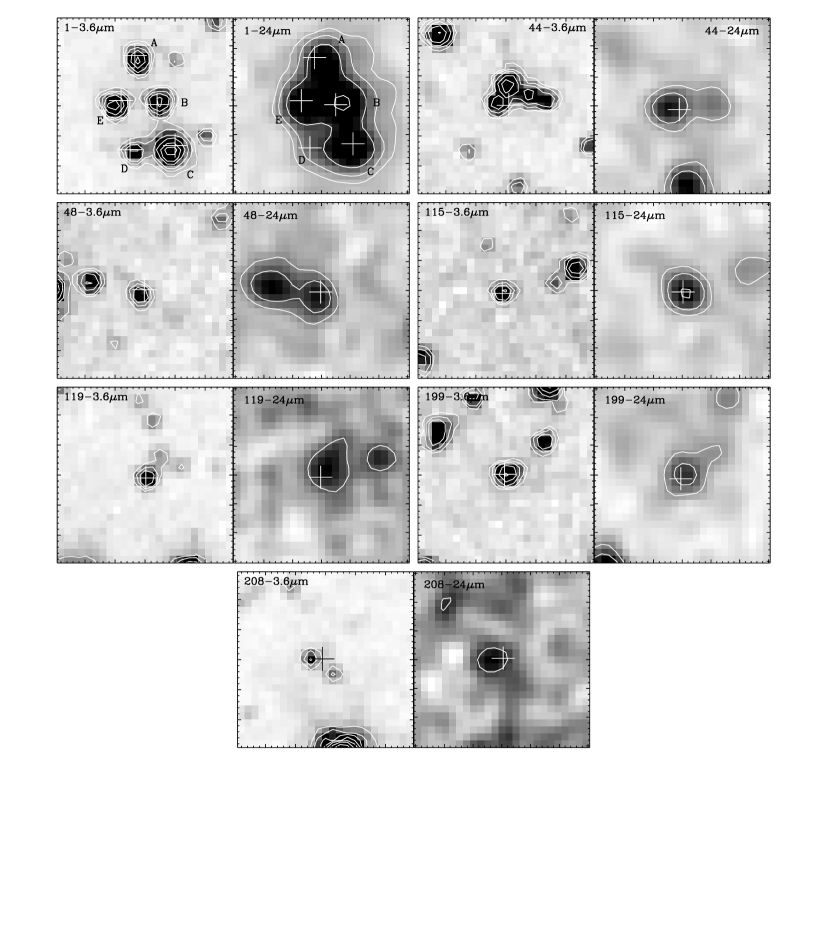
Four of the Westerbork sources have multiple radio components at the resolution of the VLA data (1, 45, 79, 128). Source 1 is the brightest Spitzer source and is comprised of five components, all detected in the MIPS-24, R-, and the IRAC-bands. The details of the source identification are provided in Table 1. Figure 1 shows the MIPS-24 and IRAC-3.6 images for the 7 SMGs detected at 850m with S/N.
All 14 sources showing 850m emission above the level have 24m counterparts, although source 208 is only detected at about the 2.5– level at 24m. The detection of 24m counterparts associated even with the marginal 850m sources gives credence to the reliability of the SMG sources. In comparison for the 14 radio sources without SCUBA detections, only half have 24m counterparts. The detection of 24m counterparts for this sample of radio-selected SMGs is consistent with the high fraction of 24m counterparts found for the MAMBO and SCUBA sources in the Lockman Hole (Ivison et al. 2004; Egami et al. 2004).
Seven sources in the full sample do not have optical counterparts down to R mag, and only three are not detected by IRAC. The only source without any optical or IRAC counterpart is source 108 which is the brightest radio galaxy in the sample (likely a radio-loud AGN). Two sources (199 [] & 150 []) in the sample have spectroscopic redshifts from the ongoing Keck DEIMOS redshift survey (Choi et al. 2004). The low redshift of for the 850m source 199 implies a cool dust temperature of 20 K assuming a temperature dependent sub-mm to radio redshift relationship (Blain 1999).
3.2 Infrared Properties
The MIPS 24m flux densities for the galaxies detected at 850m are consistent with expectations, assuming standard ULIRG spectral energy distributions (SEDs) at the typical redshifts of –3 found for the SMG population (Chapman et al. 2003b; 2004). Figure 2 shows a range of S24/S(1.4GHz) flux density ratios for the population that may reflect a wide distribution of infrared colors. All of the galaxies showing 850m emission lie within the range of values expected for local ULIRGs redshifted to –4. Galaxies without 850m emission show a wider range of S24/S(1.4GHz) flux density ratios. About half of the radio sources without detectable 850m emission have properties consistent with ULIRGs, while the other half show excess radio emission compared to their 24m emission, consistent with different degrees of radio-loudness.
MIPS 70m observations can constrain the infrared colors of the SMGs. Infrared-warm, AGN dominated sources are expected to have flux density ratios of S70/S24 , while starburst dominated, infrared-cool sources are expected to have ratios of S70/S24 . We only detect two sources at 70m, both of which are cool in the infrared (source 1: S70/S24 and source 47: S70/S24 ). To derive an estimated average S70/S24 ratio for the SMG population, we coadded the 70m data at the radio positions for the sources showing 850m emission. We find an upper-limit of S70 mJy (). This corresponds to an infrared color of S70/S24 , leaving out the two sources with 70m detections. Including the two 70m detections, the average ratio for the SMG population is S70/S24 , which is slightly lower than expected if the population is dominated by star-formation. Taken at face-value, these results could suggest that many SMGs are infrared-warm AGN, contrary to previous conclusions that the population is dominated by star-formation. However, the lower than expected S70/S24 ratios may arise from strong 7.7m PAH emission redshifted into the 24m band, given that the median redshift for the SMG population is (Chapman et al. 2003b; 2004).
The SEDs in the IRAC bands can be used to estimate redshifts from the rest-frame 1.6m peak expected for star-forming systems (e.g., Egami et al. 2004) and to help identify AGN showing hot dust implied by their red IRAC colors (e.g., Ivison et al. 2004). For sources showing a significant bump in the IRAC bands, the implied redshifts are generally consistent (Column [11]&[12], Table 1) with the redshift estimates derived from the sub-mm to radio spectral index (Carilli & Yun 1999; Blain 1999). The discrepant photometric redshifts for sources 48&119 may indicate cool dust temperatures ( K) for these SMGs.
Of the sources with 850m emission and IRAC detections, only source 47 shows a strong increase in flux density as a function of wavelength across the IRAC bands consistent with an AGN. However, source 47 also has the highest S70/S24 ratio in the sample (S70/S24=26), suggesting that it is likely an infrared-cool starburst that could be at and/or be highly reddened due to dust extinction. Hence, IRAC colors are not always conclusive for determining the properties at longer infrared wavelengths.
3.3 Extremely Red Objects
A significant fraction of SMGs is comprised of extremely red objects (EROs) (Smail et al. 1999; Frayer et al. 2004a). The ERO definition of (Thompson et al. 1999) corresponds to a flux density ratio of S3.6/S(R). Using this criterion, we identify 8 EROs (Fig. 3). The 30% (8/27) fraction of EROs in this sample is larger than the 8% found for the total micro-Jy radio population (Smail et al. 2002), presumably since the SCUBA targets in this sample were generally selected on the basis of being faint and red in the optical bands. Figure 3 shows a wide range of IRAC colors for the SMG population, and no correlation is observed between the IRAC colors and the colors. Another interesting result is that most of the radio-selected EROs without detectable 850m emission (6/7) are bright at 24m, indicating that these sources are infrared-bright galaxies (likely high-redshift ULIRGs) below the current SCUBA detection limits.
4 Conclusions
All of the radio-selected SMGs in the sample have Spitzer counterparts, showing a wide range of infrared colors consistent with ULIRGs at –4. The combination of accurate radio positions and 24m detections is a powerful tool for the identification of SMGs. More sensitive observations are required in the MIPS-70 and MIPS-160 bands to measure the infrared colors of the SMG population. In addition, observations with the Spitzer InfraRed Spectrograph are needed to determine the level at which PAH emission contributes to the MIPS-24 flux densities and to help determine the AGN fraction of the population. In general, Spitzer selected ULIRGs will be biased toward AGN, except within specific redshift bins associated with the PAH features which may be biased toward starbursts.
We thank the staff at the JCMT and the Spitzer Science Center for their support of these observations. This work is based in part on observations made with the Spitzer Space Telescope, which is operated by the Jet Propulsion Laboratory, California Institute of Technology under NASA contract 1407.
References
- (1)
- (2) Alexander, D. M., et al. 2003, AJ, 125, 383
- (3)
- (4) Bertoldi, F., et al. 2000, A&A, 360, 92
- (5)
- (6) Blain, A. W. 1999, MNRAS, 309, 955
- (7)
- (8) Blain, A. W., Smail, I., Ivison, R. J., Kneib, J.-P., & Frayer, D. T. 2002, Physics Reports, 369, 111
- (9)
- (10) Carilli, C. L., & Yun, M. S. 1999, ApJ, 513, L13
- (11)
- (12) Chapman, S. C. et al. 2003a, ApJ, 585, 57
- (13)
- (14) Chapman, S. C., Blain, A. W., Ivison, R. J., Smail, I. R. 2003b, Nature, 422, 695
- (15)
- (16) Chapman, S. C., Blain, A. W., Ivison, R. J., Smail, I. R. 2004, ApJ, submitted
- (17)
- (18) Choi, P., et al. 2004, in preparation
- (19)
- (20) Condon, J. J., Cotton, W. D., Yin, Q. F., Shupe, D. L., Storrie-Lombardi, L. J., Helou, G., Soifer, B. T., Werner, M. W. 2003, AJ, 125, 2411
- (21)
- (22) Cowie, L. L., Barger, A. J., & Kneib, J.-P. 2002, AJ, 123, 2197
- (23)
- (24) Egami, E. et al. 2004, ApJS, this issue
- (25)
- (26) Fadda, D., Jannuzi, B., Ford, A., & Storrie-Lombardi, L. J. 2004a, AJ, in press (astro-ph/0403490)
- (27)
- (28) Fadda, D., et al., 2004b, in preparation
- (29)
- (30) Fazio, G. T., et al. 2004, ApJS, this issue
- (31)
- (32) Frayer, D. T., Armus, L., Scoville, N. Z., Blain, A. W., Reddy, N. A., Ivison, R. J., & Smail, I. 2003, AJ, 126, 73
- (33)
- (34) Frayer, D. T., et al. 2004b, in preparation
- (35)
- (36) Frayer, D. T., et al. 1999, ApJ, 514, L13
- (37)
- (38) Frayer, D. T., Ivison, R., J., Scoville, N. Z., Yun, M., Evans, A. S., Smail, I., Blain, A. W., &, Kneib, J.-P. 1998, ApJ, 506, L7
- (39)
- (40) Frayer, D. T., Reddy, N. A., Armus, L., Blain, A. W., Scoville, N. Z., & Smail, I. 2004a, AJ, 172 728
- (41)
- (42) Hughes, D., et al. 1998, Nature, 394, 241
- (43)
- (44) Ivison, R. J., Smail, I., Barger, A. J., Kneib, J.-P., Blain, A. W., Owen, F. N., Kerr, T. H., & Cowie, L. L. 2000, MNRAS, 315, 209
- (45)
- (46) Ivison, R. J., Smail, I., Le Borgne, J.-F., Blain, A. W., Kneib, J.-P., Bézecourt, J., Kerr, T. H., & Davies, J. K. 1998, MNRAS, 298, 583
- (47)
- (48) Ivison, R. J., et al. 2004, ApJS, this issue
- (49)
- (50) Knudsen, K. K., van der Werf, P. P., & Jaffe, W. 2003, A&A, 411, 343
- (51)
- (52) Lacy, M., et al. 2004, in preparation
- (53)
- (54) Marleau, F., et al., 2004, ApJS, this issue
- (55)
- (56) Morganti, R., et al., 2004, in preparation
- (57)
- (58) Neri, R., et al. 2003, ApJ, 597, L113
- (59)
- (60) Neugebauer, G., et al. 1984, ApJ, 278, L1
- (61)
- (62) Rieke, G., et al. 2004, ApJS, this issue
- (63)
- (64) Smail, I., Ivison, R. J., & Blain, A. W. 1997, ApJ, 490, L5
- (65)
- (66) Smail, I., Ivison, R. J., Kneib, J.-P., Cowie, L. L., Blain, A. W., Barger, A. J., Owen, F. N., & Morrison, G. 1999, MNRAS, 308, 1061
- (67)
- (68) Smail, I., Owen, F. N., Morrison, G. E., Keel, W. C., Ivison, R. J., & Ledlow, M. J. 2002, ApJ, 581, 844
- (69)
- (70) Thompson, D., et al. 1999, ApJ, 523, 100
- (71)


| (1) | (2) | (3) | (4) | (5) | (6) | (7) | (8) | (9) | (10) | (11) | (12) | (13) |
|---|---|---|---|---|---|---|---|---|---|---|---|---|
| Source | Position | S(1.4GHz) | S(850m) | S24 | -band | S3.6 | S4.5 | S5.8 | S8.0 | submm | IRAC | Notes |
| (J2000) (J2000) | (Jy) | (mJy) | (Jy) | (mag) | (Jy) | (Jy) | (Jy) | (Jy) | () | |||
| 1 | 17:18:12.9 +59:39:22 | a | ||||||||||
| 44 | 17:17:29.7 +59:54:29 | b | ||||||||||
| 48 | 17:17:33.7 +59:53:56 | |||||||||||
| 115 | 17:17:43.4 +59:48:03 | |||||||||||
| 119 | 17:17:12.7 +59:47:53 | c | ||||||||||
| 199 | 17:17:29.4 +59:41:13 | |||||||||||
| 208 | 17:18:10.9 +59:40:41 | |||||||||||
| 45A | 17:17:47.5 +59:54:24 | e | ||||||||||
| 47 | 17:17:22.5 +59:54:12 | c,f | ||||||||||
| 73 | 17:17:57.9 +59:52:00 | c | ||||||||||
| 139 | 17:18:23.2 +59:45:53 | |||||||||||
| 145 | 17:17:46.2 +59:45:17 | c | ||||||||||
| 156 | 17:18:16.8 +59:44:30 | |||||||||||
| 191 | 17:17:15.5 +59:42:02 | |||||||||||
| 75 | 17:18:01.7 +59:51:47 | c | ||||||||||
| 79A | 17:17:22.8 +59:51:30 | g | ||||||||||
| 85 | 17:18:12.3 +59:50:56 | |||||||||||
| 91 | 17:17:43.7 +59:50:22 | c | ||||||||||
| 99 | 17:17:06.4 +59:49:25 | h | ||||||||||
| 108 | 17:17:41.2 +59:48:36 | |||||||||||
| 109 | 17:17:38.5 +59:48:32 | |||||||||||
| 128B | 17:17:47.0 +59:47:12 | i | ||||||||||
| 155 | 17:17:56.0 +59:44:32 | |||||||||||
| 136 | 17:17:11.6 +59:46:21 | |||||||||||
| 146 | 17:18:12.9 +59:44:54 | |||||||||||
| 150 | 17:17:42.4 +59:44:56 | |||||||||||
| 198 | 17:17:21.4 +59:41:13 | c | ||||||||||
| 211 | 17:18:21.3 +59:40:27 | c |
Note. — (1)Radio source identifier. (2)Radio positions which are accurate to about . (3)Radio flux densities from the Westerbork and VLA data. (4)SCUBA 850m measurements. Sources 1–208 have 850m detections. Sources 45A–191 have 1.5–3 850m measurements, and sources 75–211 are non-detections at 850m. All flux density and magnitude limits are given as . (5)MIPS-24m measurements. (6)Optical -band magnitudes from NOAO 4m. (7)–(10)IRAC flux densities. (11)Photometric redshift estimate of based on the sub-mm to radio relationship of Carilli & Yun (1999), accounting for the degeneracy of redshift and dust temperature in the relationship (Blain et al. 1999). (12)Photometric redshift based on the assumed rest-frame 1.6m peak in the IRAC SED. (a)Measurements summed over all five components (Fig. 1). Source 1 is also detected at longer wavelengths with S70 mJy and S160 mJy. Sources not detected in the 70&160m MIPS-bands have limits of about & mJy, respectively. (b)Detected in IRAC-bands, but IRAC measurements are confused with nearby bright optical source. (c)ERO based on high S3.6/S(R) flux density ratio. (d)Spectroscopic redshift based on Keck DEIMOS data (Choi et al. 2004). (e)Brighter radio component 45A has 24m counterpart and is adopted as the primary counterpart, since 45B has no associated 24m source. (f)Detected in MIPS-70 with S70 mJy. (g)Brighter radio component 79A has a 24m counterpart and ‘merger-like” morphology with two optical components. (h)Source 99 has two optical components showing a merger-like morphology. (i)Neither radio component of source 128 has a 24m counterpart; 128B is adopted as the counterpart for flux density comparisons since there are no optical or IRAC counterparts associated with 128A.