PARSEC-SCALE X-RAY FLOWS IN HIGH-MASS STAR-FORMING REGIONS
Abstract
We present Chandra/ACIS images of several high-mass star-forming regions. The massive stellar clusters powering these HII regions are resolved at the arcsecond level into hundreds of stellar sources, similar to those seen in closer young stellar clusters. However, we also detect diffuse X-ray emission on parsec scales that is spatially and spectrally distinct from the point source population. For nearby regions (e.g. M17 and Rosette) the emission is soft, with plasma temperatures less than 10 million degrees, in contrast to what is seen in more distant complexes (e.g. RCW49, W51).
This extended emission most likely arises from the fast O-star winds thermalized either by wind-wind collisions or by a termination shock against the surrounding media. We have established that only a small portion of the wind energy and mass appears in the observed diffuse X-ray plasma; in the blister HII regions, we suspect that most of it flows without cooling into the low-density interstellar medium through blow-outs or fissures in the surrounding neutral material. These data provide compelling observational evidence that strong wind shocks are present in HII regions.
1 Introduction
Most stars in the Galactic disk form in high-mass star-forming regions (HMSFRs) where rich clusters containing thousands of stars are produced in massive molecular cores. X-ray surveys of HMSFRs are important because they readily discriminate young stars from unrelated objects that often contaminate images of such fields, especially for those young stars no longer surrounded by a dusty circumstellar disk. Radio observations opened up studies of embedded star formation, revealing ionized gas despite large absorbing columns.
Plasmas at keV and even MeV energies are prevalent in young stellar systems, where we find wind-generated X-rays in OB stars, magnetic flare-generated X-rays in pre-main sequence lower-mass stars, and shocks from OB winds and supernovae interacting with the ambient medium. These hot plasmas are critical drivers of galactic evolution, injecting energy and enriched material into the interstellar medium (ISM) through wind bubbles, supernova remnants (SNRs), superbubbles, and chimneys to the Galactic halo. HMSFRs are thus likely to exhibit a complicated mixture of pointlike and extended structures which are easily confused by low-resolution X-ray telescopes. Before the launch of the Chandra X-ray Observatory (Chandra, Weisskopf et al., 2002), the relative X-ray contributions of high-mass and low-mass stars, OB winds, and SNR shocks in these regions was largely unknown. Chandra, with its Advanced CCD Imaging Spectrometer (ACIS) camera (Garmire et al., 2003), starts a new chapter in star formation studies, finally giving us the sensitivity, spatial resolution, and broad bandpass to detect diffuse X-ray emission and to separate it from the hundreds of X-ray-emitting stars in HMSFRs.
The following section provides a brief overview of wind-blown bubbles and their effect on the classical definition of an HII region. We then describe our own Chandra observations of several HMSFRs and give some spectral characterizations of the diffuse X-rays seen there; we start with a review of M17, where the case for diffuse X-ray emission is clear. We continue with some preliminary images and spectra of RCW49, a southern HII region powered by a massive, condensed stellar cluster whose morphology in the radio and IR has been significantly altered by the presence of two Wolf-Rayet stars. We complete our simple survey with our Chandra data on W51A, a very massive, young star-forming complex in the Sagittarius Arm containing over 100 O stars and dozens of radio HII regions; we see diffuse and/or point-like X-ray sources associated with a large fraction of these radio HII regions. We then summarize the properties of diffuse X-ray emission in a variety of HMSFRs studied with Chandra and XMM-Newton and comment on future prospects for this field.
2 ISM Bubbles and Hollow HII Regions
The physics of the radiative ionization of HII regions worked out during the 1930-50s by Strömgren and others omitted the role of OB winds, which were not discovered until the 1960s (Morton, 1967). The winds play a small role in the overall energetics of HII regions but they dominate the momentum and dynamics of the nebula. The earliest O stars are subject to a large mass-loss (/yr, – km/s), converting several percent of the radiative luminosity into wind mechanical luminosity with ergs/s. A naive estimate shows that the thermalization of the wind should yield post-shock energies of several keV, with luminosities greatly exceeding that produced close to the star. In the seminal model of Weaver et al. (1977), an O star will create a “wind-swept bubble” with concentric zones: a freely expanding wind, a wind termination shock followed by an X-ray emitting zone, the standard K HII region, the ionization front, and the interface with the cold interstellar environment. Capriotti & Kozminski (2001) review the possible relationships between ionizing radiation and winds in HII regions. There was thus considerable reason to expect diffuse X-ray emission within HII regions excited by early O stars.
While a considerable literature exists on both the theory and observation of these X-ray emitting wind shocks close to the star, where ergs/s, the X-ray signature of the wind shocks on parsec scales where the K HII region appears had not been clearly seen before Chandra. A closer look at the interaction between the winds and the surrounding HII region shows that the problem is complex and still unresolved. One long-recognized problem was that the Weaver et al. model predicts a much larger size for the cavity than is observed. A recent kinematic analysis of the Rosette Nebula, for example, yields a characteristic age of a few yrs for the Rosette cavity, 100 times smaller than the age of the exciting stars (Bruhweiler et al., 2001). Perhaps the wind energy is dissipated in a turbulent mixing layer between an ionization-bounded HII layer and a hot, shocked stellar wind (Kahn & Breitschwerdt, 1990), or the OB winds are “mass loaded,” entraining interstellar gas and thereby weakening the terminal shock (e.g. Pittard, Hartquist, & Dyson, 2001). Another complication is that the winds from several OB stars may collide and shock before they hit the ambient medium (Cantó, Raga, & Rodríguez, 2000). These issues are also of great importance to our understanding of superbubbles and the dynamics of the interstellar medium on a Galactic scale.
We recently reported the Chandra discovery of diffuse X-rays in the Rosette Nebula and M17 (Townsley et al., 2003, hereafter Townsley03). Our study not only produced images of diffuse emission with the stellar sources removed, but made a physical characterization of the X-ray-emitting gas. For both Rosette and M17, we find a center-filled morphology with M⊙ of –9 MK plasma with density 0.1–0.3 cm-3 spread over several cubic parsecs. No heating, cooling, or shocks are seen, although our sensitivity to substructures is limited. In Rosette, the X-ray plasma fills the center of an annulus of K plasma, as predicted by Weaver et al. But in both regions the X-ray plasma represents only 4000 years of wind production and 20% of the wind kinetic energy, implying that most of the wind material and energy flows unimpeded away from the molecular cloud.
To gain more insight into the fate of OB winds in HII regions, we are in the process of obtaining and analyzing more Chandra observations of high-mass star-forming regions, with a range of ages, OB membership, and environments. As an introduction to some of our newer Chandra studies (on RCW49 and W51A), we begin with a short review of the Chandra results on M17 from Townsley03.
3 M17, The Omega Nebula
Perhaps the clearest example of diffuse X-ray emission in HMSFRs is our Chandra observation of M17, a bright blown-out blister HII region on the edge of a massive molecular cloud at a distance of 1.6 kpc, where pc. We summarize the Townsley03 results here because the edge-on geometry of M17 makes it clear that the diffuse soft X-rays are spatially distinct from the majority of the stellar X-ray sources; Chandra allows us to remove the point source contribution with very high precision, enabling us to characterize the hot, probably stellar wind-generated plasma flowing out of the HII region. Thus M17 is a straightforward case study that will help to explain the more complicated fields RCW49 and W51A.
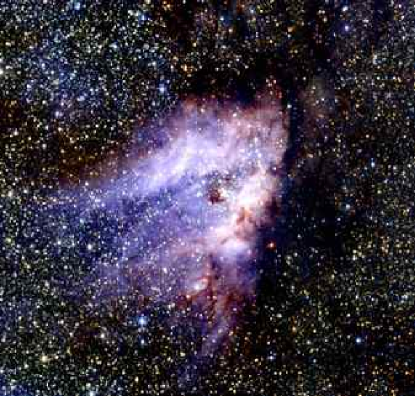
M17 is a strong thermal radio source, showing very high ionization. It has been called an edge-on version of the Orion K-L region; the expansion of the blister HII region is triggering star formation in its associated giant molecular cloud (GMC), which contains an ultracompact HII region, water masers, and the massive, dense core M17SW. M17 has 100 stars earlier than B9 (Orion has 8), with 14 O stars. Several of these O4/O5 stars are concentrated at the core of the stellar cluster and form what we call the Ring of Fire, in diameter. The age of the complex is estimated at Myr (Hanson, Howarth, & Conti, 1997). The ionization front of the HII region encounters the M17 GMC along two photodissociation regions, called the northern and southern bars. These are clearly seen in radio continuum data and in the 2MASS Atlas image (Figure 1), as is the Ring of Fire.
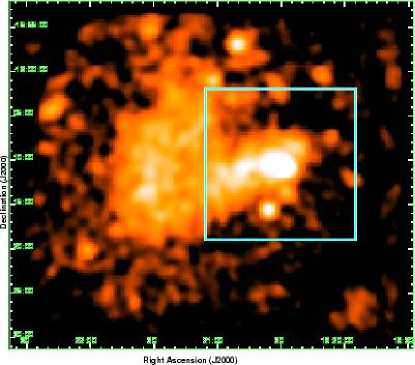
M17 was observed in 1993 with ROSAT, but the data were only recently published (Dunne et al., 2003). A smoothed image of the full-band (0.1–2.4 keV) ROSAT data is shown in Figure 2, with the smaller Chandra/ACIS field of view outlined in blue. Diffuse X-rays appear to flow away from the Ring of Fire, filling a region eastward of the HII region. ROSAT detected only 5 point sources associated with the M17 cluster; without higher spatial resolution, it is impossible to separate the stellar X-ray emission from diffuse emission generated by stellar wind collisions.
The Chandra observation (Figure 3) illustrates the significance of this problem. This 40-ksec ACIS observation reveals over 900 point sources in a field centered on the grouping of early O stars that we call the Ring of Fire. This point source emission dominates the observation, with three times the X-ray luminosity of the diffuse emission. The diffuse emission is spectrally distinct from the integrated point source emission (Figure 3) and is spatially concentrated eastward of the Ring of Fire, centrally filling the region delineated by the two bars seen in the 2MASS and radio data.
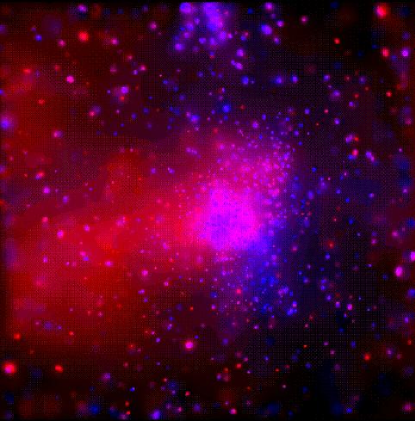
The M17 diffuse emission is adequately fit by a two-temperature thermal plasma model and a single absorbing column, with and 0.6 keV, cm-2, and a total intrinsic X-ray luminosity (corrected for absorption) of ergs/s. The composite point source spectrum, on the other hand, requires a much harder thermal plasma ( keV) and higher absorption ( cm-2) and is much brighter ( ergs/s); details are given in Townsley03.


The Chandra data confirm and clarify the impression from the ROSAT data that there is a hot plasma flowing out of the HII region, probably generated by wind-wind collisions between the massive stars in the Ring of Fire. Notably, we do not measure any significant temperature change in the plasma with position away from the O stars; this implies that the hot gas flows into the ambient ISM without substantial cooling. An additional hard plasma component may be present, spatially coincident with the highest concentration of X-ray point sources near the cluster center, but this may be a population of embedded, unresolved point sources. As will be demonstrated below, such a hard diffuse plasma component may be present in dense, massive, young clusters; if so, it indicates that an additional, more efficient process is at work to convert the wind kinetic energy into the thermal energy of the plasma.
4 RCW49 and Westerlund 2
RCW 49 is a prominent giant H II region, covering in the southern sky. Both point source and extended X-rays were detected by ROSAT and Einstein. Neither previous observation, though, had the spatial resolution to separate truly diffuse emission from the point source population.
RCW 49 is powered by Westerlund 2 (W2), an OB association containing at least a dozen OB stars: the earliest is an O6 star, there are 5 O7 stars, and two Wolf-Rayet (W-R) stars (Moffat, Shara, & Potter, 1991). The presence of these massive stars implies a cluster age of 2-3 Myr (Piatti, Bica, & Claria, 1998). The distance to RCW 49 is uncertain, with estimates in the range 1.9–7.9 kpc; here we adopt kpc (where pc).
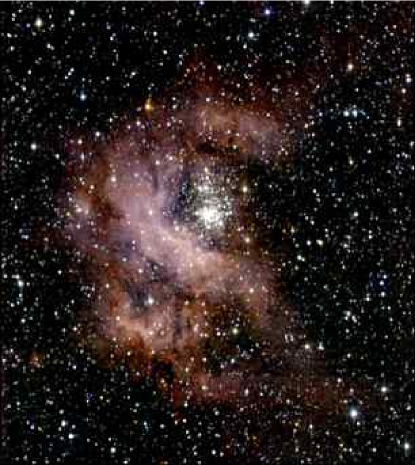
Radio continuum observations (Whiteoak & Uchida, 1997) revealed the presence of two wind-blown shells at the center of RCW 49. One of these is closed and is most likely blown by the W-R star WR20b. The other shell is centered on the OB association, but there is another W-R star (WR20a) in this region as well; because of its strong wind, it probably governs the dynamics of the shell. This shell shows a large blister extending to the west in the radio data. Figure 5 shows the 2MASS Atlas image of RCW49. The closed wind-blown shell associated with WR20b is clearly seen, southeast of the stellar cluster. The shell associated with W2 and WR20a appears closed on three sides, opening to the west.
ROSAT found 3 point sources associated with W2, plus diffuse emission pervading RCW49 (Belloni & Mereghetti, 1994). A smoothed image of our 36-ksec Chandra/ACIS-I observation of RCW49 is shown in Figure 6. Over 500 point sources are detected, including both W-R stars. Over 100 of those point sources are spatially coincident with the W2 cluster. Even though Chandra resolves much of the ROSAT extended emission into point sources, a diffuse component remains, centered on the ionizing cluster W2. This diffuse emission is not obviously associated with the W-R stars.
To give a clearer indication of the spectral variation across the ACIS field, we have generated an image of the spectral hardness (Figure 7). This image shows a pronounced area of soft diffuse emission extending eastward from W2 , a large expanse of slightly harder diffuse X-rays covering much of the lower half of the image, and patches of harder diffuse emission, possibly associated with clumps of point sources, to the north and west. The mixing of soft and hard point sources across the field indicates that sources lie both in front of and behind RCW49’s GMC.
The full-band smoothed ACIS-I image of RCW49 with its detected point sources outlined in green is shown in Figure 8; also shown are regions used for spectral fitting of the diffuse emission. The region used to make the diffuse spectrum is the magenta circle (with point source regions and the area outlined in red excluded); the background spectrum was obtained from the blue box. The background almost certainly contains diffuse emission as well as true background; we chose to suffer the loss of diffuse photons in our background-subtracted spectrum because the spectral background on the Galactic plane is complex and not well-represented by generic backgrounds taken from other parts of the sky. The region outlined in red was excluded from our sample of the diffuse X-ray emission because of its high point source density.
The background-subtracted spectrum and a model fit are shown in Figure 9. The model consists of three thermal plasma components and two absorbing columns; the very soft component ( keV) is absorbed by cm-2, while the two harder components ( keV) both require an absorbing column of cm-2. The hardest thermal component is not well-constrained by these data; a thermal plasma ( keV) or a power law () both give acceptable fits to the high-energy tail in the spectrum. In order to achieve an acceptable fit, we also had to add a gaussian component at 1.2 keV. The intrinsic luminosity (absorption-corrected, 0.5–8 keV) of the keV component is ergs/s; for the keV component we get ergs/s, while that of the keV component is ergs/s.

From Townsley03, we expect the intrinsic X-ray luminosity of diffuse emission to be roughly ergs/s per early O star for HMSFRs similar to Rosette and M17. W2 has 8 stars (including the two W-R stars) earlier than O7, so if our rough scaling holds we would expect the diffuse emission in RCW 49 to have an intrinsic luminosity of ergs/s. This is consistent with what we measure from the ACIS spectrum.
Despite the simplicity of this analysis, it does show that RCW49 is a very useful “transition” target, exhibiting in its diffuse X-rays both the soft spectral components seen in Rosette and M17 and a hard tail. The hard diffuse component may be related to the high concentration of stars in W2 – other dense clusters show a similar hard thermal plasma (e.g. NGC 3603, Moffat et al., 2002). Alternatively, if this hard tail is non-thermal, it may be the spectral signature of an embedded SNR, as suggested by Wolk et al. (2002) to explain the Chandra spectrum of diffuse X-rays in RCW38.
5 W51A
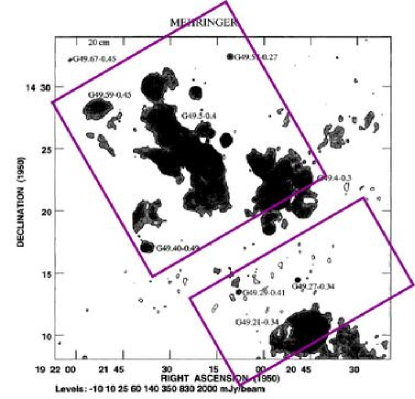
Few examples of true starburst activity in the Milky Way are accessible to observers, due to large distances and heavy obscuration in the molecular clouds that give birth to such regions. W51 is a remarkable example of such violent, high-mass star formation. W51A and B are large star-forming complexes at the tangent point of the Sagittarius arm, containing dozens of radio HII regions, from hypercompact to diffuse (Mehringer, 1994, see Figure 10). W51C is a very large composite SNR at kpc that may be physically associated with the W51 complex. W51 is one of the most luminous star-forming complexes in the Galaxy; its GMC is in the top 10% by mass and the top 1% by size (Carpenter & Sanders, 1998). The many HII regions contained in the W51 complex probably lie at a range of distances, from 5.5 to 7.5 kpc. At kpc, pc while for kpc, pc.
Okumura et al. (2000) estimate the stellar cluster ages in W51A to range from 0.4 to 2.3 Myr. The absorption towards these clusters is highly variable, with ranging from 5 to 40 magnitudes. Just the main complex in W51A, called G49.5-0.4, has 35 O stars (the earliest is an O4); two are supergiants. The IMF of this region appears to be top-heavy, with an excess of stars and an O-star formation rate times that of the famous HMSFR NGC 3603, called the Galactic analog to 30 Doradus. W51A may present an example of sequential star formation, where the winds from earlier epochs of star formation have compressed the intervening gas to trigger the violent star formation seen in the central part of G49.5-0.4.
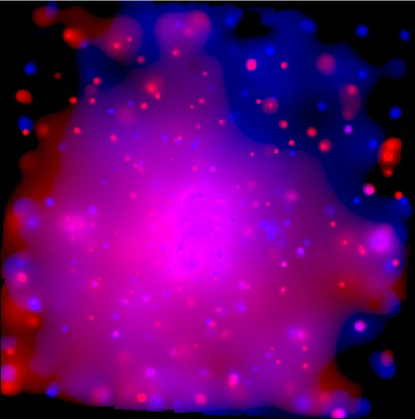
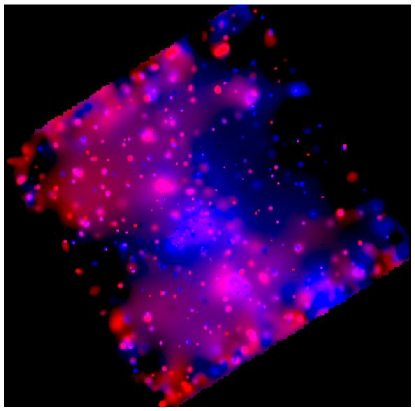
A two-color smoothed image of the 72-ksec ACIS-I observation of W51 is shown in Figure 11, centered on G49.5-0.4. Over 450 X-ray point sources are detected in this field, with over 100 of those in G49.5-0.4. Diffuse emission is associated with many of the known radio HII regions.
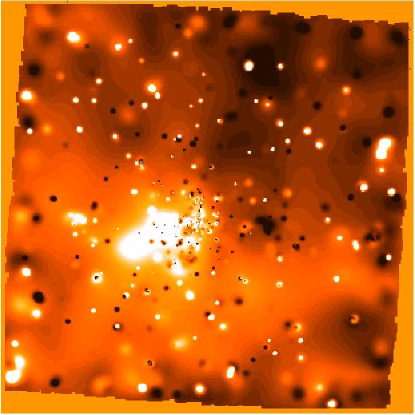
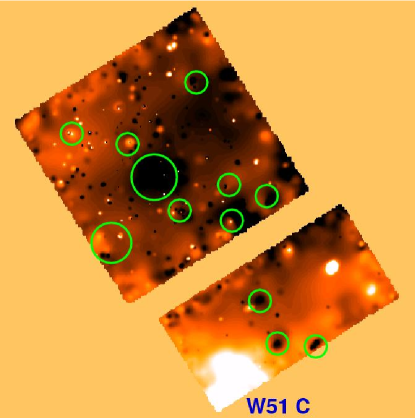
This diffuse emission is perhaps more easily seen in the hardness-ratio image of the ACIS data, Figure 12. Faint, hard diffuse emission may pervade much of the ACIS field. Several of the prominent radio HII regions are marked with green circles. This observation also serendipitously included the top part of the large SNR W51C, imaged far off-axis on the backside-illuminated CCD S3. It is seen as a soft (white) extended source at the bottom of this image. A small part of the W51B star-forming complex is also imaged on the off-axis CCDs.
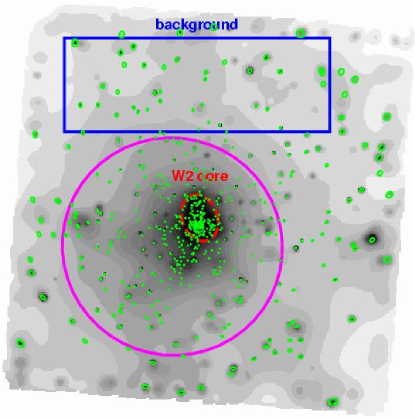
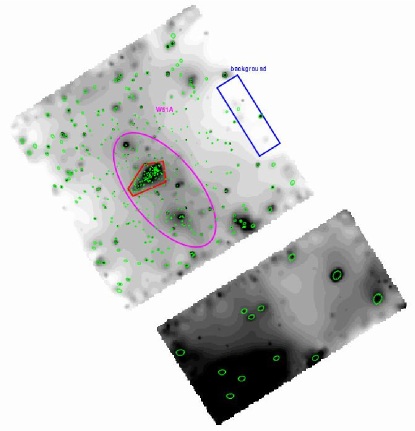
As a simple illustration of the spectral properties of the diffuse emission in W51A, we have extracted and fit the diffuse emission spectrum from G49.5-0.4. Figure 13 shows the full-band (0.5–8 keV) ACIS image of W51, with detected point sources outlined in green. The magenta ellipse shows the region used to extract the spectrum of the diffuse emission associated with G49.5-0.4; point sources were excluded, as was the entire region outlined by the red polygon, to minimize corruption to the diffuse spectrum from unresolved young stars in G49.5-0.4. The region used to estimate the spectrum of the background is shown by the blue rectangle. The background spectrum was scaled to match the geometrical and effective area of the diffuse emission sample before it was subtracted from the diffuse spectrum. We assume a distance of kpc for G49.5-0.4 (Kolpak et al., 2003).
The resulting background-subtracted spectrum and a fit with a two-temperature thermal plasma model are shown in Figure 14. The soft plasma component ( keV) has an absorbing column of cm-2 while the hard plasma component ( keV) requires cm-2. This hard component is not well-constrained by the data but, unlike for RCW49, a power law does not adequately fit the hard tail in the spectrum. Two gaussians (at 2.3 keV and 2.7 keV) were added to achieve an acceptable fit. As for M17 and RCW49, the need for these non-physical gaussian components is probably due to a combination of imperfect background subtraction and averaging over a large field with many different plasma components and absorbing columns. The intrinsic luminosity (absorption-corrected, 0.5–8 keV) of the keV component is ergs/s, while that of the keV component is ergs/s.

As with RCW49, this preliminary analysis of one HII region complex in W51A mainly serves to show that more detailed work is needed to sort out the various plasma components and absorption characteristics of this complicated field, although our work is more limited here due to small numbers of counts. Although the temperature of the hard plasma component is not well-constrained by these data, they do confirm that hard diffuse X-rays pervade HMSFRs when high concentrations of young, early O stars are present.
6 Diffuse X-rays from HMSFRs
Chandra has resolved diffuse emission from stellar populations in several Galactic high-mass star-forming regions. These are the first unambiguous detections of OB “windswept bubbles.” Table 1 (updated from Townsley03) summarizes these findings, including values from the literature as well as the results presented here. The luminosities in this table have been corrected for absorption. Diffuse emission is not seen in every HII region – apparently early and/or multiple O stars (but not necessarily W-R stars) are required to generate it. It remains unclear whether this emission can be generated by individual stars or only via wind-wind interactions.
| Region | Diffuse | kT | Reference | ||
|---|---|---|---|---|---|
| Area (pc2) | cm-2 | (keV) | ergs s-1 | ||
| Trifid Nebula | … | … | … | Rho et al. (2004) | |
| Orion Nebula | … | … | … | Feigelson et al. (2002) | |
| Eagle Nebula | … | … | … | Mytyk et al. (2001) | |
| Lagoon – NGC 6530 | … | … | … | Rauw et al. (2002) | |
| Lagoon – Hourglass | 0.04 | 11.1 | 0.63 | Rauw et al. (2002) | |
| Rosette Nebula | 47 | 2 | 0.06, 0.8 | Townsley03 | |
| RCW 38 | 2 | 9.5 | 0.2, | 1.6 | Wolk et al. (2002) |
| RCW 49 | 39 | 4, 12 | 0.1, 0.8, 3.1 or | 3.0 | this work |
| Omega Nebula | 42 | 4 | 0.13, 0.6 | 3.4 | Townsley03 |
| W51A (G49.5-0.4) | 88 | 10, 28 | 0.5, 6.9 | 4.5 | this work |
| Arches Cluster | 14 | 100 | 5.7 | 16 | Yusef-Zadeh et al. (2002) |
| NGC 3603 | 50 | 7 | 3.1 | 20 | Moffat et al. (2002) |
| Carina Nebula | 1270 | 3–40 | 0.8: | 200: | Seward & Chlebowski (1982) |
These results imply that the classical Strömgren Sphere model for HII regions is really better described as a “Strömgren Shell” in many cases, at least in those HII regions powered by O stars with strong winds. The X-ray flows we see may significantly affect HII region evolution and should be considered in models of HMSFRs. Such models should accomodate a range of X-ray plasma temperatures ( keV) and possibly even non-thermal emission (), a wide range of X-ray luminosities ( ergs/s), center-filled morphologies, and diffuse X-ray emission spread over several-parsec scales.
The X-ray luminosities that we report are lower limits to the true emission, due to geometry and obscuration. The Galactic Plane likely contains substantial soft X-ray emission from HMSFRs, far larger than what we are able to detect. X-ray flows from HII regions may contribute to galaxian features such as the Galactic Ridge emission, diffuse emission in galaxies, and starburst superwinds.
From Townsley03, we find that only a small portion of the wind energy and a tiny fraction of the mass appears in the observed diffuse X-ray plasma in M17. This energy could be dissipated via turbulence, mass-loading, fissures in the neutral material surrounding the HII region, or other processes. We expect to find similar results for the other HMSFRs we are studying, based on the preliminary X-ray plasma temperatures and luminosities presented here. The hard diffuse X-ray emission seen in RCW49, W51A, and other HMSFRs containing compact clusters implies that another, more efficient process is also at work in regions with many very young, closely spaced OB stars.
This very cursory overview of Chandra observations of HMSFRs neglects many interesting details of the data, not the least of which are the hundreds to X-ray point sources seen in every observation. There are many recent and upcoming observations of HMSFRs with both Chandra and XMM-Newton; our table of diffuse X-ray properties should almost double in length in the next year. We expect that our understanding of these fields will be similarly augmented.
Acknowledgments
Support provided by NASA contract NAS8-38252 to Gordon Garmire, the ACIS Principal Investigator. The 2MASS Atlas images were obtained as part of the Two Micron All Sky Survey (2MASS), a joint project of the University of Massachusetts and the Infrared Processing and Analysis Center/California Institute of Technology, funded by NASA and the NSF.
References
- Belloni & Mereghetti (1994) Belloni, T. & Mereghetti, S. 1994, A&A, 286, 935
- Bruhweiler et al. (2001) Bruhweiler, F., Bourdin, M., Freire Ferrero, R., & Gull, T. 2001, BAAS, 33, 1450
- Cantó, Raga, & Rodríguez (2000) Cantó, J., Raga, A. C., & Rodríguez, L. F. 2000, ApJ, 536, 896
- Capriotti & Kozminski (2001) Capriotti, E. R. & Kozminski, J. F. 2001, PASP, 113, 677
- Carpenter & Sanders (1998) Carpenter, J. M. & Sanders, D. B. 1998, AJ, 116, 1856
- Dunne et al. (2003) Dunne, B. C. et al. 2003, ApJ, 590, 306
- Feigelson et al. (2002) Feigelson, E. D. et al. 2002, ApJ, 574, 258
- Garmire et al. (2003) Garmire, G. P., Bautz, M. W., Ford, P. G., Nousek, J. A., & Ricker, G. R. 2003, Proc. SPIE, 4851, 28
- Hanson, Howarth, & Conti (1997) Hanson, M. M., Howarth, I. D., & Conti, P. S. 1997, ApJ, 489, 698
- Kahn & Breitschwerdt (1990) Kahn, F. D. & Breitschwerdt, D. 1990, MNRAS, 242, 209
- Kolpak et al. (2003) Kolpak, M. A., Jackson, J. M., Bania, T. M., Clemens, D. P., & Dickey, J. M. 2003, ApJ, 582, 756
- Mehringer (1994) Mehringer, D. M. 1994, ApJS, 91, 713
- Moffat, Shara, & Potter (1991) Moffat, A. F. J., Shara, M. M., & Potter, M. 1991, AJ, 102, 642
- Moffat et al. (2002) Moffat, A. F. J. et al. 2002, ApJ, 573, 191
- Morton (1967) Morton, D. C. 1967, ApJ, 147, 1017
- Mytyk et al. (2001) Mytyk, A. M., Daniel, K. J., Gagne, M., & Linsky, J. L. 2001, AAS Meeting, 199, 04.08
- Okumura et al. (2000) Okumura, S., Mori, A., Nishihara, E., Watanabe, E., & Yamashita, T. 2000, ApJ, 543, 799
- Piatti, Bica, & Claria (1998) Piatti, A. E., Bica, E., & Claria, J. J. 1998, A&AS, 127, 423
- Pittard, Hartquist, & Dyson (2001) Pittard, J. M., Hartquist, T. W., & Dyson, J. E. 2001, A&A, 373, 1043
- Rauw et al. (2002) Rauw, G. et al. 2002, A&A, 395, 499
- Rho et al. (2004) Rho, J., Ramirez, S., Corcoran, M. F., Hamaguchi, K., & Lefloch, B. 2004, ArXiv Astrophysics e-prints, astro-ph/0401377
- Seward & Chlebowski (1982) Seward, F. D. & Chlebowski, T. 1982, ApJ, 256, 530
- Townsley et al. (2003) Townsley, L.K., Feigelson, E.D., Montmerle, T., Broos, P.S., Chu, Y., & Garmire, G.P. 2003, ApJ, 593, 874
- Weaver et al. (1977) Weaver, R., McCray, R., Castor, J., Shapiro, P., & Moore, R. 1977, ApJ, 218, 377
- Weisskopf et al. (2002) Weisskopf, M. C., Brinkman, B., Canizares, C., Garmire, G., Murray, S., & Van Speybroeck, L. P. 2002, PASP, 114, 1
- Whiteoak & Uchida (1997) Whiteoak, J. B. Z. & Uchida, K. I. 1997, A&A, 317, 563
- Wolk et al. (2002) Wolk, S. J., Bourke, T. L., Smith, R. K., Spitzbart, B., & Alves, J. 2002, ApJ, 580, L161
- Yusef-Zadeh et al. (2002) Yusef-Zadeh, F. et al. 2002, ApJ, 570, 665