X-ray emission from the nuclei, lobes and hot-gas environments of two FR-II radio galaxies
Abstract
We report the detection of multiple components of X-ray emission from the two FR-II radio galaxies 3C 223 and 3C 284, based on new XMM-Newton observations. We attribute the detected X-ray emission from the lobes of both sources to inverse-Compton scattering of cosmic microwave background photons. With this model, we find that the magnetic field strength in the lobes is at the equipartition value for 3C 284, and within a factor of two of the equipartition value for 3C 223. We also detect group-scale hot atmospheres around both sources, and determine temperatures and pressures in the gas. The lobes of both sources are in pressure balance with the hot-gas environments, if the lobes contain only the synchrotron-emitting particles and the measured magnetic field strength. The core spectra of both sources contain an unabsorbed soft component, likely to be related to the radio jet, and an additional heavily absorbed power-law component. 3C 223 also displays a bright (EW 500 eV) Fe K emission line.
keywords:
galaxies: active – galaxies: individual: 3C 223 – galaxies: individual: 3C 284 – X-rays: galaxies1 Introduction
X-ray observations are providing answers to many long-standing questions about the dynamics and physical conditions of radio galaxies. Studies of radio-galaxy environments have revealed the influence of the hot-gas medium on radio-lobe structure and have shown that radio-source heating may be common (Kraft et al. 2003; Croston et al. 2003). Detections of X-ray synchrotron and inverse-Compton (IC) jets have constrained the electron population in the jets (e.g. Harris & Krawczynski 2002) and provided information about the locations of particle acceleration in low-power (FR-I) jets (e.g. Hardcastle et al. 2003). Measurements of IC emission from lobes and hotspots are providing information about the magnetic field strength and the relative contribution of particles and field to source dynamics (e.g. Brunetti et al. 2001, Hardcastle et al. 2002a; Isobe et al. 2002).
Prior to the availability of sensitive X-ray data, studies of radio-galaxy dynamics and source evolution were based almost entirely on measurements of radio synchrotron emission. As synchrotron emissivity depends on magnetic field strength as well as electron energy density, our knowledge of the physical properties of the sources has been limited. The assumption of equipartition of energy density between particles (relativistic electrons) and magnetic field has typically been used to obtain values for the physical properties of jets, lobes and hotspots. However, there are problems with this assumption. In particular, the internal radio-lobe pressures determined on this basis have been found to be significantly lower than the external pressures inferred from X-ray measurements in both FR-I and FR-II radio galaxies (e.g. Morganti et al. 1988; Worrall & Birkinshaw 2000; Hardcastle & Worrall 2000a), which is inconsistent with lobe expansion. Investigation of the validity of this assumption is therefore essential for a full understanding of the dynamics and evolution of radio galaxies.
X-ray IC emission has been detected from the lobes and hotspots of a number of radio galaxies (e.g. Harris et al. 1994; Hardcastle et al. 2001; Brunetti et al. 2001; Hardcastle et al. 2002a; Belsole et al. 2004). As this emission process does not involve the magnetic field, the X-ray IC flux can be used in combination with the radio synchrotron spectrum to determine the magnetic field strength of the emitting region. To date, detected lobe IC sources are typically found to be near to equipartition or in the particle-dominated regime, with magnetic fields , where is the equipartition value. However, the results are dependent on the parameters of the input electron energy spectrum used to model the radio synchrotron emission, and on the careful separation of thermal and non-thermal X-ray emission, so that estimates from different authors are often not directly comparable, and the overall picture remains unclear.
The study of lobe IC emission also has implications for the dynamics of radio galaxies. As defined above, the equipartition calculation assumes that the only particles in the radio lobes are the relativistic electrons (and positrons) responsible for the radio emission. If the lobes contain large contributions from additional particles, such as relativistic protons, then there is no physical reason for them to prefer magnetic field strengths close to the value of calculated for electrons only. Therefore, if observations show that sources are commonly found with , this suggests that the minimum-energy lobe pressures are correct and that there is no energetically dominant population of non-radiating particles. By combining observations of lobe-related emission and thermal emission from the surrounding medium, it is possible to test models of radio-source expansion.
It is therefore useful to find more examples of radio galaxies with lobe-related X-ray emission. In this paper, we describe new XMM-Newton observations of two powerful (FR-II) radio galaxies, 3C 223 () and 3C 284 (), and discuss the dynamics of the radio sources and their impact on their surrounding hot-gas environments.
We use a cosmology with H0 = 70 km s-1 Mpc-1, = 0.3, and = 0.7 throughout, which gives a scale of 2.4 kpc arcsec-1 at the distance of 3C 223, and a scale of 3.8 kpc arcsec-1 at the distance of 3C 284.
2 Data reduction and analysis
XMM-Newton observed 3C 223 in October 2001 and 3C 284 in December 2002. Both observations were made using the medium filter, and the pn data were taken in extended full frame mode. For 3C 223, the duration was 33903 s for the MOS 1 camera, 33917 s for the MOS 2 camera and 25849 s for the pn camera, and for 3C 284, the duration was 43066 s for MOS1, 43104 s for MOS2 and 35806 s for pn.
We reduced the data using the XMM-Newton Scientific Analysis Software (SAS) package, using methods described in the XMM-SAS Handbook. The data were filtered for good time intervals using a count-level threshold determined by examining a histogram of the count rate above 10 keV. For 3C 223, the threshold levels used were 4 cts/s for MOS1, 3 cts/s for MOS2, and 5 cts/s for pn; for 3C 284 they were 1.4 cts/s for MOS1 and MOS2 and 1.3 cts/s for pn. The data were then filtered using the flag bitmask 0x766a0600 for MOS and 0xfa000c for pn, which are equivalent to the standard flagset #XMMEA_EM/EP but include out of field-of-view events (useful for studying the particle component of the background) and exclude bad columns and rows. They were also filtered for patterns less than or equal to 12 for the MOS cameras and less than or equal to 4 for the pn, as suggested in the Handbook. The 3C 223 observation included several large background flares, so that the filtered data were of duration 23138s for MOS1, 24651 s for MOS2 and 12305 s for pn. The filtered 3C 284 data were of duration 41775 s for MOS1, 41496 s for MOS2 and 32095 s for pn.
Our images were created using software that interpolates over the XMM-Newton chip gaps (described in more detail in Croston et al. 2003) to avoid artefacts in smoothed images. We then adaptively smoothed the images using the ciao task csmooth for the purpose of better identifying contaminating point sources. The point sources were removed from the unsmoothed images using the ciao task dmfilth, and the region files retained for use in spectral analysis. None of the point sources coincided with the positions of the radio lobes, so that we cannot have accidentally removed any radio-related emission. The resulting images were smoothed using Gaussian kernels in order to show the distribution of extended emission, and also adaptively smoothed to show compact structure in the regions of extended emission. As the X-ray structure shown in the images is on-axis, we do not include the vignetting correction in the images. See Section 2.1 for a more detailed discussion of the vignetting correction.
Spectral analysis was performed using scripts based on the sas evselect tool to extract spectra from all three cameras. For the spectral analysis, we included the vignetting correction by using sas task evigweight, so as to be able to use on-axis response files downloaded from the XMM-Newton website rather than indivually generated responses for each spectrum and camera. We checked that there is no significant difference in the results we obtain with these response files and with files generated using rmfgen. We generated ancillary response files using arfgen. As the extraction regions are typically small and on-axis, we used local background subtraction, because this is likely to be a more accurate representation of the true background in the source regions than background spectra obtained from template files. The source and background spectra were scaled to account for differences in area using the sas task backscale, as evselect does not put this information in spectrum headers. Fig. 1 shows the choice of spectral regions for 3C 223 and Fig. 2 for 3C 284. We used xspec for spectral model fitting, and all of our fits assume Galactic absorption, with cm-2 and cm-2 (Dickey & Lockman 1990) for 3C 223 and 3C 284, respectively.
In order to search for extended emission that might be associated with a hot-gas atmosphere, we used radial surface-brightness profiling of the central regions. Software developed in earlier work (e.g. Birkinshaw & Worrall 1993; Hardcastle et al. 2002b) was used to extract and fit radial profiles. We fitted models obtained by convolving a point source with a -model to the surface-brightness profiles, and compared these with point-source only models to study the significance of any contribution from extended emission. For the point-source models we used the analytical description in the document XMM-SOC-CAL-TN-0022, obtained from the XMM-Newton website.
2.1 Issues with the vignetting correction and particle background
The inclusion of the vignetting correction has the effect of incorrectly weighting up unvignetted particle events. By examining the events in the region outside the field of view, we found that the contribution of particle events to the background is particularly high in these two datasets (between 30 and 50 per cent of events in the background spectra), so that these incorrectly weighted events could significantly affect our results.
For imaging the X-ray structure in our dataset, it is preferable not to include the correction, because the weighted-up particle events lead to bright regions at the edges of the image, particularly after smoothing. For spectral analysis, the correction is more important. However, our extraction regions are mainly on-axis, so that the weighting factor is typically quite small (always less than 20 per cent). We concluded that the effect of including the correction, which leads to a slight overestimation of the background level for spectral analysis, is less than the error introduced by not correcting the spectra, which would lead to an underestimation of the background level. Therefore, all of our spectral analysis was performed with the vignetting-corrected events list.
This compromise means that systematic errors are introduced into the background spectra at a level of per cent for 3C 223 and per cent for 3C 284. We compared corrected and uncorrected spectra for our largest extraction region for each source, and found consistent best-fitting spectral parameters, but a significant difference in the model flux. Where it could affect our conclusions, we calculated a systematic error in flux measurements by determining the fractional increase in background-subtracted source counts if the background is over-estimated by the amounts given above. These provide conservative upper limits on the flux values, as source counts are also slightly overestimated (always by less than 2 per cent, since the weighting factor is lower in the source regions).
We included the vignetting correction in the radial-profile analysis, for similar reasons as above. Since the low surface brightness of the extended emission leads to large uncertainties on -model parameters, the error introduced here by the weighted-up particle events is not significant.
3 Results
| 3C 223 | 3C 284 | |||
|---|---|---|---|---|
| Region | Counts | Area (arcmin2) | Counts | Area (arcmin2) |
| core | 3.1 | 0.35 | ||
| N/E lobe | 2.3 | 0.73 | ||
| S/W lobe | 2.0 | 0.75 | ||
| extended | 30417 | 17.9 | 33218 | 13.3 |
3.1 3C 223
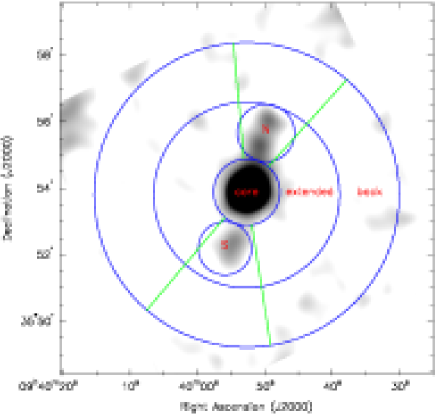
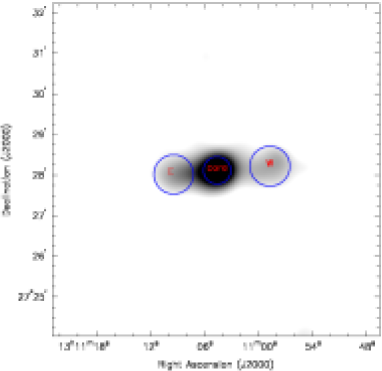
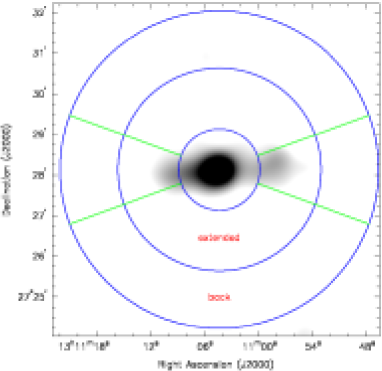
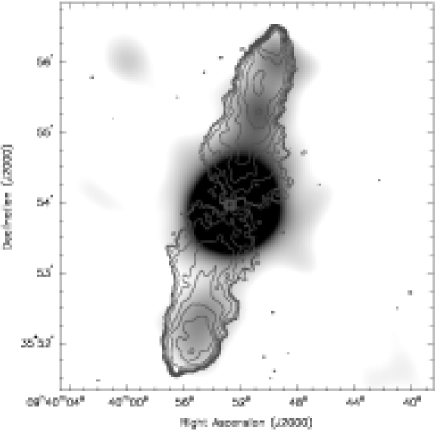
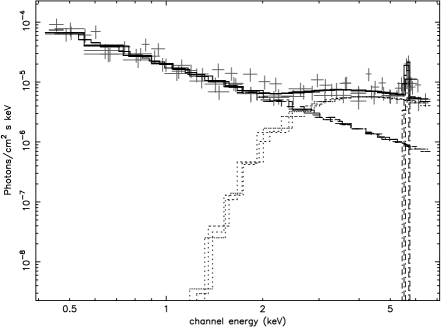


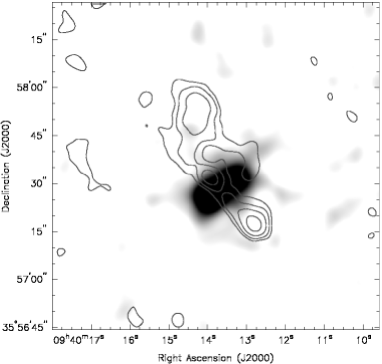
Fig. 3 shows a smoothed image of 3C 223 with radio contours overlaid. The most prominent features in the X-ray emission are the core and lobe-related emission. However, the extended region around the core suggests the presence of a hot-gas atmosphere.
We extracted spectra from the MOS1, MOS2 and pn files, as described above, to study the core and lobe emission. The choice of extraction regions is illustrated in Fig. 1, and the counts in each region are given in Table 1. We initially fitted the core spectrum with a single power law model, but this is an unacceptable fit ( of 179 for 70 d.o.f.), so that multiple components are needed. We fitted two multiple-component models to the continuum: Model I, consisting of a soft, unabsorbed power law, and a hard, absorbed power law; and Model II, consisting of a soft, thermal component with fixed abundance of 0.3 solar, and a hard, absorbed power law. In addition, to model residuals at around 6 keV, we included a redshifted Gaussian component of fixed linewidth 10 eV. We assumed Galactic absorption as given in Section 2. It was necessary to fix the power-law index of the hard component, so as to constrain the fit. We chose a value of 1.5, which is the expected value for IC nuclear scattering; however, the choice of does not significantly affect the fit. The best-fitting model parameters are shown in Table 2. Both models are good fits to the data, although Model I gives a slightly better fit statistic. The inclusion of the Gaussian component results in a significant improvement in the fit statistic. We performed an F-test for comparison with other results in the literature, which shows that the improvement is significant at 99.99 per cent confidence level; however, we note that, although commonly used, F-tests are not reliable for this purpose (Protassov et al. 2002). We allowed the linewidth of the Gaussian to vary and found a best-fitting value of eV, which is slightly larger than, but consistent with the expected pn spectral resolution at this energy, so that there is no strong evidence for broadening of the line. We measured a rest-frame equivalent width for the 6.4 keV line of 517 eV. Fig. 4 shows Model I fitted to the MOS1, MOS2 and pn spectra. We discuss the physical origin of the model components in Section 4.1.
| Model component | Parameter | Model I | Model II |
|---|---|---|---|
| Soft, unabsorbed power law | |||
| Unabsorbed flux (0.3 – 7 keV) | |||
| Soft mekal | (keV) | ||
| Unabsorbed flux (0.3 – 7 keV) | |||
| Nuclear column density | (cm-2) | ||
| Hard, absorbed power law | 1.5 (frozen) | 1.5 (frozen) | |
| Unabsorbed flux (0.3 – 7 keV) | |||
| Gaussian () | Energy(keV) | ||
| Line width (eV) | 10 (frozen) | 10 (frozen) | |
| Unabsorbed flux (0.3 – 7 keV) | |||
| 85/80 | 81/80 |
We then studied the emission associated with the radio lobes of 3C 223, regions N and S in Fig. 1. We initially fitted the lobe spectra with mekal and power-law models. The parameters for these fits are shown in Table 3. The models are equally acceptable fits to the data, but the best-fitting temperatures for the thermal models are high. As we have used local background subtraction, the spectra should not be contaminated by emission from the hot-gas environment. We adopt the power-law models, which seem more physically plausible than the hot mekal models; however, we discuss an interpretation based on the mekal fits in Sections 4.2 and 4.5. For the power-law model, the unabsorbed 1-keV flux densities are nJy and nJy for the north and south lobes, respectively. We discuss models for the lobe emission in further detail in Section 4.2.
We used radial surface-brightness profiling to search for extended emission around the radio sources. As there are insufficient counts in the two MOS cameras to fit a profile successfully, we used only the pn events file for this analysis. We extracted the counts in annuli centred on the source, excluding angles where lobe emission is present as marked in Fig. 1. Fig 5 shows the profile with a point-source model (left) and with this plus an additional -model component (right). The inclusion of the -model component results in an improved fit. To determine the statistical significance of the improvement, we carried out Monte Carlo simulations using the PSF model for the pn camera and counting statistics. We then fitted the two models to the fake datasets and determined the F-statistic for each set of fits; these were compared with the measured value of F (28.5). We find a less than 1 per cent probability that the improvement in the fit could occur by chance. The best-fitting -model parameters are and = 140 arcsec, but the parameters are very poorly constrained, so that a very good fit can be obtained for any plausible lower value of .
To confirm the presence of extended emission and investigate its nature, we extracted spectra from an annulus of inner radius 60 arcsec and outer radius 167.5 arcsec using the radial profiles to determine the location of the expected extended emission, and excluding the angles where the radio lobe emission is present and several point sources not associated with the radio source. The radial profiles for 3C 223 show that we expect a significant fraction of the flux in our extraction region to be scattered emission from the point source. From the encircled energy fraction information in the PSF document described in Section 2, we would expect 7 per cent of the core spectrum to be scattered into the extraction annulus. The energy dependence of the PSF is not important at these radii and so the scattered spectrum will not be significantly altered. We therefore included fixed components in the model for the extended spectrum, corresponding to our adopted core model described above, and normalised to 7 per cent of the core counts. We then fitted the temperature and normalisation of a mekal component with 0.3 solar abundance, holding the core components fixed. Table 4 shows the best-fitting mekal parameters for the mekal plus scattered point-source model. The unabsorbed fluxes of the extended and scattered point-source components (not given in the Table) are roughly consistent with the ratios shown in the radial profile. We estimated the systematic error caused by incorrectly weighted particle events, as described in Section 2.1. In this case it is very large ( per cent), due to the small number of source counts relative to background in the region; however, even a factor of 3 increase in flux does not affect our later analysis and conclusions, as shown in Section 4.4.
3.1.1 Nearby quasar
Our radio map for 3C 223 shows a small double-lobed radio source 5.6 arcmin to the north-east of the source, at (J2000) RA , Dec . We find a bright X-ray source at that position in our XMM-Newton data. Fig. 6 shows the radio contours overlaid on a Gaussian smoothed image of the combined MOS1, MOS2 and pn X-ray data. We extracted a radial profile of the X-ray data, which shows that it is consistent with being a point source. We extracted an X-ray spectrum in a circle of radius 47 arcsec, and find a good fit to the spectrum ( for 19 d.o.f.) with a power-law model, having photon index . We measure a 0.3 - 7.0 flux of ergs cm-2 s-1 (1-keV flux density of 7.20.7 nJy).
This X-ray source was previously detected with ROSAT and an optical identification with a star was made (Mason et al. 2000). However, the star is offset by 20 arcsec from the X-ray and radio source. We obtained the DSS2 images for this field, and find that in additional to the star of the previous optical identification, there is a faint object at exactly the position of the X-ray source in the blue image, but none in the red. We therefore conclude that the X-ray source was previously misidentified, and is in fact a distant quasar.
| 3C 223 | 3C 284 | ||||
|---|---|---|---|---|---|
| North | South | East | West | ||
| Power law (I) | 1.40.3 | 1.00.5 | 2.10.3 | 1.20.6 | |
| 1-keV flux density (nJy) | 3.10.5 | 3.00.5 | 1.90.2 | 0.9 | |
| (dof) | 11 (9) | 6 (5) | 3 (8) | 2 (2) | |
| mekal (II) | (keV) | 5 | 6 | 2.3 | 3 |
| 0.3 – 7.0 keV flux (ergs cm-2 s | 3. | 3.7 | 1 | 1 | |
| (dof) | 11 (9) | 6 (5) | 5 (8) | 2 (2) | |
| (keV) | 1.4 |
|---|---|
| Flux in model (0.3 – 7.0 keV) | ( |
| Luminosity in model (0.3 – 7.0 keV) | |
| (dof) | 4.5 (7) |
| Bolometric total luminosity |
3.2 3C 284
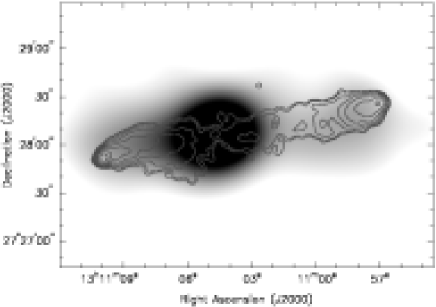
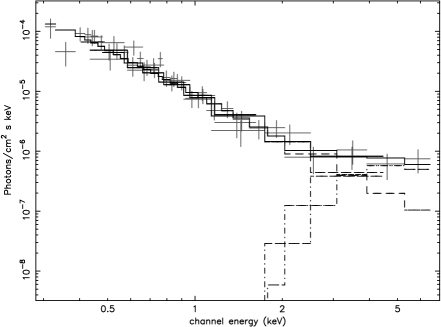
In Fig. 7, we show an adaptively smoothed image of the X-ray emission associated with this source, with radio contours overlaid. As with 3C 223, the most prominent X-ray features appear to be associated with the core and radio lobes. We studied core and lobe spectra and used radial surface-brightness profiling to search for extended emission, as above. Fig. 2 shows our choice of extraction regions. For this source, we used a smaller core extraction circle, so as to avoid contamination from the lobe emission. We fitted a single power-law model, as well as two multiple-component models as for 3C 223. For the soft mekal plus hard, absorbed power-law model (similar to Model II for 3C 223), we found that the column density tended to zero, so that we instead fitted a mekal plus unabsorbed power law. Table 5 gives the best-fitting parameters for the three models. Model I is a single power-law fit, Model II a soft power law plus hard, absorbed power law (similar to Model I for 3C 223), and Model III is a mekal plus power-law model. All three models are accpetable fits to the data, although II and III give lower values of . The best-fitting temperature for Model III is much lower than that of the extended atmosphere (see later), and the luminosity is much higher than would be expected if it was simply the inner regions of the extended environment. We therefore adopt Model II. The spectrum with this best-fitting two power-law model is shown in Figure 8. There are insufficient counts at high energies to determine whether there are any emission lines.
| Model component | Parameter | Model I | Model II | Model III |
|---|---|---|---|---|
| Soft, unabsorbed power law | ||||
| Unabsorbed flux (0.3 - 7.0 keV) | ||||
| Soft mekal | (keV) | |||
| Unabsorbed flux (0.3 - 7.0 keV) | ||||
| Nuclear column density | NH (cm-2) | ( | ||
| Hard, absorbed power law | 1.5 (frozen) | |||
| Unabsorbed flux (0.3 - 7.0 keV) | ||||
| 41/40 | 33/38 | 32/38 |
As was done for 3C 223, we fitted the lobe-region spectra with single mekal and power-law models. For the eastern lobe, the power-law model is a slightly better fit (see Table 3); however, for the western lobe, both models fit adequately. We discuss interpretations based on each model in Section 4. For the power-law model, we measured 1-keV flux densities of 1.90.2 nJy and 0.9 nJy for the east and west lobes, respectively. Table 3 shows the best-fitting parameters for the lobe emission models.
Radial profiles for 3C 284 are shown in Fig. 5. The profiles were extracted from the pn events file, excluding the position angles where there is lobe emission, and excluding point sources. We show both point-source and point-source plus models. The inclusion of the -model component produces a significant improvement in the fit. The best-fitting -model parameters are and = 56 arcsec; however, the parameters are poorly constrained, so we do not quote errors. We used the same method as for 3C 223 to examine the significance of the inclusion of a -model component, and find there is a less than 1 per cent probability of such an improvement (F = 45.7) occurring by chance.
To study the extended emission in the regions identified by the radial profiles, we extracted spectra from an annulus of inner radius 60 arcsec and outer radius 150 arcsec excluding the angles where the radio lobe emission is present and any contaminating background point sources. We fitted the spectra with a single mekal model, as the radial profile (Fig 5) shows that the emission in our extraction region is dominated by the atmosphere. The best-fitting mekal parameters are shown in Table 6. As with 3C 223, the systematic error from incorrectly weighted particle events is high, per cent, since the ratio of source to background counts is low. This does not have a significant effect on our later conclusions, as shown in Section 4.4.
| (keV) | 1.03 |
|---|---|
| Flux in model (0.3 – 7.0 keV) | |
| Luminosity in model (0.3 – 7.0 keV) | |
| /n (dof) | 11 (13) |
| Bolometric total luminosity |
4 Discussion
4.1 Nuclear spectra
The two models we fitted to the nuclear spectrum of 3C 223 lead to two physical explanations for the soft emission from the core. If we adopt Model I, the soft power-law component of the nuclear spectrum could be associated with the base of the radio jet, as it must originate outside the dusty material obscuring the second component. Hardcastle & Worrall (1999) report a correlation between radio and X-ray core flux based on ROSAT measurements, which suggests that a large fraction of the soft X-ray core flux may be associated with the small-scale radio jets. Our measured flux from the primary power law is in agreement with the Hardcastle & Worrall relation. If we adopt the slightly better fit of Model II, then the thermal material has a temperature consistent with the extended thermal atmosphere; however, its luminosity is too high for this to be its origin. For 3C 284, a two-power law model, similar to Model I for 3C 223, is preferred. Therefore we can explain the nuclear spectra of both sources with a radio-related soft power-law and an absorbed, hard nuclear power law. Our results are consistent with those found for the nuclear spectrum of Cygnus A (Young et al. 2002), although they find a slightly better fit with a thermal origin for the soft emission, and also consistent with other radio-galaxy nuclear spectra (e.g. Hardcastle et al. 2002a; Belsole et al. 2004).
As discussed in Section 3.1, for the core spectrum of 3C 223, we find strong evidence for a redshifted 6.4-keV line in all three cameras. Although we find a best-fitting line width of eV, the spectral resolution of the XMM cameras (e.g. 130 eV FWHM at 6.4 keV for the pn camera) is comparable to this value, so that there is no evidence for line broadening. Our measured equivalent width of 517 eV is within the range of measured values for powerful radio galaxies ( 100 – 1500 eV; see e.g. Sambruna et al. 1999). However, only 4 objects in their sample out of 39 (3 broad-line objects, and one narrow-line radio galaxy) have equivalent widths greater than 450 eV. 3C 223 is a narrow-line radio galaxy, and the majority of iron-line detections in FR-IIs have been in broad-line radio galaxies, where the source geometry is expected to be similar to that of quasars. However, the brightest iron line so far detected (in 3C 321: EW 1510 eV, Sambruna et al. 1999) is in a narrow-line object. Ptak et al. (1996) present theoretical predictions for the relation between equivalent width and column density of material in which the fluorescence is occuring, for several models of source geometry. The column density of absorbing material we find to be obscuring the second power-law component in our core spectra is 1023 cm-2, so that our results are roughly consistent with the relations described in Ptak et al. (1996). The most plausible explanation for the bright iron line in 3C 223 is that we are seeing fluorescence of cold gas in a thick torus obscuring the nucleus of 3C 223.
4.2 Lobe emission from the two radio galaxies
In neither source was the spectral fitting able to distinguish between the power-law and mekal models for the lobe-related emission. For 3C 223, the best-fitting mekal temperatures are high, and in both cases they are poorly constrained. One possible origin for such hot gas would be in a model where the supersonic lobe expansion is shock-heating the environment. We discuss the arguments for and against this model in Section 4.5, but in the remainder of this Section we adopt the single power-law model for the lobes of both sources, assuming the X-rays to be radio-related.
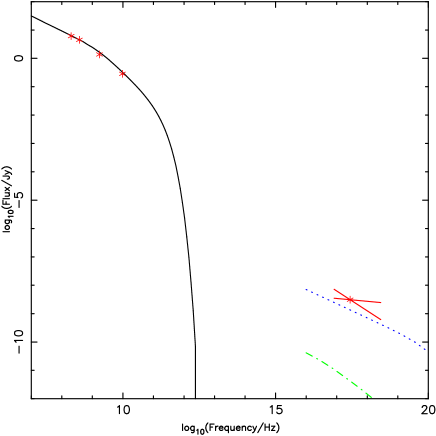
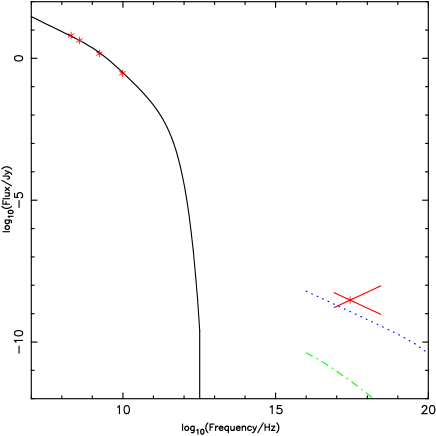
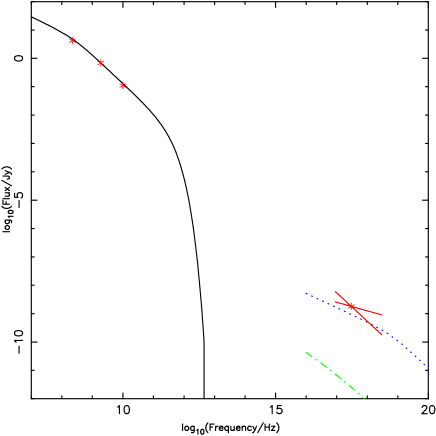
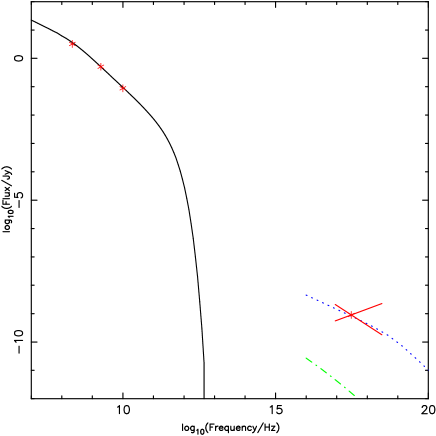
In Fig. 9, we plot the radio-to-X-ray spectra for the two radio lobes of each source with an equipartition inverse-Compton model determined using the code of Hardcastle et al. (1998). Radio fluxes were obtained at 1.5 and 8 GHz from maps of Leahy & Perley (1991), and Hardcastle et al (1998). The average of the fraction of the total flux in each lobe at the two measured frequencies was used to determine 178-MHz fluxes from the 3CRR fluxes (Laing, Riley & Longair 1983). For 3C 223, we also included 330 MHz fluxes from data obtained from the VLA archive and reduced in the standard manner. A synchrotron spectrum was fitted to the radio data with an inital energy index of 2, minimum energy of eV, maximum of eV, and break of 1 in energy index at an energy of eV for 3C 223 and eV for 3C 284, assuming a filling factor of unity. The spectral break parameters were chosen so as to obtain a good fit to the radio data. The synchrotron models and predicted inverse-Compton fluxes for each lobe from cosmic microwave background (CMB) photons and from synchrotron self-Compton (SSC) emission, are shown in Fig. 9.
The equipartition magnetic field strengths (assuming no relativistic protons) were determined from the synchrotron model above to be 0.35 nT for both the north and south lobes of 3C 223, and 0.5 nT for the east and west lobes of 3C 284, respectively. Fig. 9 shows that in all cases the measured flux is fairly close to the value predicted for inverse-Compton scattering of CMB photons by an electron population at equipartition. If the measured X-ray flux values are used to determine the value for , the magnetic field strength, we obtain values of 0.22 nT and 0.20 nT for the north and south lobes of 3C 223, which are within a factor of two of the equipartition values. In 3C 284, the measured magnetic field strength is 0.4 nT for the eastern lobe, and the same as the equipartition value for the western lobe.
| (degrees) | 1-keV flux density (nJy) | |
|---|---|---|
| 90 | 0.053 | 0.046 |
| 105 | 0.068 | 0.060 |
| 120 | 0.074 | 0.068 |
| 135 | 0.068 | 0.062 |
The X-ray emission from the eastern lobe of 3C 284 is brightest near the core and decreases slightly with radius out to a distance of 45 arcsec (170 kpc), whereas the radio emission increases with distance. This could be explained if there was a significant contribution to the X-ray emission from inverse Compton scattering of a nuclear photon field (e.g. Brunetti et al. 1997). In addition, the X-ray to radio ratio in the eastern lobe is higher than in the western lobe (they differ at 2 level), which could be explained by the anisotropy of IC emission, which leads to more emission in the direction towards the illuminating source, if the eastern lobe is the more distant one. We therefore computed the expected flux from IC scattering by the eastern radio lobe of infrared and optical photons from a hidden quasar, using the results of Brunetti (2000) as described by Hardcastle et al. (2002a). The electron energy population was modelled in the same way as for the SSC and CMB calculations above; however, the calculations were repeated for a low-energy cutoff, , of 10 to include electrons of sufficiently low energy to scatter the optical photons to the X-ray region. The illuminating point source was modelled using the SED of the quasar 3C 273 (of similar radio luminosity and redshift to 3C 284). We used flux density measurements at 180 (Meisenheimer et al. 2001), 1 (Spinoglio et al. 1995), and U-band (Neugebauer et al. 1979) to parametrize the infrared to optical spectrum. We performed the calculation for angles to the line-of-sight of 105, 120 and 135 degrees to determine the maximum possible contribution to the X-ray flux. The results of the calculations are given in Table 7. The highest flux value of 0.074 nJy is obtained for an angle of 120 degrees and , so that for all choices of angle to the line-of-sight the total contribution from nuclear IC to the X-ray flux is less than 5 per cent of the observed flux. In this best-case scenario, the ratio of observed to predicted IC flux for the eastern and western lobes agree at the 2 level. We therefore conclude that there could be some contribution from nuclear IC emission to the eastern lobe; however, the dominant photon population comes from the CMB. The contribution from nuclear IC emission in the case of 3C 223 is expected to be even less, as the radio luminosity is lower by a factor of three, and the X-ray emission follows the radio structure more closely, as expected in the CMB model.
4.3 Group atmospheres
For both 3C 223 and 3C 284, the combination of spectral analysis and radial profile analysis leads to an unambiguous detection of an extended atmosphere. 3C 284 possesses a group-scale atmosphere (LX ergs s-1) with a temperature of 1 keV. This temperature is close to that expected for a group of this luminosity from the LX/T relation for radio-quiet groups (Croston et al. 2003). We also produced a hardness-ratio map for 3C 284, but there was no evidence for hotter gas around the lobes; due to the small number of counts from the environment, it was not possible to separate the harder lobe emission from any hot gas emission near the lobe edges.
3C 223 has an atmosphere of luminosity ergs s-1, giving an expected temperature of 1.2 keV. This is consistent with the measured temperature of keV. As with 3C 284, there are insufficient counts to establish whether or not there are temperature variations in the atmosphere. We conclude that there is no evidence for large-scale heating due to the radio source in the atmosphere of either source.
4.4 Pressure balance
| Pint/Pa | Pext (midpoint)/Pa | Pext/Pa (end) | Rmid | Rend | |
|---|---|---|---|---|---|
| 3C 223N | 4.0 | 0.13 | 0.42 | ||
| 3C 223S | 5.3 | 0.17 | 0.55 | ||
| 3C 284E | 8.3 | 0.6 | 1.3 | ||
| 3C 284W | 6.0 | 0.6 | 1.6 |
We determined internal lobe pressures from the radio-synchrotron models described in Section 4.2, above, assuming an electron filling factor of unity, and that the only contribution to pressure comes from the population of relativistic electrons producing the synchrotron emission. We used the magnetic field strengths given above calculated based on the measured IC flux. We then calculated the external pressure on the lobes from the X-ray-emitting gas using the the best-fitting thermal models for the extended emission described in Section 4.3, above. We used the results of Birkinshaw & Worrall (1993) to determine pressure as a function of radius from the emission measure and the -model fit parameters. For each source, we determined the pressure halfway along the lobes, and at the ends of the lobes. For 3C 284, we did the pressure calculation separately for each lobe as they are asymmetrical in length.
Internal and external pressures for each source are given in Table 8. The errors we quote for pressures are based on the errors on the best-fitting -model parameters, which are the main contribution to uncertainty in the pressure. We assume that is between 0.35 and 2, as the fits are poorly constrained. For 3C 223, the factor of three uncertainty in the flux from the atmosphere leads to a per cent increase in the pressure values (not included here), which does not significantly affect our conclusions below about pressure balance. For 3C 284, the factor of three uncertainty in the flux from the atmosphere leads to a 50 – 70 percent increase in the pressure values (not included here). As for 3C 223, this does not significantly affect the conclusions.
Table 8 shows that 3C 223 is consistent with being in pressure balance at the ends of the source, but likely to be underpressured at the midpoint. For 3C 284 there is also approximate pressure balance at the ends of the source, and at the midpoint the lobes are underpressured by a factor of 2. These results suggest that self-similar models of radio-source expansion (e.g. Falle 1991; Kaiser & Alexander 1997; see also a discussion of these models in Hardcastle & Worrall 2000a), which require that the entire source be overpressured, no longer apply to these sources. 3C 223 and 3C 284 are comparatively large sources, so that it seems plausible that they have reached a stage of expansion where the inner parts of the sources are now underpressured. The outer parts of the source are still expanding, but the lateral expansion is now subsonic. Further support for this model comes from the radio structure of the two sources, which have a ”pinched” appearance in the central regions. Gas that was intially pushed out by lobe expansion may now be falling back in and crushing the central part of the cocoon.
If we instead adopt the second interpretation of the lobe emission – that it is thermal in origin, and hot – then the lateral expansion of the lobes must be supersonic and overpressured, so as to produce shock-heated gas surrounding the entire lobes. In this scenario, since all of the X-ray flux from the lobes is attributed to hot gas, the level of IC emission from the lobes must be much lower than the values we used in Section 4.2. This means that the lobes must either be magnetically dominated, so that the pressure for supersonic expansion comes from the magnetic field, or else contain a dominant proton or other non-radiating particle contribution. This interpretation requires two coincidences: an X-ray flux which happens to be at the level expected for the minimum energy condition in the absence of protons, and that the minimum energy condition happens to correspond to an internal pressure approximately in balance with the pressure from the surrounding hot gas.
We therefore consider that the IC model for the lobe emission is far more plausible. However, in the following section, we discuss the constraints that our results have placed on models that require overpressured lobes.
4.5 Constraints on supersonically expanding lobes
In order for supersonic lateral expansion of the lobes, they must either be magnetically dominated, or dominated by non-radiating particles, as described above. The lobes of low-power (FR-I) radio galaxies do require a large contribution from one of these constituents; however, it seems likely that much of the additional pressure in FR-Is comes from material entrained into the lobes as the jets decelerate (e.g. Bicknell 1984, Laing & Bridle 2002). In FR-IIs, where entrainment is not thought to be an efficient process, a different explanation is probably necessary if the lobes are required to be overpressured. It is therefore tempting to accept the self-consistent model we proposed in the previous section, in which the two sources are at equipartition and in approximate pressure balance, so as to avoid requiring this additional explanation. Nevertheless, we briefly consider possible pressure contributions to FR-II lobes in the following paragraphs, both to constrain supersonically expanding models, and since our upper limits on external pressure for 3C 223 leave room for a large contribution from other particles in that source.
Constraints on the amount of cold gas and a subrelativistic tail to the electron population can be obtained by examining the limits on Faraday depolarization. For 3C 284, Leahy, Pooley & Riley (1986) report only slight depolarisation between 11 and 18cm. To investigate whether 3C 223 showed evidence for internal or external depolarization we retrieved VLA data from the public archive. The low-frequency data were from 1.5-GHz observations in the VLA B and C configurations, described by Leahy & Perley (1991), while the high-frequency data we used were from the two-pointing 8.4-GHz observations at C and D configuration described by Leahy et al. (1997). The total and polarized intensities were compared within a fixed contour (the 5- level of the 8.4-GHz total intensity map). For both lobes the degree of polarization was essentially identical (20 per cent) at the two frequencies; the ratio of degrees of polarization was 1.0. There is therefore no detection of radio depolarization in 3C 223, though we emphasise that the steep spectrum of the lobes means that there is essentially no detectable 8-GHz lobe flux density within 45 arcsec of the radio core. We conclude that it is unlikely that sufficient cold gas is present in the lobes of either source to allow supersonic lateral expansion.
The presence of sufficient low-energy electrons to provide significant pressure would require a steepening of the electron energy spectrum below the observable radio region (e.g. ). Such a population of electrons cannot be ruled out by our data; however, its physical origin is unclear. If relativistic protons are providing the additional pressure, then large proton to electron ratios would be needed for supersonic expansion. There are arguments suggesting that a significant proton population is required in parsec-scale jets (e.g. Celotti & Fabian 1993), so that they should be present and provide pressure in the lobes as well. We cannot rule out some contribution from protons.
In the absence of efficient entrainment, there are few physically plausible means for the lobes to contain sufficient pressure to be expanding supersonically in all directions. We cannot rule out magnetic domination in the lobes or a dominant population of relativistic protons. However, as discussed above, either of these scenarios requires the X-ray flux from a power-law model to coincide with the level expected for minimum energy IC emission in the absence of protons.
5 Conclusions
We have detected X-ray emission from the lobes of two FR-II radio galaxies, 3C 223 and 3C 284, which in both cases can be attributed to inverse-Compton emission from cosmic microwave background photons. In both cases the magnetic field strengths inferred from the levels of X-ray flux are near to minimum energy values in the absence of protons. We also detect extended emission surrounding the two sources. Both sources are in large group-scale atmospheres with temperatures of 1 keV. Our data are not of sufficient sensitivity to detect temperature variations in the hot-gas atmosphere. We find that the lobes are in approximate pressure balance with their external environments if they contain only relativistic electrons, but that additional material or magnetic dominance would be required in a model where the lobes have lateral supersonic expansion.
Acknowledgments
We thank the referee for helpful comments. JHC thanks PPARC for a studentship. MJH thanks the Royal Society for a research fellowship. The National Radio Astronomy Observatory is a facility of the National Science Foundation operated under cooperative agreement by Associated Universities, Inc.
References
- [] Allen S.W., Fabian A.C., Idesawa E., Inoue H., Kii T., Otani C., 1997, MNRAS, 286, 765
- [] Belsole E., Worrall D.M., Hardcastle M.J., Birkinshaw M., Lawrence C.R., 2004, MNRAS, in press
- [] Bicknell G.V., 1984, ApJ, 286, 68
- [] Birkinshaw M., Worrall D.M., 1993, ApJ, 412, 568
- [] Brunetti G., Setti G., Comastri A., 1997, A&A, 325, 898
- [] Brunetti G., 2000, Astroparticle Physics, 13, 107
- [] Brunetti G., Bondi M., Comastri A., Pedani M., Varano S., Setti G., Hardcastle M.J., 2001, ApJ, 561, 157
- [] Celotti A., Fabian A.C., 1993, MNRAS, 164, 228
- [] Croston J.H,. Hardcastle M.J., Birkinshaw M., Worrall D.M., 2003, MNRAS, 346, 1041
- [] Eracleous M., Halpern J.P., Livio M., 1996, ApJ, 459, 89
- [] Falle S.A.E.G., 1991, MNRAS, 250, 581
- [] Gliozzi M., Sambruna R.M., Brandt W.N., 2003, A&A, 408, 949
- [] Gliozzi M., Sambruna R.M., Brandt W.N., Mushotzky R., Eracleous M., 2004, A&A, 413, 139
- [] Hardcastle M.J., Worrall D.M., Birkinshaw M., 1998a, MNRAS, 296, 1098
- [] Hardcastle M.J., Alexander P., Pooley G.G., Riley J.M., 1998b, MNRAS, 296, 445
- [] Hardcastle M.J., Worrall D.M., 1999, MNRAS, 309, 969
- [] Hardcastle M.J., Worrall D.M., 2000a, MNRAS, 319, 562
- [] Hardcastle M.J., Worrall D.M., 2000b, MNRAS, 314, 359
- [] Hardcastle M.J., Birkinshaw M., Worrall D.M., 2001, MNRAS, 323, L17
- [] Hardcastle M.J., Birkinshaw M., Cameron R.A., Harris D.E., Looney L.W., Worrall D.M., 2002a, ApJ, 581, 948
- [] Hardcastle M.J., Worrall D.M., Birkinshaw M., Laing R.A., Bridle A.H., 2002b, MNRAS, 334, 182
- [] Hardcastle M.J., Worrall D.M., Kraft R.P., Forman W.R., Jones C., Murray S.S., 2003, ApJ, 593, 169
- [] Harris D.E., Carilli C.L., Perley R.A., Nature, 367, 713
- [] Harris D.E., Krawczynski H., 2002, ApJ, 565, 244
- [] Isobe N. et al., 2002, ApJ, 580, 111
- [] Kaiser C.R., Alexander P., 1997, MNRAS, 292, 723
- [] Kataoka J. et al., 2003, A&A, 410, 833
- [] Kraft R., Vazquez S., Forman W.R., Jones C., Murray S.S., Hardcastle M.J., Worrall D.M., Churazov E., 2003, ApJ, 592, 129
- [] Laing R.A., Bridle A.H., 2002, MNRAS, 336, 1161
- [] Laing R.A., Riley J.M., Longair M.S., 1983, MNRAS, 204, 151
- [] Laing R.A., 1984, in Bridle A.H., Eilek J., eds, Physics of Energy Transport in Radio Galaxies, NRAO Workshop no. 9, NRAO, Green Bank, West Virginia, p90
- [] Leahy J.P., Pooley G.G., Riley J.M., 1986, MNRAS, 222, 753
- [] Leahy J.P., Perley R.A., 1991, AJ, 102, 537
- [] Leahy J.P. et al., 1997, MNRAS, 291, 20
- [] Mason K.O. et al., 2000, MNRAS, 311, 456
- [] Meisenheimer K., Haas M., M’́uller S.A., Chini R., Klaas U., Lemke D., 2001, a&A, 372, 719
- [] Morganti R., Fanti R., Gioia I.M., Harris D.E., Parma P., de Ruiter H., 1988, A&A,189, 11
- [] Neugebauer G., Oke J.B., Becklin E.E., Matthews K., 1979, ApJ, 230, 79
- [] Protassov R., van Dyk D.A., Connors A., Kashyap V.L., Siemiginowska A., 2002, ApJ, 571, 545
- [] Ptak A., Yaqoob T., Serlemitsos P.J., Kunieda H., Terashima Y., 1996, ApJ, 459, 542
- [] Sambruna R.M., Eracleous M., Mushotzky R.F., 1999, ApJ, 526, 60
- [] Spinoglio L., Malkan M.A., Rush B., Carrasco L., Recillas-Cruz, E., 1995, ApJ, 453, 616
- [] Urry C.M., Padovani P., 1995, PASP, 107, 803
- [] Worrall D.M., Birkinshaw M., 2000, ApJ, 530, 719
- [] Young A.J., Wilson A.S., Terashima Y., Arnaud K.A., Smith D.A., 2002, ApJ, 564, 176