Co-moving space density of X-ray-selected Active Galactic Nuclei
Abstract
For measurement of the AGN luminosity function and its evolution, X-ray selection samples all types of AGN and provides reduced obscuration bias in comparison with UV-excess or optical surveys. The apparent decline in optically-selected quasars above may be strongly affected by such a bias. The Chandra Multiwavelength Project (ChaMP) is characterizing serendipitously detected X-ray sources in a large number of fields with archival Chandra imaging. We present a preliminary measure of the co-moving space density using a sample of 311 AGN found in 23 ChaMP fields ( deg2) supplemented with 57 X-ray bright AGN from the CDF-N and CDF-S. Within our X-ray flux ( erg cm-2 s-1) and optical magnitude () limits, our sample includes 14 broad emission line AGN at . Using this X-ray selected sample, we detect a turnover in the co-moving space density of luminous type 1 AGN (log ; units erg s-1; measured in the 0.3–8.0 keV band and corrected for Galactic absorption) at . Our X-ray sample is the first to show a behavior similar to the well established evolution of the optical quasar luminosity function. A larger sample of high redshift AGN and with a greater fraction of identified sources, either spectroscopic or photometric, at faint optical magnitudes () are required to remove the remaining uncertainty in our measure of the X-ray luminosity function, particularly given the possibility that AGNs might be more easily obscured optically at high redshift. We confirm that for , lower luminosity AGN (log ) are more prevalent by more than an order of magnitude than those with high luminosity. We have combined the Chandra sample with AGN from the ROSAT surveys to present a measure of the space density of luminous type 1 AGN in the soft X-ray band (0.5–2.0 keV) which confirms the broad band turnover described above.
Subject headings:
galaxies: active — quasars: general — X-rays: galaxies — surveys1. Introduction
Optical surveys have measured the evolution of QSOs out to (Fan et al., 2004). The most dramatic feature found is the rise and fall of the co-moving space density with peak activity at . A systematic decrease in luminosity from to the present is evident with very few intrinsically bright QSOs in the local universe (e.g., Croom et al. 2004). This fading of the QSO population is attributed to a decreased fuel supply and/or fueling rate (e.g., Cavaliere & Vittorini 2000; Kauffmann & Haehnelt 2000). The dropoff in the space density at (e.g., Warren, Hewett & Osmer 1994; Schmidt, Schneider & Gunn 1995; Fan et al. 2001; Wolf et al. 2003) could represent the growth phase of supermassive black holes (SMBHs), possibly under a veil of obscuration (Fabian, 1999).
It has become clear in the past decade that X-ray selection of AGN offers many benefits over detection methods in other wavebands. X-rays can penetrate large absorbing columns of gas which can effectively hide an accreting black hole in the optical. The existence of a significant, missed population of obscured AGN is required to explain the spectral shape of the Cosmic X-ray Background (CXRB; e.g., Gilli, Salvati & Hasinger 2001). The current generation of X-ray observatories (Chandra, XMM-Newton) are probing the faint source population responsible for the bulk of the CXRB (e.g., Alexander et al. 2003; Rosati et al. 2002; Hasinger et al. 2001).
X-ray surveys with Chandra, XMM-Newton and are refining our knowledge of the AGN X-ray luminosity function. The peak, in the co-moving space density of low luminosity ( erg s-1) AGN found in hard (2–10 keV) X-ray surveys (Barger et al. 2003; Cowie et al. 2003; Fiore et al. 2003; Steffan et al. 2003; Ueda et al. 2003), occurs at . This contrasts starkly with the behavior of the luminous ( erg s-1) QSOs which are most prevalent at . Using a highly complete sample of 941 AGN selected in the soft band, Hasinger, Miyaji & Schmidt (2005) show the same luminosity dependence and extend the space density measurement of low luminosity AGN ( erg s-1) out to . These latest results clearly require a luminosity dependent density evolution model (Miyaji, Hasinger & Schmidt, 2000) in contrast to a ’pure’ luminosity evolution model, descriptive of optically selected QSOs (Croom et al., 2004). With these results, semi-analytic models (Menci et al., 2004) posit that the more luminous QSOs illuminate early epochs when most of the massive galaxies are forming (), thereby inducing high accretion rates, whereas lower luminosity AGN dominate at a later period () when most of the galaxies have fully assembled.
X-ray selected QSOs from ROSAT have hinted at a constant space density between (Miyaji, Hasinger & Schmidt, 2000) for the most luminous AGN (log ). The lack of a decline in the space density at , in contrast to the behavior seen in optical surveys, could be evidence for obscuration at early epochs. We can test this model (Fabian 1999) by measuring the luminosity function and co-moving space density of X-ray-selected AGN over a wide area to compile a significant sample at . Unfortunately, the ROSAT sample includes only 7 QSOs at these high redshifts. Of these, only 5 QSOs have luminosities high enough to be detected over a broad range of redshift () and thereby included in the measurement of the co-moving space density (Miyaji, Hasinger & Schmidt, 2000). While the Chandra and XMM-Newton Deep field observations have great scientific merit, their narrow area provides only 4 high luminosity (log ) AGN at . Recent measurement of the hard X-ray luminosity function (Barger et al. 2003; Fiore et al. 2003; Steffan et al. 2003; Ueda et al. 2003) have limited numbers of AGN at these high redshifts. A wider area survey is needed to compile a significant sample of highly luminous QSOs with redshifts greater than 3.
We present a preliminary measure of the co-moving space density of X-ray selected AGN out to from the Chandra Multiwavelength Project (ChaMP). We supplement the ChaMP sample with AGN of comparable X-ray and optical fluxes from the Chandra Deep Field North (CDF-N) and South (CDF-S) to boost our spectroscopic completeness at faint optical magnitudes and include one additional QSO. We merge the subsample of these AGN detected in the soft (0.5–2.0 keV) band with those from ROSAT to directly compare with Miyaji et al. (2000, 2001). A full presentation of the ChaMP X-ray luminosity function is forthcoming (Silverman et al. 2005, in preparation). We assume H km s-1 Mpc-1, , and with the exception of Section 6.2.
2. Chandra Multiwavelength Project
The ChaMP (Kim et al. 2004a; Green et al. 2004) is carrying out an extragalactic X-ray survey encompassing 10 deg2 using serendipitous detections in archival Chandra fields. small point spread function ( resolution on-axis) and low background allow sources to be detected to fainter flux levels ( erg cm-2 s-1) than any X-ray observatory past or present, thus enabling the detection of high redshift () AGN (Treister et al. 2004; Barger et al. 2003; Castander et al. 2003; Silverman et al. 2002). For the present study, we use the full Chandra energy range (0.3–8.0 keV) to detect the absorbed sources missed by previous optical, UV or soft X-ray surveys and take advantage of the high collecting area at soft energies to detect the faint, high redshift AGN. At , we are sensitive to AGN with absorbing columns up to cm-2 due to the favorable -correction. With a sample of AGN selected from a large number of non-contiguous Chandra fields that reach similar depths ( erg cm-2 s-1), we effectively smooth out any effects from large scale structures such as those evident in the CDF-S (Gilli et al., 2003).
We have chosen 23 Chandra fields (1.8 deg2) for which we have acquired extensive followup optical imaging and spectroscopy. The deepest observations have exposure times that are sensitive to sources with erg cm-2 s-1. A full description of the ChaMP image reduction and analysis pipeline XPIPE can be found in Kim et al. (2004b). With our 4m MOSAIC optical imaging, we are able to identify counterparts to the Chandra sources down to (Green et al., 2004). We acquire optical imaging in three ( and ) Sloan Digital Sky Survey (SDSS) filters (Fukugita et al., 1996). Optical colors provide preliminary source classification and crude photometric redshifts. These diagnostics are required to characterize the optically faint X-ray sources that cannot be identified with spectroscopy and in particular, their influence on the X-ray luminosity function. The use of the SDSS photometric system allows more direct comparison between the ChaMP and the SDSS AGN surveys (Silverman et al., 2004). Optical spectroscopic followup currently focuses on identifying counterparts with for which spectra can be acquired on a 4-6m (i.e. MMT, Magellan, WIYN, CTIO Blanco) class telescope. To date, we have spectroscopically classified a sample of 358 AGN detected in the broad band (0.3–8.0 keV) in these 23 ChaMP fields.
3. X-ray sensitivity and area coverage
There are complications with measuring the X-ray luminosity function that must be put into context. The difficulty in focusing X-rays results in a point source function (PSF) and flux sensitivity that varies across the field of view. The PSF degrades as a function of off-axis angle, decreasing the flux sensitivity. In terms of measuring the luminosity function, it is not a trivial task to determine the incompleteness at the faintest X-ray fluxes and the actual sky area over which a source of a specific flux would be detected. In addition, the exposure times of these Chandra fields range from 17 to 114 ksec generating a wide range of limiting fluxes even on-axis.
To characterize the sensitivity, completeness, and sky area coverage as a function of X-ray flux, a series of simulations were performed. The full details will be presented in an upcoming ChaMP X-ray analysis paper (M. Kim, D.-W Kim et al., in preparation). The simulations consists of three parts, 1) generating artificial X-ray sources with MARX (MARX Technical Manual111http://space.mit.edu/CXC/MARX) and adding them to real X-ray images, 2) detecting these artificial sources by wavdetect and extracting source properties with XPIPE identically as performed for actual sources, and 3) estimating the sky area coverage by comparing the input and detected source properties as a function of flux. The simulations are restricted to specific CCDs for ACIS-I (I0, I1, I2, and I3) and ACIS-S (I2, I3, S2, and S3). These CCDs are closest to the aimpoint for each observation. Sources far off-axis () are excluded since the flux sensitivity is low and the PSF is degraded. These simulations allow determination of corrections for the source detection incompleteness at faint flux levels quantified in the first ChaMP X-ray analysis paper (Kim et al., 2004b). In Figure 1, we show the sky coverage determined from the simulations using the broad (0.3–8.0 keV) and soft (0.5–2.0 keV) band source detections for 23 ChaMP fields. We are surveying a sky area of 1.8 deg2 for the brightest sources. The sky area falls below 0.1 deg2 at the faintest flux levels.


4. AGN selection
In these ChaMP fields, we find a diversity of objects (AGN, clusters, galaxies, and stars), although 85% of them are attributed to an AGN (Green et al. 2004; Silverman et al. 2004). We show the optical magnitude () as a function of 0.3–8.0 keV X-ray flux for the sources detected in 23 ChaMP fields (Figure 2). We only include sources with greater than 9.5 net counts. Although sources with counts as low as 2 may be significant detections as a result of Chandra’s low background, we use a higher count limit to ensure that we have well-measured X-ray fluxes within our sample. In Figure 2 we label sources as classified from our optical spectroscopy. Extragalactic objects with strong emission lines (W ) are labelled as either Broad Line AGN (BLAGN; FWHM 1000 km s-1) or Narrow Emission Line Galaxy (NELG; FWHM 1000 km s-1). The BLAGN are equivalent to type 1 AGN. We loosely refer to the NELG with erg s-1 as type 2 AGN since optical spectra may not cover all the emission lines needed to confirm photoionization from a non-thermal source. Extragalactic counter-parts with weak emission line (W ) or pure absorption line spectra are classified as Absorption Line Galaxy (ALG). In addition, a handful of stars are identified at faint X-ray fluxes. Six clusters have been found based primarily on their extended X-ray emission.
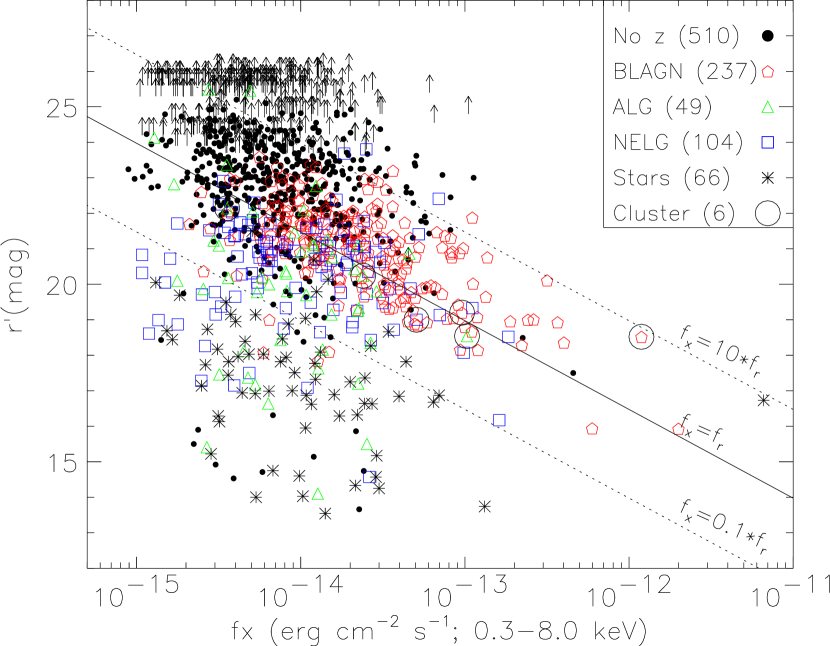
We calculate the rest frame (0.3–8.0 keV; erg s-1) X-ray luminosity for each extragalactic source, after correction for Galactic absorption. The conversion from X-ray count rate to flux units (erg cm-2 s-1 ) is determined from simulated detections on each CCD of a source with a powerlaw spectrum222The ChaMP XPIPE (Kim et al., 2004b) provides energy conversion factors (ECF) for two models with and . We chose the former since the photon index more closely resembles the majority of the X-ray source detections with spectroscopic identification. (;) and galactic absorption (Dickey & Lockman, 1990). The observed luminosity is converted to the rest frame assuming a powerlaw spectrum with the photon index () set to the average value for that object type (BLAGN, NELG, ALG) based upon our X-ray spectral fit results (Aldcroft et al. in preparation). We find that the BLAGN have a mean spectral index () of 1.9 while the NELG have =0.9 and ALG have flatter slopes =1.5. We do not apply a correction for intrinsic absorption due to the uncertainty in the absorbing columns for most of these AGN as a result of their low X-ray counts.
To construct a pure AGN sample, we require the derived (rest frame 0.3–8.0 keV) luminosity to exceed 1042 erg s-1 thereby excluding any sources that contain a significant stellar or hot ISM component. As shown in Figure 3, we see that 92% of the extragalactic sources in the ChaMP not associated with an extended X-ray emitting cluster satisfy this criterion. We currently have not identified any NELG and ALG above a redshift of 1 in the ChaMP. Our optical spectroscopic limit () precludes classification of objects with heavy optical extinction beyond this redshift, since a elliptical host galaxy has at . We detect many optical type 2 AGN with erg s-1 but no luminous ( erg s-1) optical type 2 QSOs. We do find 6% of the BLAGN to be X-ray absorbed with a substantial fraction having reddened optical colors which may prevent them from being selected in optical surveys (Silverman et al., 2004). These red BLAGN may be similar to those found by the Two Micron All Sky Survey (Francis, Nelson & Cutri, 2004) that tend to have significant X-ray absorbing columns of gas (Wilkes et al., 2002). Deep optical followup of a broadband X-ray-selected sample will help determine the fraction of such red quasars to the space density of X-ray luminous AGN.

5. Survey completeness
We have supplemented our ChaMP sample with X-ray sources from the CDF-N (Brandt et al., 2001; Barger et al., 2002) and CDF-S (Szokoly et al., 2004) with X-ray fluxes above our chosen limit (see below; erg cm-2 s-1). These samples allow us to boost the number of spectroscopically identified sources at faint optical magnitudes () and include any additional AGN. These are currently the only surveys with published optical spectroscopic identifications at moderate completeness levels for sources with flux levels comparable to the ChaMP. In Figure 4 , we plot the flux distribution of X-ray sources found in these 25 Chandra fields. The CDF-N and CDF-S clearly contribute most of the faint sources (log ). In Figure 4 , we show the optical magnitude distribution of counterparts to sources with X-ray fluxes above our chosen limit and those with optical spectroscopic identifications. Optical magnitudes for the CDF N+S sources were converted from the Johnson (B, R) to the SDSS photometric system using the transformation in Fukugita et al. (1996). By including these two deep Chandra fields, our area coverage is larger than that shown in Figure 1. We add a fixed area of 0.22 deg2 since the area coverage in these two fields does not change above this bright flux limit by more than 3%.


To evaluate the status of our optical followup and determine effective survey limits, we measure the fraction of X-ray sources identified with optical spectroscopic observations as a function of X-ray flux and optical magnitude. Since the X-ray sources do not fully sample the plane (Figure 2), we have implemented an adaptive binning scheme identical to that of Sanders & Fabian (2001) to generate a completeness map as a function of X-ray and optical flux for the combined sample (ChaMP + CDF-N + CDF-S). We create an array with 6464 elements covering the plane (Figure 2). The identified fraction is measured at each element as the number of identified objects divided by the number of X-ray sources. If 10 or more X-ray sources are in a single element, then we assign as the completeness level. We then increase the bin size by a factor of two. If the binned element has 10 or more objects, the individual elements not previously assigned an identified fraction are set to this value. This procedure is iterated until the final binned element equals the size of the full array. In Figure 5, we plot the final array (i.e. completeness map) as a grey scale image.
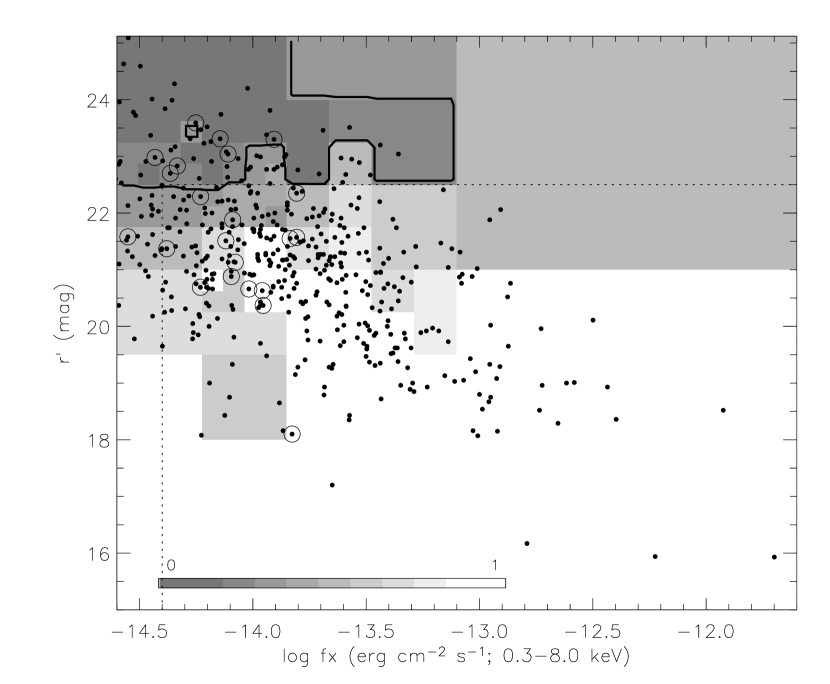
Based on Figure 5, we set the flux limits of our AGN sample. We choose a single X-ray flux limit at erg cm-2 s-1 that is brighter than the faintest X-ray detections in the ChaMP. This limit ensures that we minimize the bias towards optically bright AGN at the faintest X-ray flux limits. In order to limit our completeness correction to , we set an optical magnitude limit at a level where at least 30% of the sources are identified, this leads to a magnitude limit of 22.5. With the remaining sample, the incompleteness level is used to correct the measurement of the space density (Section 6).
In Figure 5, we plot the location of AGN, including those from the Chandra Deep Fields in the plane. Since a significant number of AGN fall in regions of low completeness at faint fluxes, we must exclude 8 of the 22 AGN with and log (circled points). In particular, the highest redshift AGN (CXOMP J213945.0-234655; ; Silverman et al. 2002) found by the ChaMP has been excluded not because of its X-ray flux ( erg cm-2 s-1) but rather due to its optical magnitude () which falls below our limit. We do have a significant sample of 368 AGN above our flux limits with 14 (13 from ChaMP) at , almost a factor of three larger than the high redshift sample available from ROSAT. In Figure 6, we plot the distribution of the total sample of 368 AGN selected in the 0.3-8.0 keV band.

6. Co-moving space density
We implement the 1/Va method (Schmidt, 1968) to generate an estimate to the co-moving space density ( in units of Mpc-3; Equation 1) in fixed redshift and luminosity intervals. For each bin, Equation 1 is summed over all AGN (N) from our sample (Figure 6) that fall within this bin.
| (1) |
As mentioned in Section 3, our survey has non-contiguous sky coverage with varying flux limits. To account for this, we determine the accessible volume (Equation 2) over which an individual AGN will be included in our sample, given the X-ray and optical flux limits.
| (2) |
We calculate the X-ray and optical limiting redshifts (, ) for each object. The integrand in Equation 2 is summed from to where is the smaller of and if the AGN cannot be detected over the full redshift interval. The solid angle (d) is a function of X-ray flux as shown in Figure 1 plus an additional 0.22 deg2 contributed by the Chandra Deep Fields observations. A correction factor (), determined from the location of an individual AGN in the plane (Figure 5), compensates for the incompleteness in our spectroscopic identifications as detailed in the previous section. Each AGN contributes ()-1 to the space density in a specific luminosity and redshift interval. We estimate 1 errors based on a Poisson distribution due to the small number of objects per redshift bin. While there are known biases inherent in the 1/Va method (e.g. Miyaji, Hasinger & Schmidt 2001; Page & Carrera 2000), the overall evolutionary trends can be discerned (e.g. Barger et al. 2003; Cowie et al. 2003; Fiore et al. 2003). A detailed X-ray luminosity function, will be presented in a future publication (Silverman et al. in preparation), while implementing more sophisticated analysis techniques (e.g. maximum likelihood method).
6.1. Broad band (0.3–8.0 keV)
We measure the co-moving space density (Equation 1) of AGN detected in the broad band from 25 Chandra fields. In Figure 7, the number density is plotted in three luminosity bins (; ; ; is in units of erg s-1) as a function of redshift. We must keep in mind that we are limited to the detection of obscured AGN (type 2) at luminosities below erg s-1 and redshifts below 1 due to our optical spectroscopic limit as shown in Figure 3. As a result, the highest luminosity range () is restricted to type 1 AGN only. To account for the optically faint (), spectroscopically unidentified X-ray sources, we remove the optical flux limit and implement the method of Cowie et al. (2003) and Barger et al. (2003) to measure upper limits to the space density. We have assigned all unidentified sources to each feasible bin with the redshift and luminosity set to the mean value. With this method, a specific source usually falls within multiple bins.

At , the low luminosity (log ) AGN are more than an order of magnitude more numerous than those with high luminosity, thus confirming recent results (Cowie et al., 2003; Fiore et al., 2003; Ueda et al., 2003). This is evident even when considering the unidentified population since the upper limit to the space density of luminous AGN (log ) at is fairly constrained. From Figure 3, we see that most of the sources contributing to the space density at are non-BLAGN. These results agree with those reported by Steffan et al. (2003) that show type 2 AGN as the dominant population at . The peak values of the two lower luminosity curves ( Mpc-3) agree with those from the soft (0.5–2.0 keV) X-ray luminosity function (Hasinger, Miyaji & Schmidt, 2005).333Also reproduced in Figure 8a of a review article on deep extragalactic X-ray surveys by Brandt & Hasinger (2004). We find the space density a factor of 3 less, for AGN with at , than the hard (2-10 keV) X-ray survey results of Ueda et al. (2003). These comparisons seem reasonable since our broad band (0.3-8.0 keV) selected sample will be affected by absorption as known to occur in samples selected in the soft band (0.5-2.0 keV).
For the luminous AGN (log 44.5), we measure a rise and fall of the number density with a peak at . With 14 AGN in the high redshift bin (), we have evidence for a drop in the density that is inconsistent (at ) with the peak value found at . This result is not strongly affected by our bright optical magnitude limit since most AGN at do not all fall near the flux limit as shown in Figure 5. However, given the large numbers of unidentified soures, the upper limits to the space density at (Figure 7) show considerable uncertainty. A higher fraction of identified X-ray sources is required to determine if a decline is present with high significance. The peak in the space density appears to shift to lower redshift with decreasing luminosity as modelled by luminosity-dependent density evolution (Ueda et al. 2003; Miyaji, Hasinger & Schmidt 2000), in contrast to ’pure’ luminosity evolution reported by the optical surveys of bright quasars (e.g. Croom et al. 2004).
6.2. Soft band (0.5–2.0 keV): Chandra + ROSAT
With broad energy range, we can select an AGN sample in the soft band (0.5–2.0 keV) to directly compare with the ROSAT results. The ChaMP AGN, supplemented by those in the Chandra Deep Fields, can be combined with the ROSAT sample (Miyaji, Hasinger & Schmidt, 2000) to measure the number density of AGN in the soft band with significant numbers of type 1 AGN up to . The ROSAT sample is a compilation of AGN found in surveys spanning the pencil beam (0.3 deg2), deep Lockman Hole (Lehmann et al., 2001) to the wide area ( deg2), shallow ROSAT Bright survey (Schwope et al., 2000). To directly compare with the published results from the ROSAT and optical surveys such as the 2dF (Croom et al., 2004), SDSS (Fan et al., 2001), and COMBO-17 (Wolf et al., 2003), we use cosmological parameters , , H km s-1 Mpc-1. The luminosity is calculated in the observed frame (no -correction) to compare with the ROSAT results (Miyaji, Hasinger & Schmidt, 2000). We have assembled a total of 1004 AGN with erg s-1, erg cm-2 s-1, and 22.5 (Figure 8). The ChaMP AGN boost the numbers at high redshift and lower luminosity due to faint limiting flux. Following the analysis of Miyaji, Hasinger & Schmidt (2000), we measure the co-moving space density for luminous (log ) AGN to ensure that we are sensitive to these objects out to . This minimum luminosity ensures that our measurements are not highly biased by our X-ray flux limit.

In Figure 9, we plot the co-moving space density of the 217 most X-ray luminous AGN. With these highly luminous AGN, we can compare the space density to past ROSAT results and optical surveys out to high redshift (). To easily compare the space density evolution from optical surveys, in Figure 9, we have renormalized their curves to match the ChaMP at . For all but the COMBO-17 survey, optical space densities () have been scaled up by a factor of 3.2. COMBO-17 survey, which reaches much greater depths () was scaled down by a factor of 7.1. Some caution must be taken when comparing to optical surveys with vastly different magnitude limits. For example, the AGN in the 2dF survey evolve faster than those from X-ray selected samples at (Figure 9). The COMBO-17 survey, which probes similar absolute magnitudes (M) as the ChaMP, may show evolution rates comparable to the X-ray surveys over the redshift interval .

The number density of our combined sample is similar to the ROSAT results with . Our larger sample (12), while statistically consistent with the earlier results of Miyaji, Hasinger & Schmidt (2000), has smaller errors and shows a decrease in the space density from to significant at the 4.6 level. Even with the addition of ROSAT AGN, we have a slightly smaller sample at than in the broad band sample (Section 6.1) due to lower fluxes, luminosity or counts in the soft band for the ChaMP AGN. We find reasonable agreement with a slight excess between the relative drop in the space density of the X-ray and optical surveys at ; our data are consistent with a decline in the X-ray luminosity function similar to that observed in the optical.
7. Conclusion
We have measured the broad band (0.3–8.0 keV) co-moving space density using a sample of 368 X-ray emitting AGN detected by Chandra. Our spectroscopic magnitude limit to date allows the inclusion of optically obscured AGN to and unobscured AGN out to .
Our primary results are as follows:
-
•
We confirm that low luminosity AGN (log 44.5) are more prevalent at than higher luminosity AGN, as seen by Cowie et al. (2003), Fiore et al. (2003), and Ueda et al. (2003). Non-BLAGN are the major contributor to the co-moving space density at these low redshifts, as reported by Steffan et al. (2003).
-
•
The space density of type 1, highly luminous (log ) X-ray selected AGN rises from the present epoch to a peak at and then declines at . This behavior is similar to that of optically selected surveys. This is the first X-ray selected survey to detect a decline at high redshifts. The evolution is evident using a sample of 311 AGN from the ChaMP selected in the broad (0.3–8.0 keV) Chandra band and 217 luminous QSOs selected in the soft band (0.5–2.0 keV) from Chandra and ROSAT.
Our results support a more rapid depletion of fuel for the high luminosity AGN from to the present epoch (Menci et al., 2004), perhaps due to their higher accretion rate. At , the lower luminosity AGN evolve slowly, which may be attributable to a low accretion rate, compared to the more luminous AGN. At , the decline in the space density of highly luminous AGN represents the growth phase of supermassive black holes during a period of rapid galaxy assembly. The uncertainties in the X-ray luminosity function will improve with larger samples and a higher fraction of source classification, either through spectroscopic or photometric techiques. With the inclusion of obscured, highly luminous QSOs, X-ray surveys are well on the way to presenting a more comprehensive view of AGN evolution.
References
- Alexander et al. (2003) Alexander, D. M. et al. 2003, AJ, 126, 539
- Avni & Bahcall (1980) Avni, Y. & Bahcall, J. N. 1980, ApJ, 235, 694
- Barger et al. (2002) Barger, A. J. et al. 2002, AJ, 124, 1839
- Barger et al. (2003) Barger, A. J., Cowie, L. L., Capak, P., Alexander, D. M., Bauer, F. E., Brandt, W. N., Garmire, G. P., & Hornschemeier, A. E. 2003, ApJ, 584, L61
- Brandt et al. (2001) Brandt, W.N. et al. 2001, AJ, 122, 2810
- Castander et al. (2003) Castander, F. J., Treister, E., Maccarone, T. J., Coppi, P. S., Maza, J., Zepf, S. E., & Guzman, R. 2003, AJ, 125, 168
- Brandt & Hasinger (2004) Brandt, W. N. & Hasinger, G. 2004, ARA&A, 43, 1056
- Cavaliere & Vittorini (2000) Cavaliere, A. & Vittorini, V. 2000, ApJ, 543, 599
- Cowie et al. (2003) Cowie, L. L., Barger, A. J., Bautz, M. W., Brandt, W. N., & Garmire, G. P. 2003, ApJ, 584L, 57
- Croom et al. (2004) Croom, S. M., Smith, R. J., Boyle, B. J., Shanks, T., Miller, L., Outram, P. J., &, Loaring, N. S. 2004, MNRAS, 349, 1397
- Dickey & Lockman (1990) Dickey, J. M., & Lockman, F. J. 1990 ARA&A, 28, 215
- Fabian (1999) Fabian, A. C. 1999, MNRAS, 308, 39
- Fan et al. (2001) Fan, X. et al. 2001, AJ, 121, 54
- Fan et al. (2004) Fan, X. et al. 2004, AJ, 128, 515
- Fiore et al. (2003) Fiore, F. et al. 2003, A&A, 409, 79
- Francis, Nelson & Cutri (2004) Francis, P. J., Nelson, B. O., & Cutri, R. M. 2004, AJ, 127, 646
- Fukugita et al. (1996) Fukugita, M., Ichikawa, T., Gunn, J. E., Doi, M., Shimasaku, K., & Schneider, D. P. 1996, AJ, 111, 1748
- Giacconi et al. (2003) Giacconi, R. et al. 2002, ApJS, 139, 369
- Gilli, Salvati & Hasinger (2001) Gilli, R., Salvati, & M., Hasinger, G. 2001, A&A, 366, 407
- Gilli et al. (2003) Gilli, R. et al. 2003, ApJ, 592, 721
- Green et al. (2004) Green, P. J. et al. 2004, ApJS, 150, 43
- Hasinger et al. (2001) Hasinger, G. et al. 2001, A&A, 365L,45
- Hasinger, Miyaji & Schmidt (2005) Hasinger, G., Miyaji, T., & Schmidt, M. 2005, A&A, submitted
- Kauffmann & Haehnelt (2000) Kauffmann, G. & Haehnelt, M. 2000, MNRAS, 311, 576
- Kim et al. (2004a) Kim, D.-W. et al. 2004a, AJ, 600, 59
- Kim et al. (2004b) Kim, D.-W. et al. 2004b, ApJS, 150, 19
- Lehmann et al. (2001) Lehmann, I. et al. 2001, A&A, 371, 833
- Menci et al. (2004) Menci, N., Fiore, F., Perola, G. C., & Cavaliere, A. 2004, ApJ, 606, 58
- Miyaji, Hasinger & Schmidt (2000) Miyaji, T., Hasinger, G., & Schmidt, M. 2000, A&A, 353, 25
- Miyaji, Hasinger & Schmidt (2001) Miyaji, T., Hasinger, G., & Schmidt, M. 2001, A&A, 369, 49
- Page & Carrera (2000) Page, M. J., Carrera, F. J. 2000, MNRAS, 311, 433
- Rosati et al. (2002) Rosati, P. et al. 2002, ApJ, 566, 667
- Sanders & Fabian (2001) Sanders, J. S. & Fabian, A. C. 2001, MNRAS, 325, 178
- Schmidt, Schneider & Gunn (1995) Schmidt, M., Schneider, D. P., & Gunn, J.E. 1995, AJ, 110, 68
- Silverman et al. (2002) Silverman, J. D. et al. 2002, ApJ, 569, L1
- Silverman et al. (2004) Silverman, J. D. et al. 2004, ApJ, 618, 123
- Steffan et al. (2003) Steffan, A. T., Barger, A. J., Cowie, L. L., Mushotzky, R. F., & Yang, Y. 2003, 596, L23
- Schmidt (1968) Schmidt, M. 1968, ApJ, 151, 393
- Schwope et al. (2000) Schwope, A., Hasinger, G., Lehmann, I., et al. 2000, AN, 321, 1
- Szokoly et al. (2004) Szokoly, G. P. et al. 2004, ApJS, 155, 271
- Treister et al. (2004) Treister. E., Castander, F. J., Maccarone, T. J., Herrera, D., Gawiser, E., Maza, J., & Coppi, P. S. 2004, ApJ, 603, 36
- Ueda et al. (2003) Ueda, Y., Akiyama, M., Ohta, K., & Takamitsu, M. 2003, ApJ, 598, 886
- Warren, Hewett & Osmer (1994) Warren, S. J., Hewett, P. C., & Osmer, P. S. 1994, ApJ, 421, 412
- Wilkes et al. (2002) Wilkes, B. J., Schmidt, G. D., Cutri, R. M., Ghosh, H., Hines, D. C., Nelson, B., & Smith, P. S. 2002, ApJ, 564, L65
- Wolf et al. (2003) Wolf, C., Wisotzki, L., Borch, A., Dye, S., Kleinheinrich, M., & Meisenheimer, K. 2003, A&A, 408, 499