Detection of Lyman- emission from a DLA galaxy: Possible implications for a luminosity-metallicity relation at = 2–3 ††thanks: Based on observations collected at the European Southern Observatory, Paranal, Chile (ESO Programme 66.A-0386(A)
In an ongoing programme to identify a sample of high DLA galaxies we have found the long sought for case of a Ly emitter seen in the centre of a broad DLA trough. This is the predicted “textbook case” of an intervening DLA galaxy if DLA galaxies are small, but would not be expected if intervening high redshift DLA galaxies have large gaseous disks. The Ly flux is similar to what has been found in previously known high DLA galaxies. The impact parameter is found to be . This is smaller than what was found in previous cases but still consistent with random sight-lines through absorbers with mean impact parameter ″. Of the 24 DLAs targeted in the NICMOS imaging survey five have now been identified as Ly emitters. The DLA galaxies with detected Ly emission tend to have higher interstellar metallicities than those with undetected Ly emission. This is plausibly explained as a consequence of a positive correlation between the Ly line luminosities of the galaxies and their metallicities, although the present sample is too small for a definitive conclusion. The available observations of high-redshift DLA galaxies are also consistent with a negative correlation between Ly equivalent widths and metallicities, as seen in nearby star-forming galaxies and usually attributed to the preferential absorption of Ly photons by dust grains.
Key Words.:
galaxies: formation - galaxies: high-redshift - quasars: absorption lines - quasars: individual (PKS 0458-02)1 Introduction
Shortly after publication of the first sample of Damped Ly Absorbers (DLAs, Wolfe et al. 1986) it was suggested that Ly emission from the absorbing galaxies should be detectable as a central spike in the trough of the damped Ly line (Foltz et al. 1986). Two conflicting views on the nature of high redshift DLA galaxies were in disagreement on this prediction. Wolfe (1986) and Smith et al. (1986) both suggested that the 5 times higher cross-section of high-redshift DLAs relative to local spirals indicated that DLAs were fully formed disks with radii times larger than locally. Tyson (1988), on the other hand, argued that DLAs could be gas-rich dwarf galaxies. Two observing strategies were adopted reflecting the two views. Under the assumption that the DLA is small its impact parameter relative to the QSO shall also be small, and therefore a long-slit centred on the QSO should have a high probability of also covering the DLA (e.g. Hunstead et al. 1990). If on the other hand DLAs are large disks they may have large impact parameters relative to the QSOs and narrow band imaging would be a better approach (Smith et al. 1989; Wolfe et al. 1992).
At redshifts photometric redshifts are now known for 11 DLA galaxies (Chen & Lanzetta 2003) but evolutionary models predict that DLA galaxies at higher redshifts are of a different nature (Lanfranchi & Friaca 2003).
In this paper we present the detection of Ly emission from the z=2.0395 DLA towards PKS0458-02 at . This detection was obtained in the course of a spectroscopic investigation of three candidate DLA galaxy counterparts reported by Warren et al. (2001). The Ly emission from the DLA towards PKS0458-02 does not correspond to any of the candidates at projected distances 086-417, on the contrary it is found almost exactly in the centre of the DLA absorption line, thereby presenting itself nicely as a “textbook example” of Ly emission from a high-redshift DLA.
2 Observations and data reduction
Long-slit spectroscopy of PKS0458-02 was obtained during two dark nights at the ESO Very Large Telescope in October 2000. We used FORS1 with the G600B grism and a 131 wide slit providing a spectral resolution of about 7Å FWHM for objects wider than the slit. During read-out we binned the data 2 by 2 providing final pixels of size 04 by 2.22Å. The conditions during observations were photometric and the seeing ranged from 06 to 09 resulting in a resolution of 4-5Å for point sources. A total integration time of 11400 seconds was split as follows: Three 2000 second and one 1400 second exposures at a slit position angle of +550 (East of North); two 2000 second exposures at a slit position angle of +288. The two position angles were chosen to be lined up with three candidate galaxies N-6-1D, N-6-4C, and N-6-5C (Warren et al. 2001). The individual spectra were bias subtracted following standard techniques, but after extensive testing we found that the spectroscopic daytime flats were of inferior quality and that better flat fielding was obtained with a combination of a U band imaging flat and a 1D “along slit efficiency curve”, both obtained during twilight. Acquisition images were taken in R-Bessel and we found R(Bess) = for PKS0458-02.
3 Results
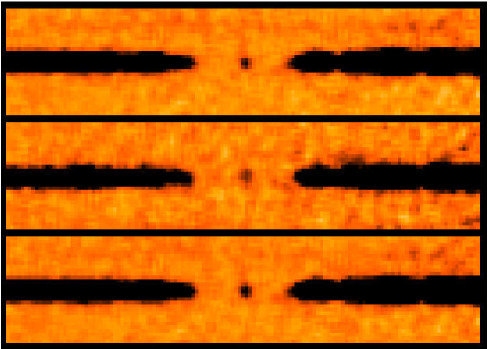
We did not detect emission lines in any of the three targeted candidates (at impact parameters 086, 298, and 417) but at both PAs we clearly detect an emission line in the centre of the DLA absorption line, and at close to zero impact parameter (Fig. 1). Since this object does not appear in any candidate list we shall in what follows name it DLAg0458-02.

At PA=550 and PA=288 we find impact parameters of =013009 and =000016 respectively. In Fig. 2 we show the layout of the slit positions (solid lines) and the 1 ranges of the position of DLAg0458-02 inferred from the two independent detections. In principle two different slit PAs is enough to triangulate for the exact position of the DLA galaxy, but unfortunately the two PAs are rather close to each other so there is still uncertainty about the exact impact parameter.

In Fig. 3 we show an enlargement of the inner 2″ by 2″ where we have calculated the combined 1 contour. The best fit position of DLAg0458-02 is at PA=300o, =03, but the entire PA range from 175o to 315o is allowed to within 1. The full 1 range on is from 00 to 06. There is a hard upper limit of as a larger impact parameter would cause the object to fall outside the slit. We conclude that . An impact parameter of is too small for a detection in the NICMOS survey of Warren et al. (2001).
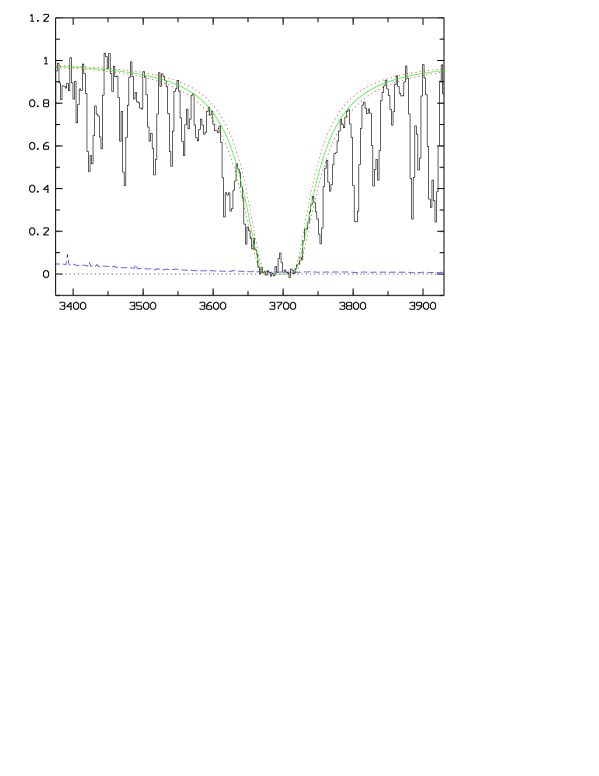
In Fig. 4 we show the 1D extraction of the spectrum (optimally weighted sum of both PAs) and the Ly emission line is clearly seen in the centre of the Damped absorption line. We determine the centroid of the emission line to be at 3696.86Å corresponding to a redshift of 2.0410 which is 148 km s-1 higher than that of the DLA. However, this is only correct if one assumes . For our best fit value of we must correct the redshift for the offset of the object inside the slit and we then obtain a redshift of 2.0396 which is identical to that of the DLA. We shall adopt this latter redshift as the best fit value. The emission line is unresolved at our resolution and we find an upper limit of FWHM Å corresponding to an upper limit of 400 km s-1 FWHM.
As seen in Fig. 4 the absorption profile is well fitted by a damped Ly line with an HI column density of . This is slightly larger than, but consistent with, the values found by Wolfe et al. 1993 () and Pettini et al. 1994 ( ).
The flux of the Ly emission line, as well as other relevant measurements, are summarised in Table 1. The listed on the Ly flux is mostly due to the uncertainty of the correction for slit-losses (which are linked to the error on ), the listed is mostly due to the uncertainty of the flux calibration. The Ly flux of DLAg0458-02 is within the range found for Ly selected galaxies at the same redshift (Fynbo et al. 2002). The continuum of the DLA galaxy is for the most part hidden under the QSO spectrum but a small fraction of it could be visible in the DLA trough. To place a limit on the equivalent width of the emission line we proceeded as follows. On the best fitting Ly absorption line profile () we determined the interval in which the calculated absorption line was completely black (i.e. residual flux below 1/5 of the rms in the data). This is the case over an interval of 38Å. The central 15Å are taken up by the emission line, the rest we summed up to see if a galaxy continuum could be detected. We did not detect any continuum, and we find a 2 lower limit on the observed equivalent width of 47Å or a rest equivalent width of Å ( limit).
A long slit spectrum taken at PA=300o should be obtained in order to verify the best fit impact parameter and PA found via triangulation. This is needed to settle all open questions related to the exact position of DLAg0458-02 inside the slit (redshift, velocity relative to absorber, flux correction for slit loss).
| Quasar redshift | 2.286[1] | |
| Quasar R(Bessel) | ||
| Absorption redshift | 2.0395[1] | |
| NHI | cm-2 | |
| Impact parameter, | ||
| Position angle | degrees (E of N) | |
| Ly emission line redshift | 2.0396[2] | |
| (Ly - DLA) | km s-1 | |
| Ly FWHM | km s-1 | |
| Ly flux | ||
| Ly EWrest | (2 limit) | Å |
[1] Pettini et al. 1994. [2] After correction for inferred offset in slit.
4 Discussion
The Warren et al. (2001) NICMOS imaging survey targeted a sample of 24 DLAs and sub-DLAs ( cm-2, Dessauges-Zavadsky et al. 2003). That sample was selected to cover a wide range in redshifts and in HI column densities but absorber metallicities were not considered. At the time of sample definition precise metallicities were known for only very few DLAs and the sample therefore has no metallicity pre-selection biases. Of the 24 systems five have now been identified as Ly emitters. Three of the five have known metallicities while for one additional system a lower limit to its metallicity has been published. The metallicities and other relevant information for the five identified systems is summarised in Table 2. Metallicities are also known for 13 of the 19 systems for which no Ly emission has yet been reported (Kulkarni & Fall 2002, Prochaska 2003, Dessauges-Zavadsky et al. 2003).
| ID | NICMOS | emission | [M/H] | M | [M/H] | Type | |||||
| ID | ″ | refs. | cm-2 | refs. | km s-1 | ||||||
| DLAg0528–25 | N-7-1C | 2.8110 | 1.14(2) | 1,3,5,10,11 | 21.35 | -0.75,-0.76 | Si,Zn | 14,15 | 2.797 | -1100 | |
| sDLAg2233+13 | N-16-1D | 3.1493 | 2.51(2) | 2,4,10,11,12 | 20.00 | Si | 16 | 3.298 | 10500 | sub-DLA | |
| DLAg0151+04 | - | 1.9342 | 0.93 | 6,7,8,9 | 20.36 | 1.922 | -1200 | ||||
| DLAg2206–19 | N-14-1C | 1.9205 | 0.99(2) | 10,11 | 20.65 | -0.39,-0.42 | Zn,Si | 15,17 | 2.559 | 58600 | DLA |
| DLAg0458–02 | - | 2.0396 | 0.3(3) | 13 | 21.78 | -1.17,-1.19 | Zn,Zn | 15,17 | 2.286 | 23300 | DLA |
(1) Møller & Warren 1993; (2) Steidel et al. 1995; (3) Warren & Møller 1996; (4) Djorgovski et al. 1996; (5) Møller & Warren 1998; (6) Møller et al. 1998; (7) Fynbo et al. 1999; (8) Møller 1999; (9) Fynbo et al. 2000; (10) Warren et al. 2001; (11) Møller et al. 2002; (12) Christensen et al. 2004; (13) This paper; (14) Lu et al. 1996; (15) Kulkarni & Fall 2002; (16) Lu et al. 1998; (17) Prochaska et al. 2003.
4.1 A possible luminosity-metallicity relation for DLA galaxies
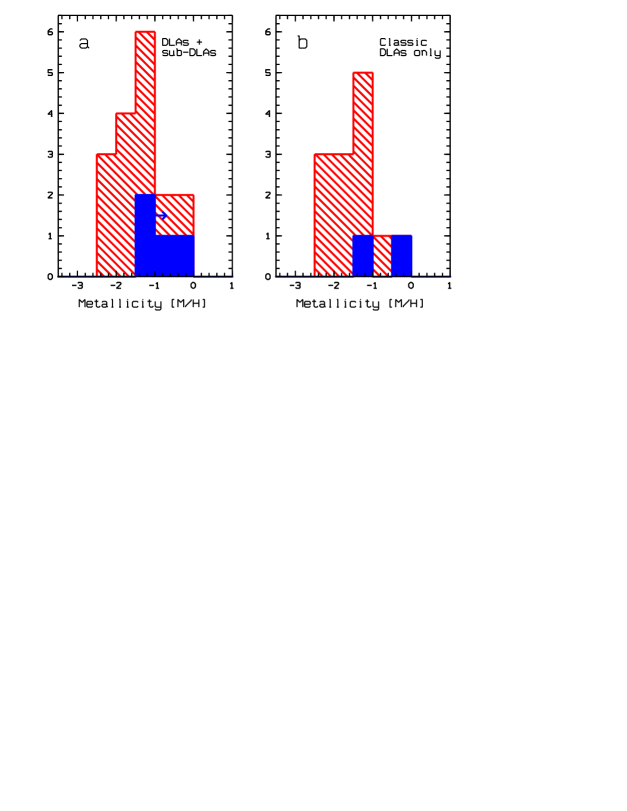
Fig. 5a is a histogram of the interstellar metallicities of the 17 DLA systems in the Warren et al. (2001) NICMOS sample for which the metallicity is known. The subsample of four objects with detected Ly emission is indicated by solid blue bars, while the subsample of 13 systems without detected Ly emission is indicated by red hatched bars. Evidently, there is a tendency for the detected objects to have higher metallicities than the undetected objects, although the sample is too small to draw a definitive conclusion from this comparison. Four of the objects in the Warren et al. sample might not be regarded as “bona fide” DLAs in the sense that they are close to the QSO ( km s-1) or that they have relatively low HI column densities ( cm-2). Fig. 5b shows the metallicity histogram with these objects excluded. Again, the two objects with detected Ly emission have higher metallicities, on average, than the 11 objects without detected Ly emission.
The trend displayed in Figs 5a and 5b is consistent with a positive correlation between Ly line luminosity and metallicity. This in turn is consistent with a correlation between star formation rate, for which Ly is an approximate indicator, and metallicity. For nearby galaxies (), there are well known correlations between star formation rate and mass and between metallicity and mass, in the sense that high-mass galaxies tend to have both higher star formation rates and metallicities than low-mass galaxies, albeit with a great deal of scatter in samples that include a wide or full mix of morphological types (Tamura et al. 2001, Prada & Burkert 2002). If the same kinds of correlations also hold at high redshift, they could explain the observed tendency for DLA galaxies with detectable Ly emission to have higher metallicities than those without detectable Ly emission. Conversely, the available observations of DLA galaxies could be interpreted as (weak) evidence for luminosity-metallicity and mass-metallicity relations at .
The observed trend might, at first sight, appear to contradict the idea that Ly emission is suppressed in galaxies with high dust content and hence high metallicity. Ly photons, which scatter resonantly off H atoms, have a much longer path and a much higher probability of absorption on dust grains than continuum photons, an effect that reduces the equivalent width of the Ly emission line. For nearby star-forming galaxies, the observed Ly equivalent widths show the expected anti-correlation with metallicity, which is usually interpreted as a consequence of absorption by dust (see Fig. 8 of Charlot & Fall 1993). For DLA galaxies at high redshifts, has been measured in three cases and a lower limit placed on it in another case. We have checked that these equivalent widths and the corresponding metallicities are consistent with the - relation for galaxies and hence with the idea that the Ly emission is suppressed by dust.
How can we reconcile these two results, one regarding a positive - correlation, the other a negative - correlation? First, we note that the samples on which these hints are based are still very small, and it is possible they will disappear with more observations. Second, we note that there is no logical contradiction between the two correlations. They can both exist together, as they are observed to do in low-redshift galaxies. The reason this is possible is that dust affects by factors of a few, while spans several orders of magnitude, from low-mass to high-mass galaxies. Thus, a positive - correlation can overwhelm a negative - correlation. More observations are needed to confirm whether similar relations also hold for high- redshift DLA galaxies. For now, we simply note that the available but meager high- data are consistent with both low- relations.
4.2 Sizes and impact parameters of DLAs
The DLA absorber in front of PKS0458-02 was previously (Wolfe et al. 1985) detected as a 21 cm absorber. In particular, because PKS0458-02 has radio structure on a wide range of scales, Briggs et al. (1989) were able to use high-resolution radio interferometry to probe several different paths through the absorbing medium. Using this technique they concluded that the absorber is a disk-like structure that extends across at least 2″. How does this earlier result fit with our detection of an impact parameter of only ?
A measured impact parameter is in each case random and could be anywhere in the range where is the radius of the absorber. Møller & Warren (1998) found that in the mean the measured impact parameter is , so finding a very small for DLAg0458-02 is therefore not in contradiction to the result by Briggs et al. Four optical (Ly) impact parameters have been reported previously: 093 (Fynbo et al. 1999); 099, 114, and 251 (Møller et al. 2002). The median of all five is 099 corresponding to a disk diameter of 36, fully consistent with the Briggs et al. result.
4.3 Concluding remarks
We shall not make any strong statement based on the above discussion but simply point out that the data presented in Fig. 5 are certainly consistent with, and are even weekly supporting, the conjecture that a luminosity-metallicity relation is already in place at redshifts 2-3. In further support of a luminosity-metallicity relation we note that Lyman Break galaxies (LBGs) have metallicities as high as or higher than the most metal rich DLAs at similar redshifts (Pettini et al., 2000, 2001) but based on cross-section selection arguments Fynbo et al. (1999) found that typical DLAs have much lower luminosities than LBGs.
Detection of star formation induced Ly emission from an additional 5-10 DLAs would settle the questions raised above and should therefore be a high priority observational goal. In order to disentangle the dust-attenuation effect from the luminosity-metallicity relation one would need a measure for the galaxy luminosity which is not influenced by dust. This could be obtained via broad band imaging of DLA galaxies with sufficiently large impact parameters, or via detection of H/H emission lines.
If it is confirmed that a luminosity-metallicity relation for DLA galaxies is indeed present then this might reflect an underlying mass-metallicity relation. We have already previously shown that a large fraction of DLA galaxies are too small and too faint to be detected under the glare of the quasar point spread function (Fynbo et al. 1999), but if a mass-metallicity relation is indeed present already at high redshifts then we can add to the previous statement that those DLA galaxies most likely to be undetectable are those with the lowest metallicities, a prediction which could greatly improve the efficiency of follow-up observing campaigns. One further observational prediction would also follow immediately from this. Because the less massive DLA systems have smaller radii we predict a correlation between impact parameter and DLA metallicity.
Acknowledgements.
We are grateful to S. J. Warren for comments on earlier versions of this manuscript and to C. Ledoux for many helpful discussions concerning metallicities of DLAs.References
- (1) Briggs, F.H., Wolfe, A.M., Liszt, H.S. et al. 1989, ApJ, 341, 650
- (2) Charlot, S., & Fall, S.M. 1993, ApJ, 415, 580
- (3) Chen, H.-W., & Lanzetta, K. M. 2003, ApJ, 597,706
- (4) Christensen, L., Sánchez, S.F., Jahnke, K., et al. 2004, A&A, 417, 487
- (5) Dessauges-Zavadsky, M., Péroux, C., Kim, T.-S., et al. 2003, MNRAS, 345, 447
- (6) Djorgovski, S.G., Pahre, M.A., Bechtold, J., & Elston, R. 1996, Nature, 382, 234
- (7) Foltz, C.B., Chaffee, F.H., & Weymann, R.J. 1986, AJ, 92, 247
- (8) Fynbo, J.U., Møller, P., & Warren, S.J. 1999, MNRAS, 305, 849
- (9) Fynbo, J.U., Burud, I., & Møller, P. 2000, A&A, 358, 88
- (10) Fynbo, J.U., Møller, P., Thomsen, B., et al. 2002, A&A, 388, 425
- (11) Hunstead, R.W., Fletcher, A.B., & Pettini, M. 1990, ApJ, 356, 23
- (12) Kulkarni, V.P., & Fall, S.M. 2002, ApJ, 580, 732
- (13) Lanfranchi, G.A., & Friaca, A.C.S. 2003, MNRAS, 343, 481
- (14) Lu, L., Sargent, W.L.W., & Barlow, T.A. 1998, ApJ, 115, 55
- (15) Lu, L., Sargent, W.L.W., Barlow, T.A., et al. 1996, ApJS, 107, 475
- (16) Møller, P. 1999, In: “Astrophysics with the NOT”, H. Karttunen & V. Piirola (edt.), University of Turku, p. 80
- (17) Møller, P., & Warren, S.J. 1993, A&A, 270, 43
- (18) Møller, P., & Warren, S.J. 1998, MNRAS, 299, 661
- (19) Møller, P., Warren, S.J., Fall, S.M., et al. 2002, ApJ, 574, 51
- (20) Møller, P., Warren, S.J., & Fynbo, J.P. 1998, A&A, 330, 19
- (21) Pettini, M., Smith, L.J., Hunstead, R.W., & King, D.L. 1994, ApJ, 426, 79
- (22) Pettini, M., Shapley, A.E., Steidel, C.C., et al. 2001, ApJ, 554, 981
- (23) Pettini, M., Steidel, C.C., Adelberger, K.L., et al. 2000, ApJ, 528, 96
- (24) Prada, F., & Burkert, A. 2002, ApJ-L, 564, L73
- (25) Prochaska, J.X. 2003, ApJ, 582, 49
- (26) Prochaska, J.X., Gawiser, E., Wolfe, A.M., et al. 2003, ApJ-L, 595, L9
- (27) Smith, H.E., Cohen, R.D., & Bradley, S.E. 1986, ApJ, 310, 583
- (28) Smith, H.E., Cohen, R.D., Burns, J.E., et al. 1989, ApJ, 347, 87
- (29) Steidel, C.C., Pettini, M., & Hamilton D. 1995, AJ, 110, 2519
- (30) Tamura, N., Hirashita, H., & Takeuchi, T.T. 2001, ApJ-L, 552, L113
- (31) Tyson, N.D. 1988, ApJL, 329, L57
- (32) Warren, S.J., & Møller, P. 1996, A&A, 311, 25
- (33) Warren, S.J., Møller, P., Fall, S.M., & Jakobsen, P. 2001, MNRAS, 326, 759
- (34) Wolfe, A.M. 1986, Phil. Trans. Roy. Soc. London, A, 320, 435
- (35) Wolfe, A.M., Briggs, F.H., Turnshek, D.A. et al. 1985, ApJ-L, 294, L67
- (36) Wolfe, A.M., Lanzetta, K.M., Turnshek, D.A., & Oke, J.B. 1992, ApJ, 385, 151
- (37) Wolfe, A.M., Turnshek, D.A., Lanzetta, K.M., & Lu, L. 1993, ApJ, 404, 480
- (38) Wolfe, A.M., Turnshek, D.A., Smith, H.E., & Cohen, R.D. 1986, ApJS, 61, 249